The given pie chart shows favorite shows of student of a school
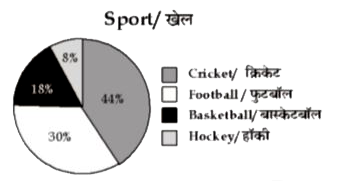
In the given pie chart, what is the difference in percentage between liking for football and basketball
10
8
13
12
The correct Answer is:D
Step by step video & image solution for The given pie chart shows favorite shows of student of a school In the given pie chart, what is the difference in percentage between liking for football and basketball by Maths experts to help you in doubts & scoring excellent marks in Class 14 exams.
Updated on:21/07/2023Topper's Solved these Questions
Similar Questions
The given pie-chart shows favourite sport of students of a school.
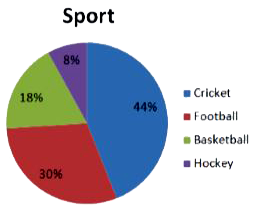
In the given pie-chart, what is the difference in percentage between liking for football and basketball?
View SolutionThe given pie chart shows favorite shows of student of a school
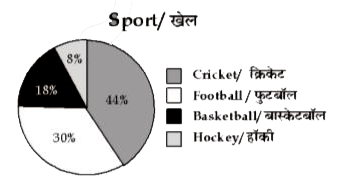
In the given pie chart, if there were 1280 students in all, how many liked football
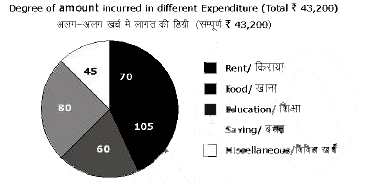
View SolutionIn the given pie chart what is the total expenditure on rent
View SolutionThe given pie-chart shows favourite sport of students of a school.
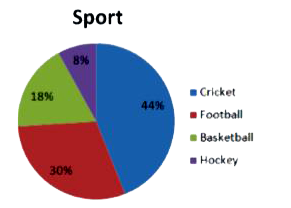
In the given pie-chart, if there were 1280 students in all, how many liked football?
View SolutionThe given pie chart shows favorite sport of students of A school
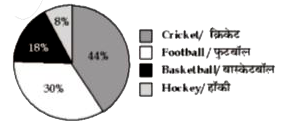
In the given pie chart if the school strength was 2500 how many liked cricket more than hockey?
View SolutionThe given pie-chart shows favourite sport of students of a school.
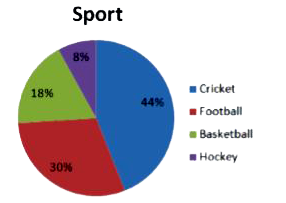
In the given pie-chart, if the school strength was 2500, how many liked cricket more than hockey?
View SolutionThe given pie chart shows runs scored by A in 6 matches
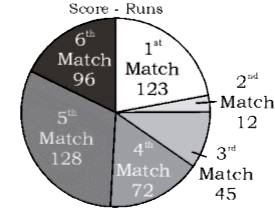
In the given pie chart what is the average runs scored in all matches
View SolutionThe given pie-chart favourite sport of students of a school.
दिया गया पाई चार्ट एक विद्यालय के छात्रों के पसंदीदा खेल को दर्शाता है |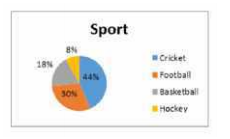 In the given pie-chart, what is the difference in percentage between liking for football and basketball?
इस पाई चार्ट के अनुसार, फुटबॉल तथा बास्केटबॉल पसंद करने के प्रतिशत में क्या अंतर है ?
View SolutionThe given pie chart shows scored by A in 6 matches
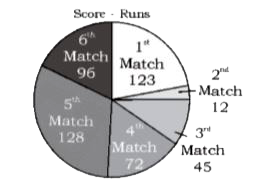
In the given pie chart, what is the increase or decrease in score in match 4 as compared to match 2
View SolutionThe given pie-chart shows runs scored by A in 6 matches.
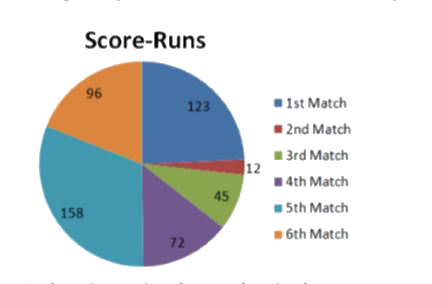
In the given pie-chart. what is the average runs scored in all matches? (rounded off)
View Solution
