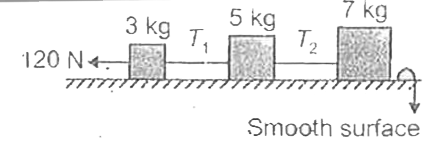
Find T1andT2 in the given figure.
Video Solution
|
Answer
Step by step video & image solution for Find T_(1) and T_(2) in the given figure. by Physics experts to help you in doubts & scoring excellent marks in Class 12 exams.
Updated on:21/07/2023Similar Questions
Knowledge Check
The V - i graph for a conductor at temperature T1 and T2 are as shown in the figure. (T2−T1) is proportional to
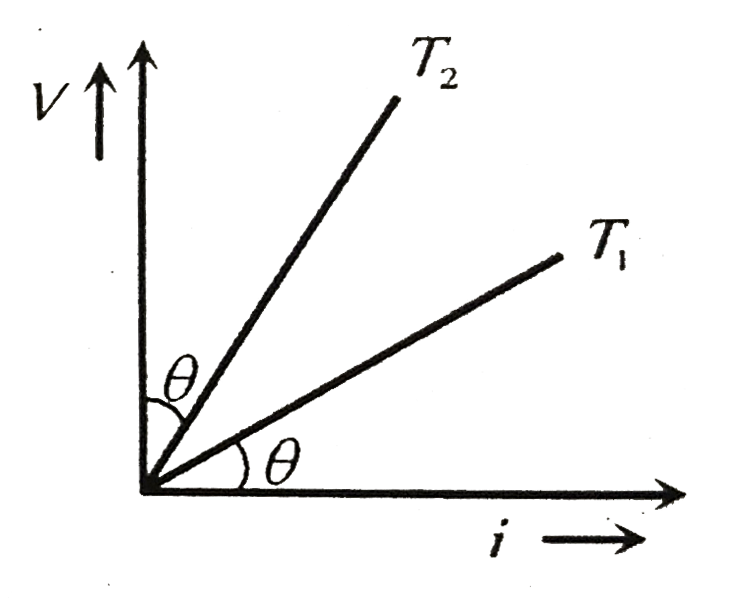 Acot2θBsinθCcot2θDtanθ
The current (I) and voltage (V) graphs for a given metallic wire at two different temperature (T1) and (T2) are shown in fig. It is concluded that
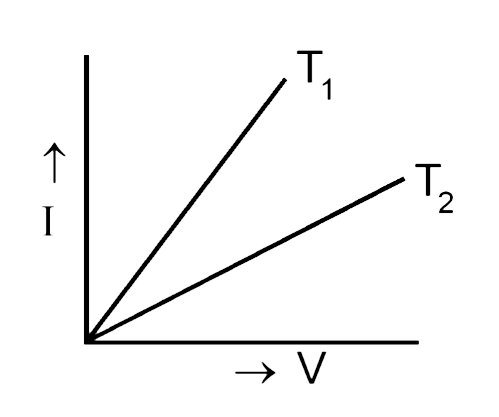 AT1=T2BT1>T2CT1<T2DNone of these
The voltage V and current I graph for a conductor at two different temperatures T1 and T2 are shown in the figure. The relation between T1 and T2 is
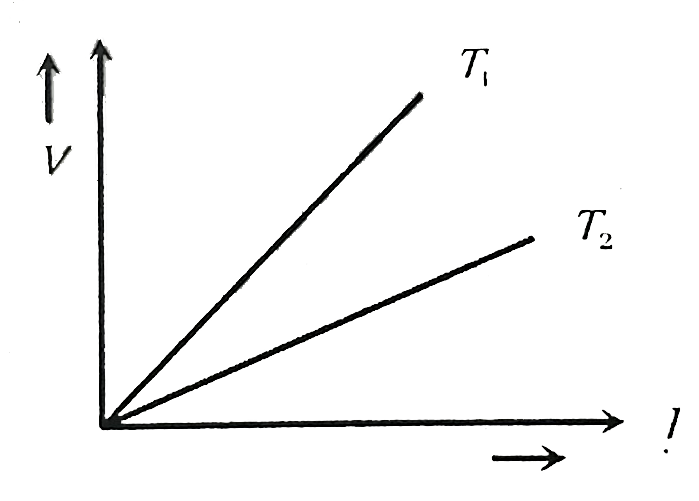 AT1>T2BT1≈T2CT1=T2DT1<T2
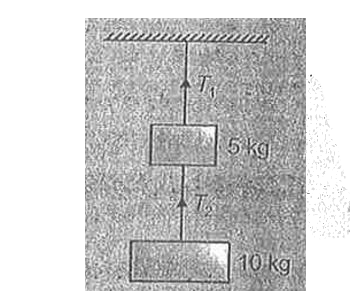
What will be the tension T1andT2 in the given figure?

View SolutionDetermine the tensions T1 and T2 in the string as shown in figure.
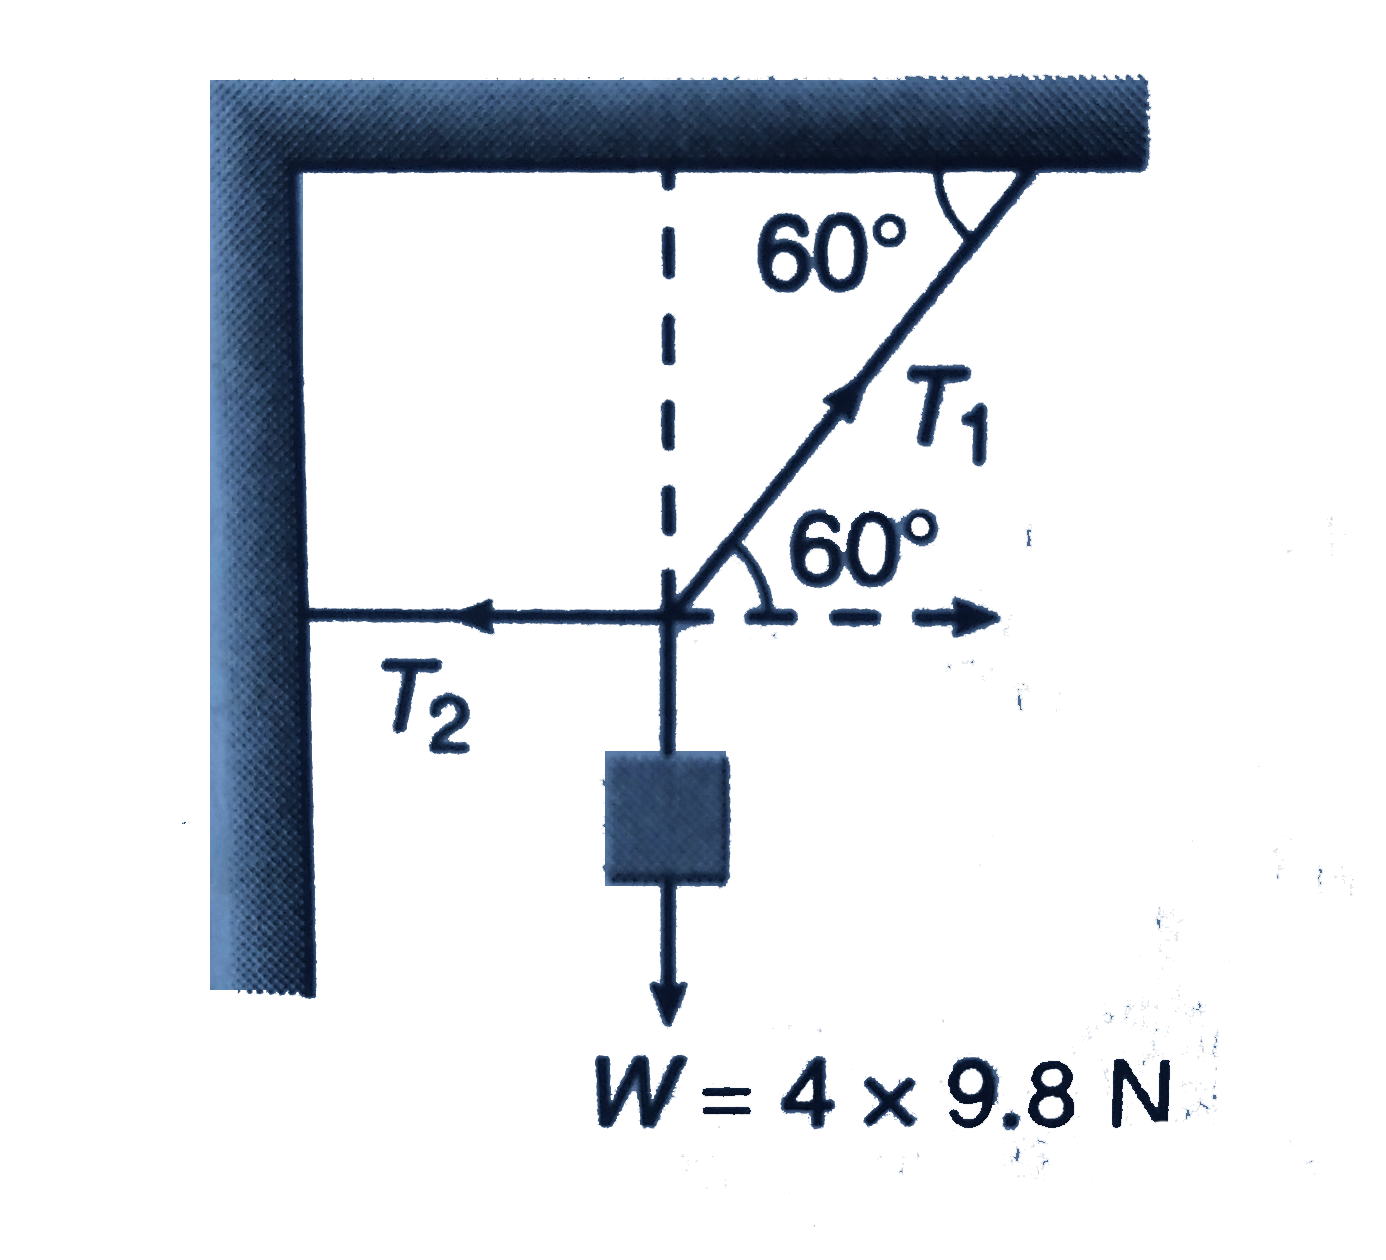
View SolutionWhat is the magnitude of energy at T2 and T3 level in the given figure ?
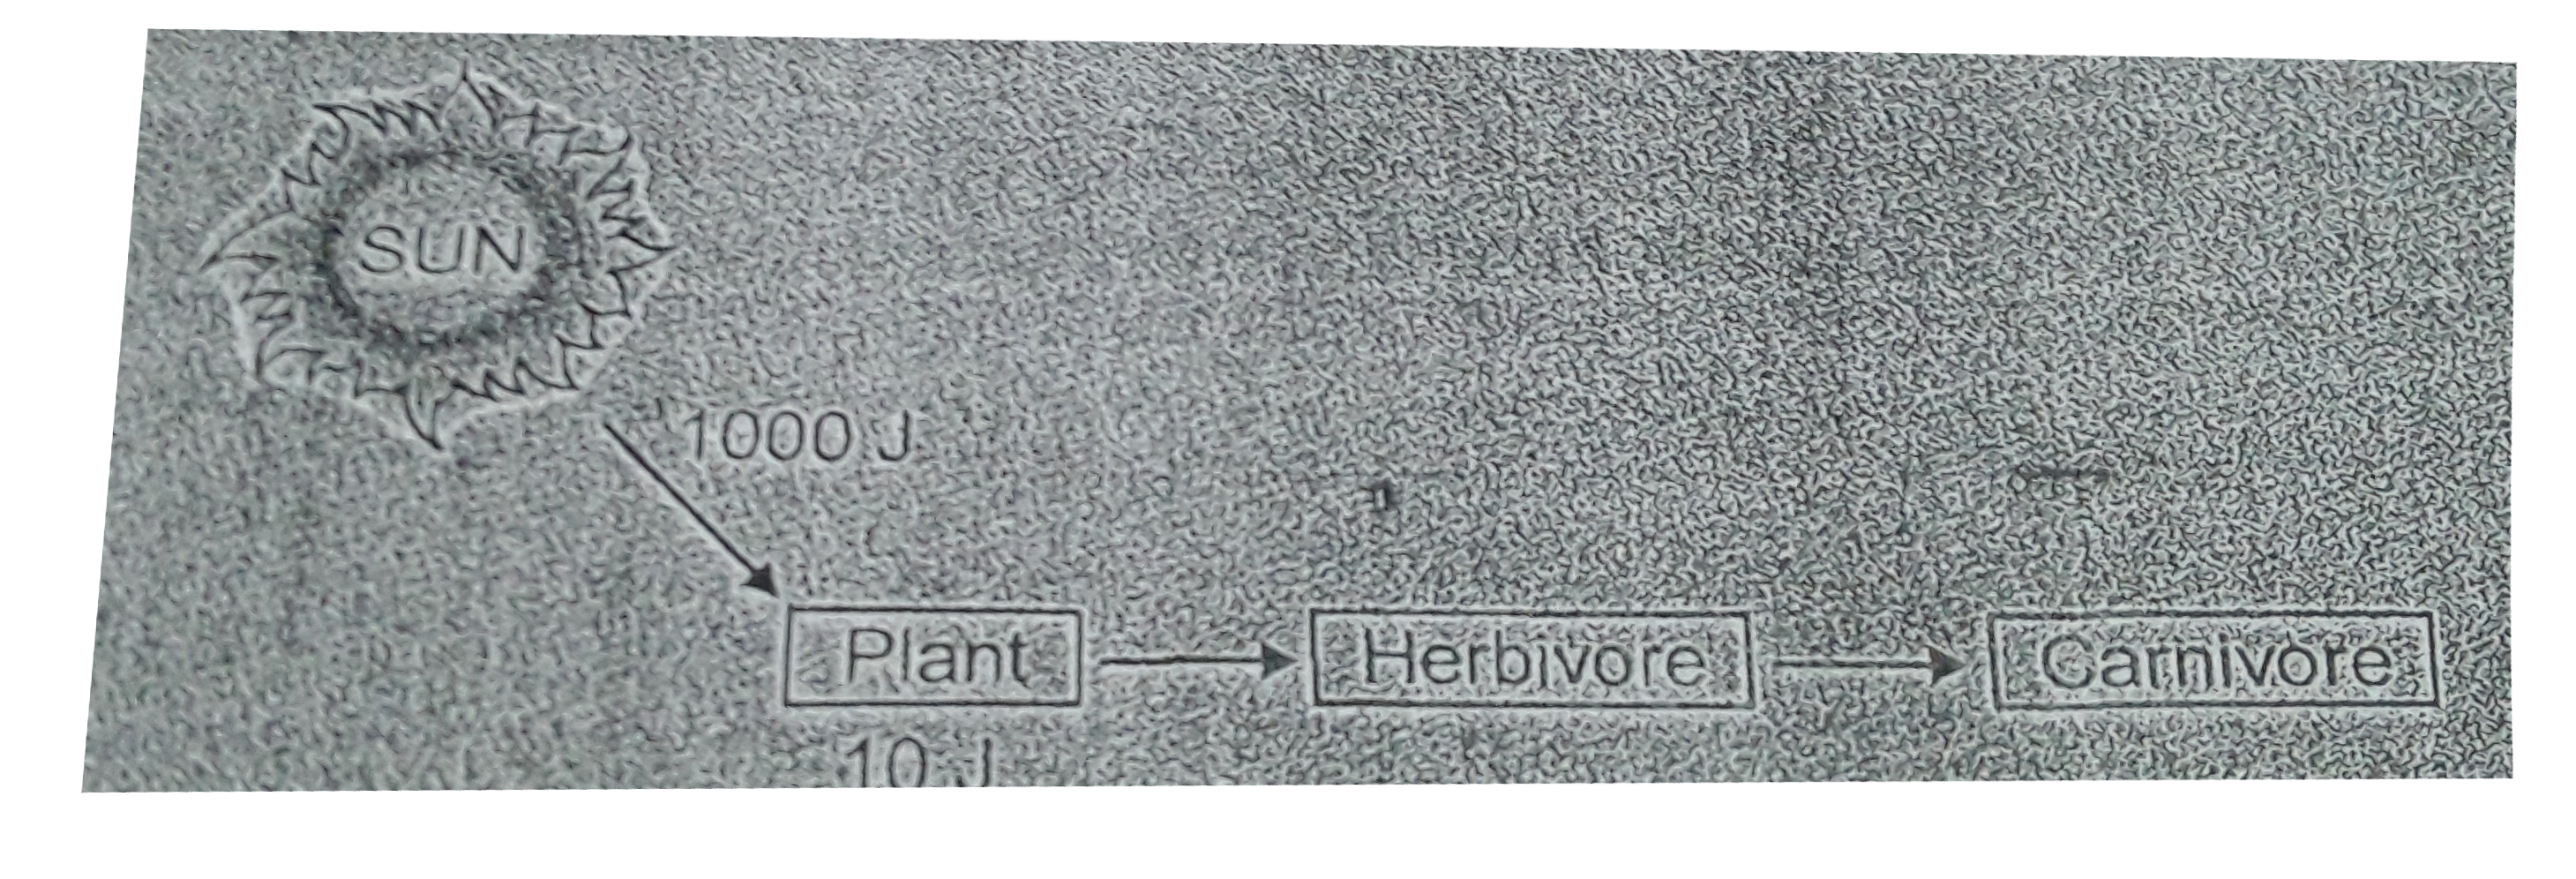
View SolutionThe current-coltage graphs for a given metallic wire at two differenct tempeature T1 and T2 are shown in the figure. Which one is higher, T1 or T2
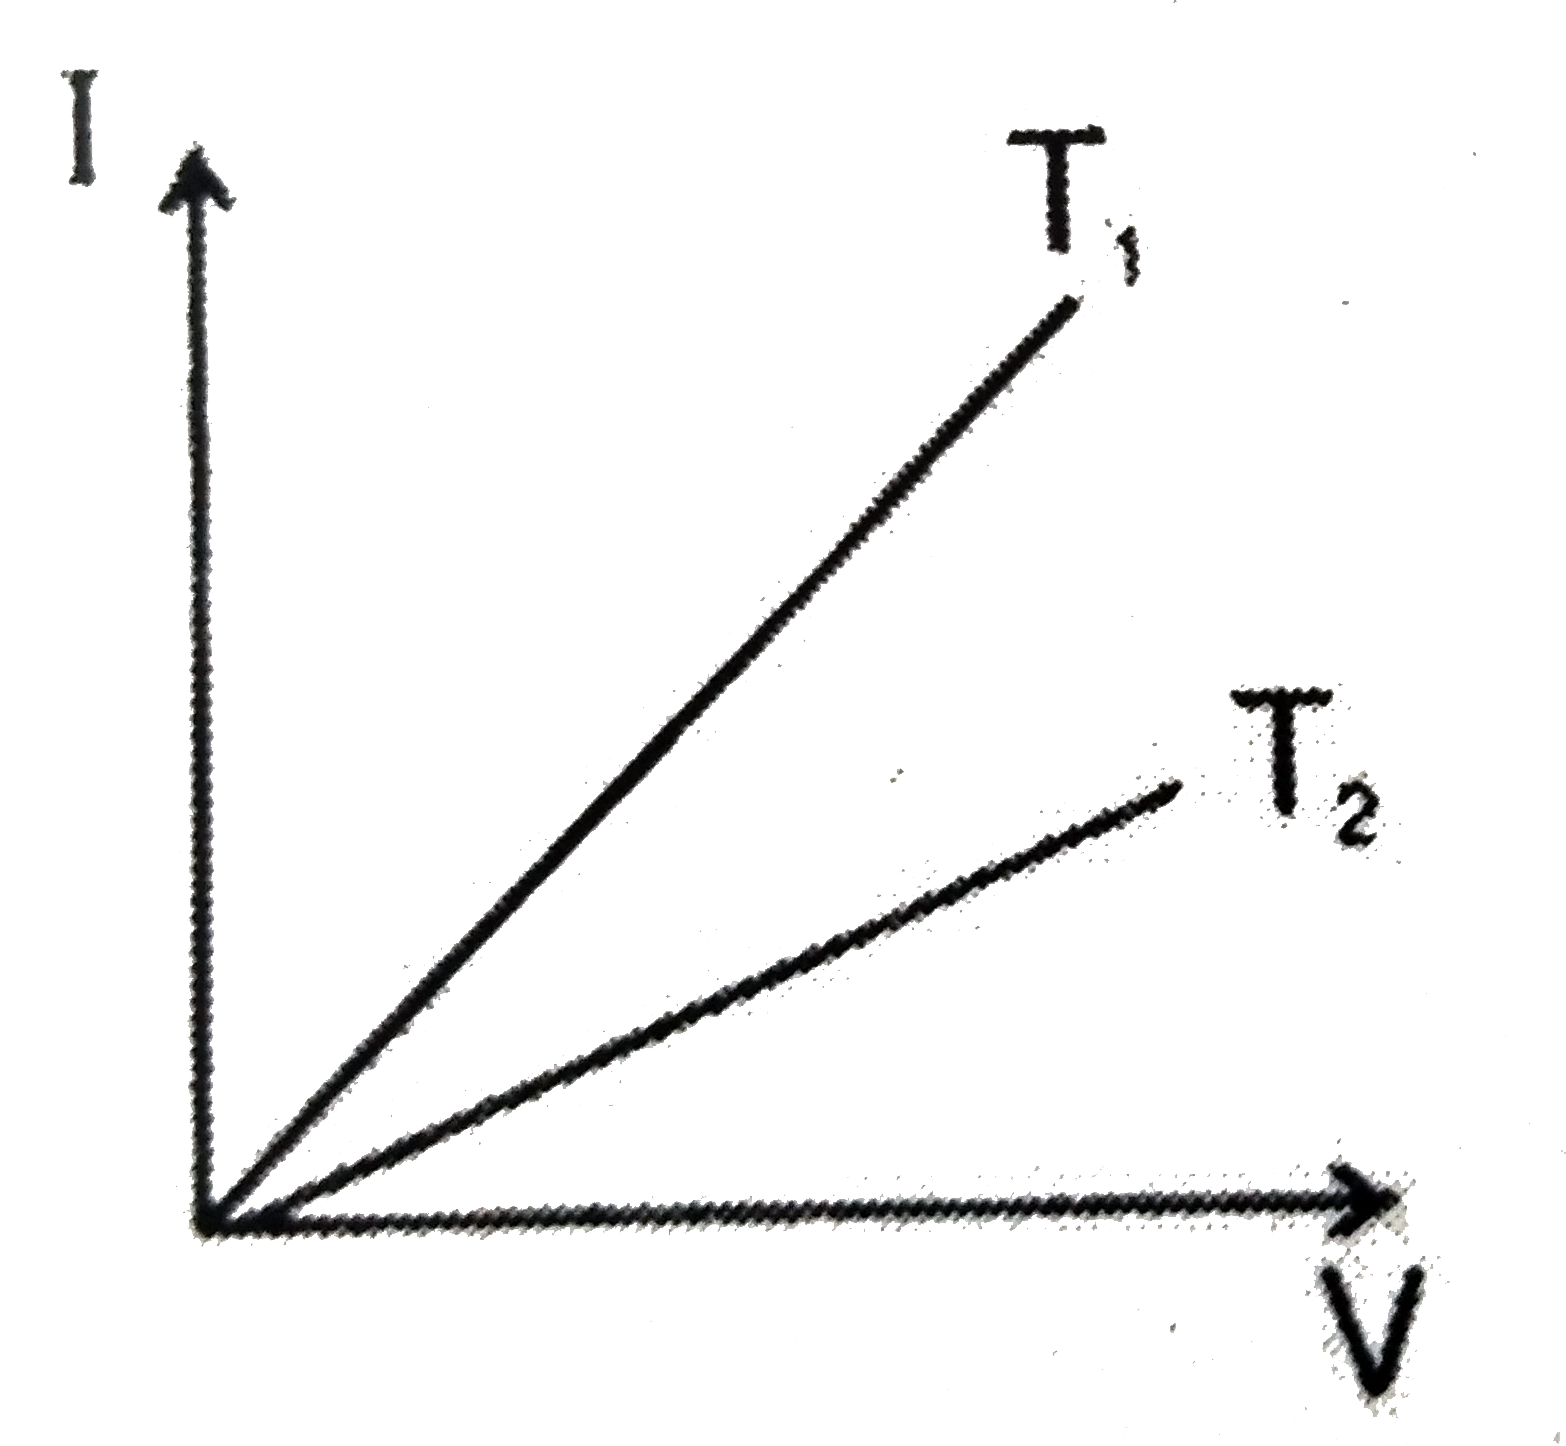
View SolutionThe voltage V and current I v graphs for a conductor at two different temperatures T1andT2 are shown in the figure. The relation between T1andT2 is

View Solution
