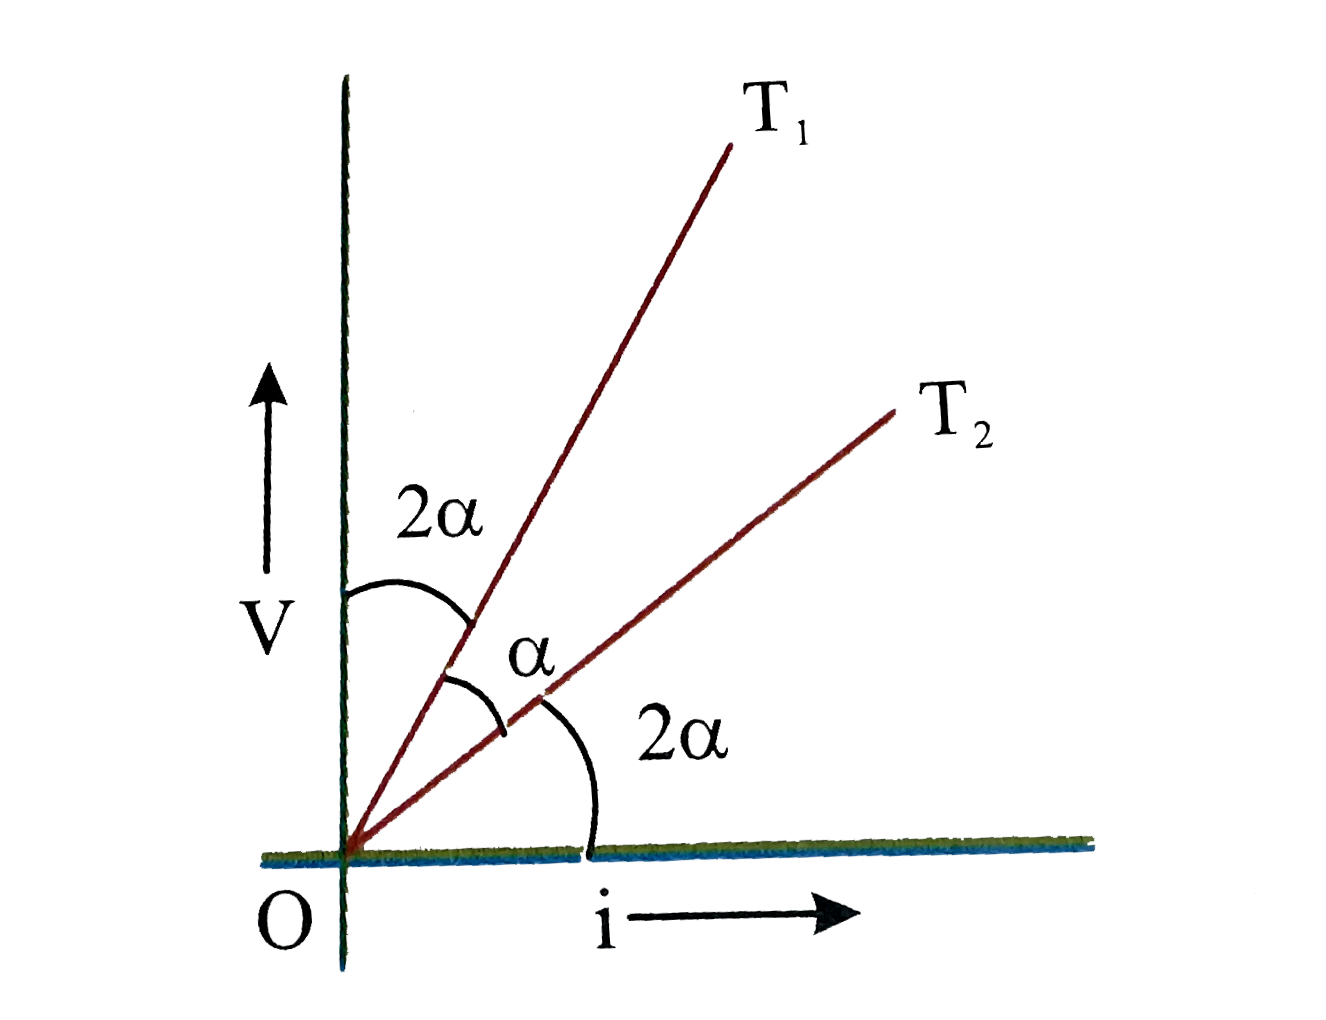
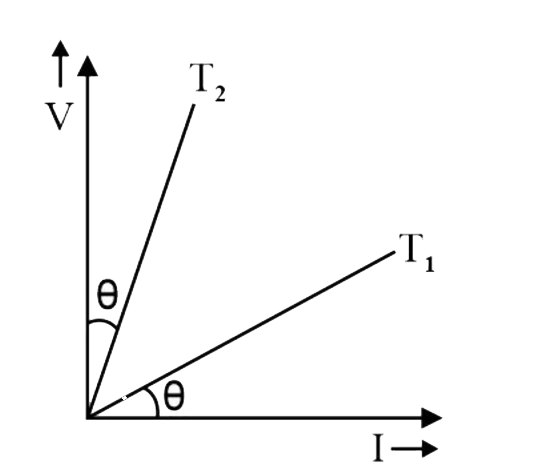
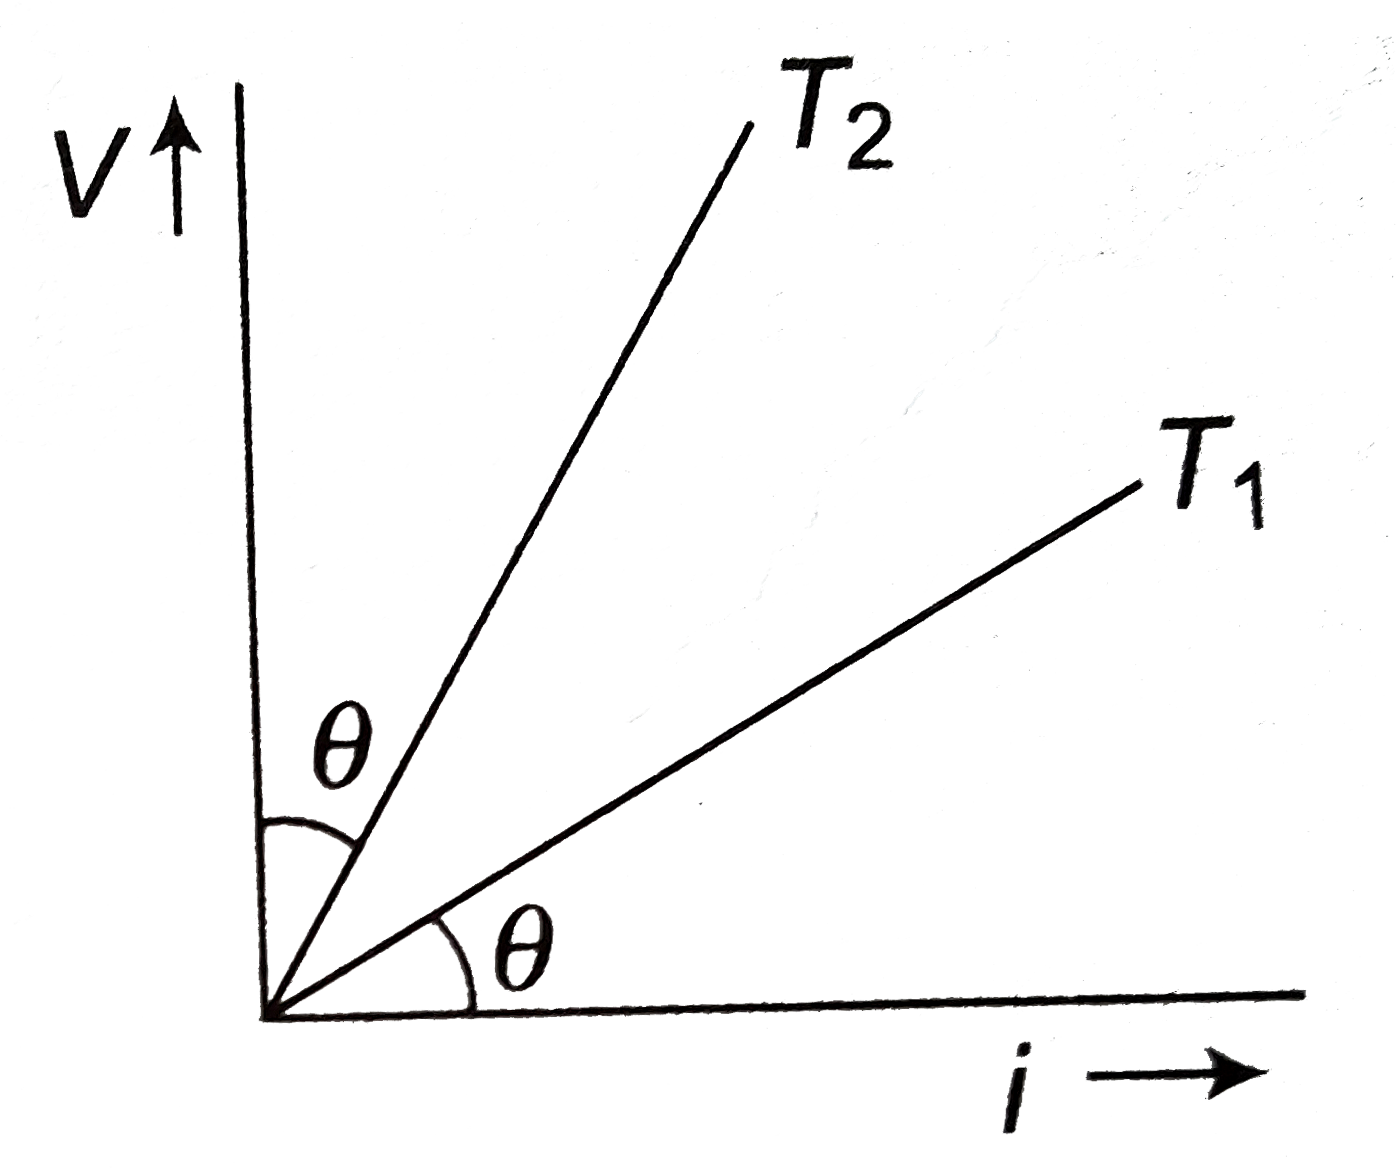
The figure shows the variation of V with i at temperatures T1 and T2. Then T1−T2 is proportional to
tan2α
tanα
sinα
cos2α
The correct Answer is:B
Step by step video, text & image solution for The figure shows the variation of V with i at temperatures T_(1) and T_(2). Then T_(1)-T_(2) is proportional to by Physics experts to help you in doubts & scoring excellent marks in Class 12 exams.
Topper's Solved these Questions
- BOOK - NARAYNACHAPTER - EXPERIMENTAL PHYSICSEXERCISE - Level-v(Single answer)23videos
EXPERIMENTAL PHYSICS
- BOOK - NARAYNACHAPTER - EXPERIMENTAL PHYSICSEXERCISE - Multiple answer6videos
EXPERIMENTAL PHYSICS
- BOOK - NARAYNACHAPTER - ELECTROSTATICS AND GAUSS LAWEXERCISE - Intergers type question11videos
ELECTROSTATICS AND GAUSS LAW
- BOOK - NARAYNACHAPTER - MAGNETISMEXERCISE - LEVEL-II (H.W)24videos
MAGNETISM
Similar Questions
Two ends of a rod of non uniform area of cross section are maintained at temperature T1and T2 (T1>T2) as shown in the figure
If l is heat current through the cross-section of conductor at distance x from its left face, then the variation of l with x is best represented by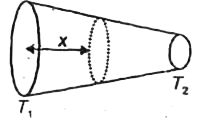 View Solution
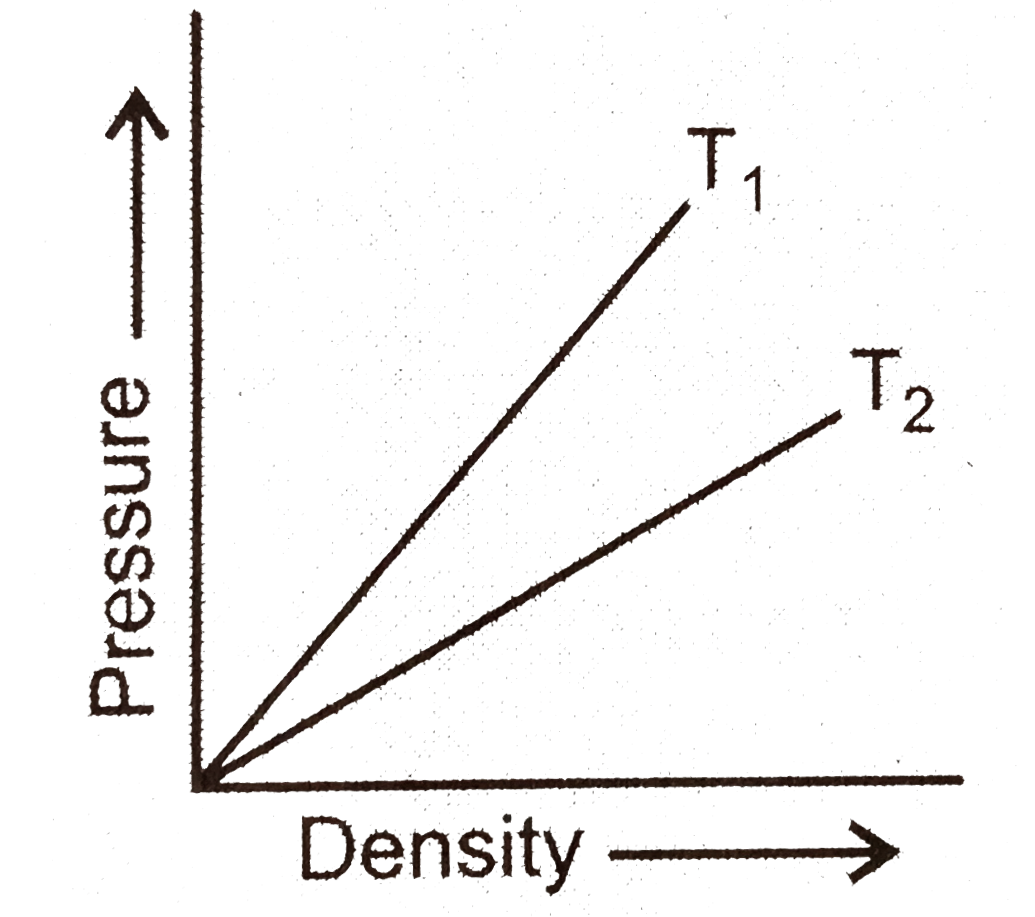
Figure shows graphs of pressure versus density for an ideal gas at two temperatures T1 and T2 Then
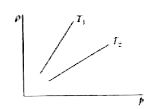 View Solution
Knowledge Check
- Question 1 - Select One
The V - i graph for a conductor at temperature T1 and T2 are as shown in the figure. (T2−T1) is proportional to
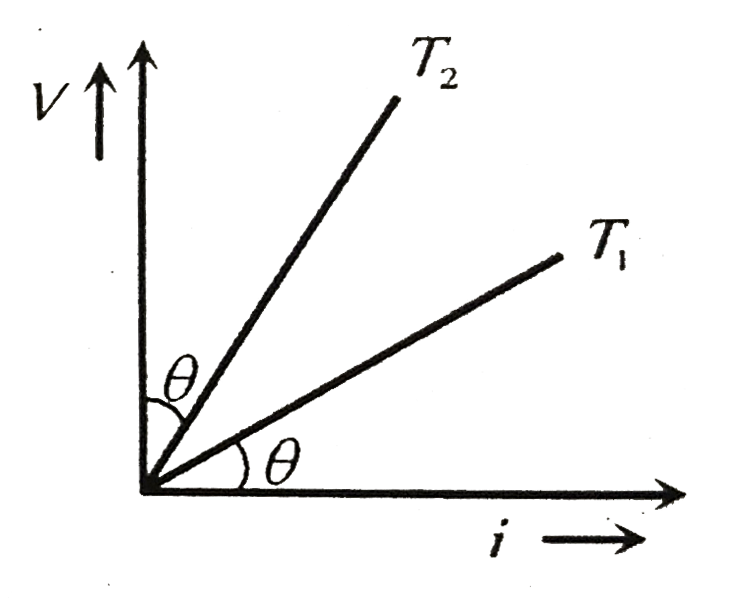 Acot2θBsinθCcot2θDtanθ
 - Question 2 - Select One
The V - I graphs for a conductor at temperature T1andT2 are shown in the figure (T2−T1) is proportional to
 AtanθBsinθCcot2θDcos2θ
 - Question 3 - Select One
The V-l graph for a conductor at temperatures T1 and T2 are as shown in the figure. The term T2−T1 is proportional to
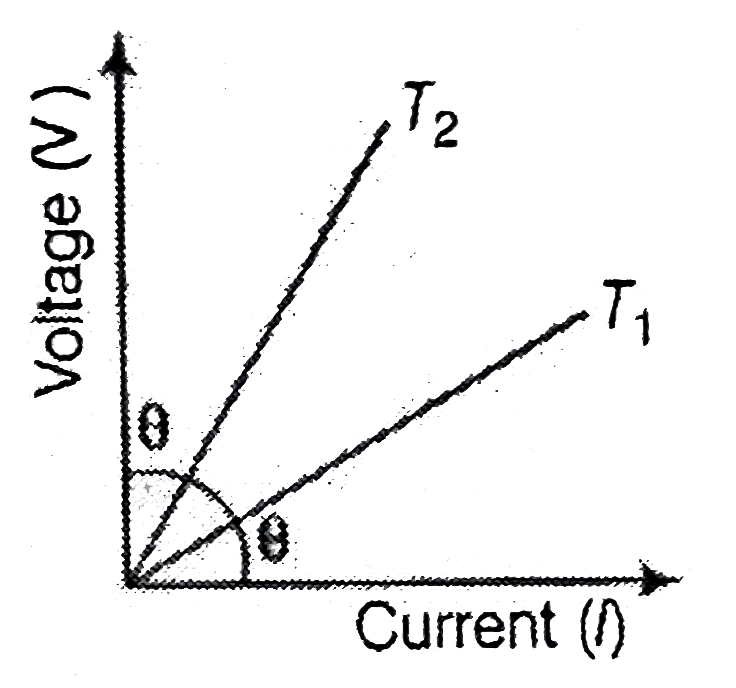 Acos2θBsin2θCcot2θDtan2θ
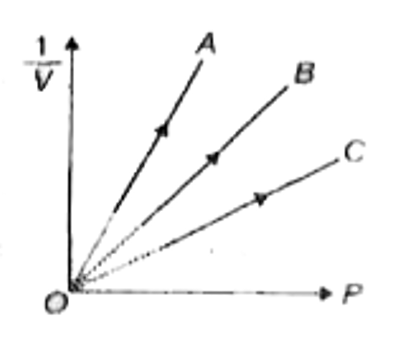
Figure shows the isotherms of a fixed mass of an ideal gas at three temperatures TA,TB and TC , then
 View Solution
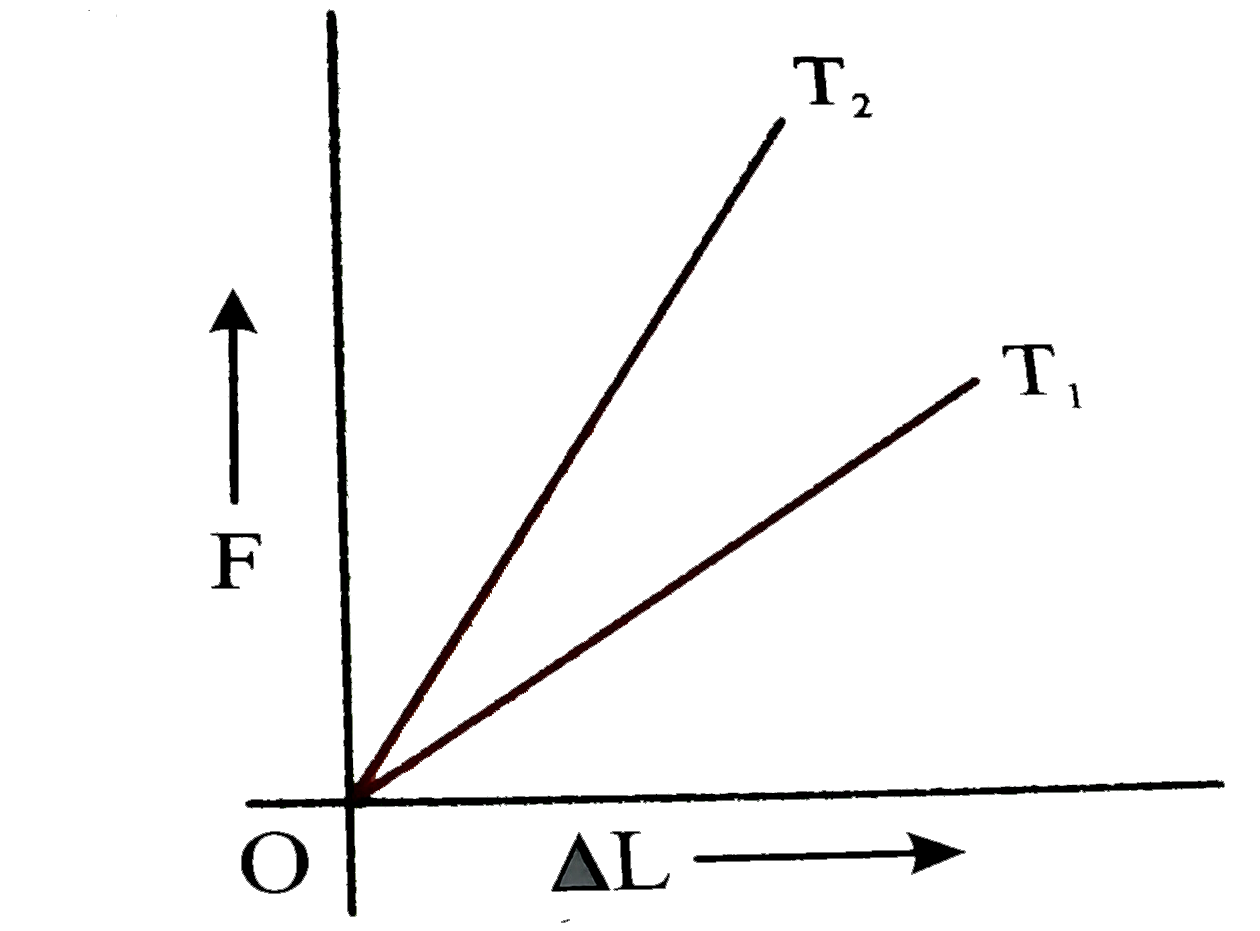
The graph shows the change 'Δl' in the length of a thin uniform wire used by the application of force F at different temperatures T1 and T2. The variation suggests that
 View Solution
Figure shows graphs of pressure vs density for an ideal gas at two temperatures Tt and T2
View SolutionThe V−i graph for a conductor at temeratures T1 and T2 are as shown in the figure. (T2−T1) is alphaortional to.
 .View Solution
Figure shows graphs of pressure versus density for an ideal gas at two temperatures T1 and T2 Which is correct ?
 .View Solution

