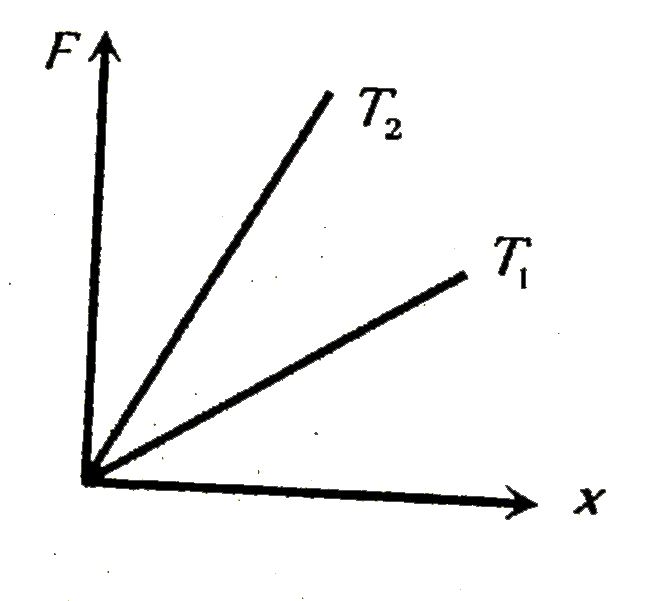
Figure shows graph between stress and strain for a uniform wire at wo different temperatures. Then
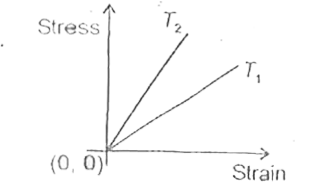
T1>T2
T2>T1
T1=T2
None of these
Step by step video & image solution for Figure shows graph between stress and strain for a uniform wire at wo different temperatures. Then by Physics experts to help you in doubts & scoring excellent marks in Class 12 exams.
Updated on:21/07/2023Topper's Solved these Questions
- MECHANICAL PROPERTIES OF SOLIDSBOOK - AAKASH INSTITUTECHAPTER - MECHANICAL PROPERTIES OF SOLIDSEXERCISE - Assignment(Section-B)
24 Videos
- MECHANICAL PROPERTIES OF SOLIDSBOOK - AAKASH INSTITUTECHAPTER - MECHANICAL PROPERTIES OF SOLIDSEXERCISE - Assignment(Section-C)
28 Videos
- MECHANICAL PROPERTIES OF SOLIDSBOOK - AAKASH INSTITUTECHAPTER - MECHANICAL PROPERTIES OF SOLIDSEXERCISE - EXERCISE
19 Videos
- MECHANICAL PROPERTIES OF FLUIDSBOOK - AAKASH INSTITUTECHAPTER - MECHANICAL PROPERTIES OF FLUIDSEXERCISE - SECTION - J
9 Videos
- Mock test 03BOOK - AAKASH INSTITUTECHAPTER - Mock test 03EXERCISE - EXAMPLE
37 Videos
Similar Questions
Knowledge Check
The graph between stress and strain represents the
AYoung's law in elasticityBBulk law in elasticityCHooke's law in elasticityDlaw of modulus rigidityFigure shows the relationship between tensile stress and strain for a typical material. Below proportional point A, stress is directly proportional to strain which means Young's moudulus (Y) is a constant. In this region the material obeys Hooke's law.
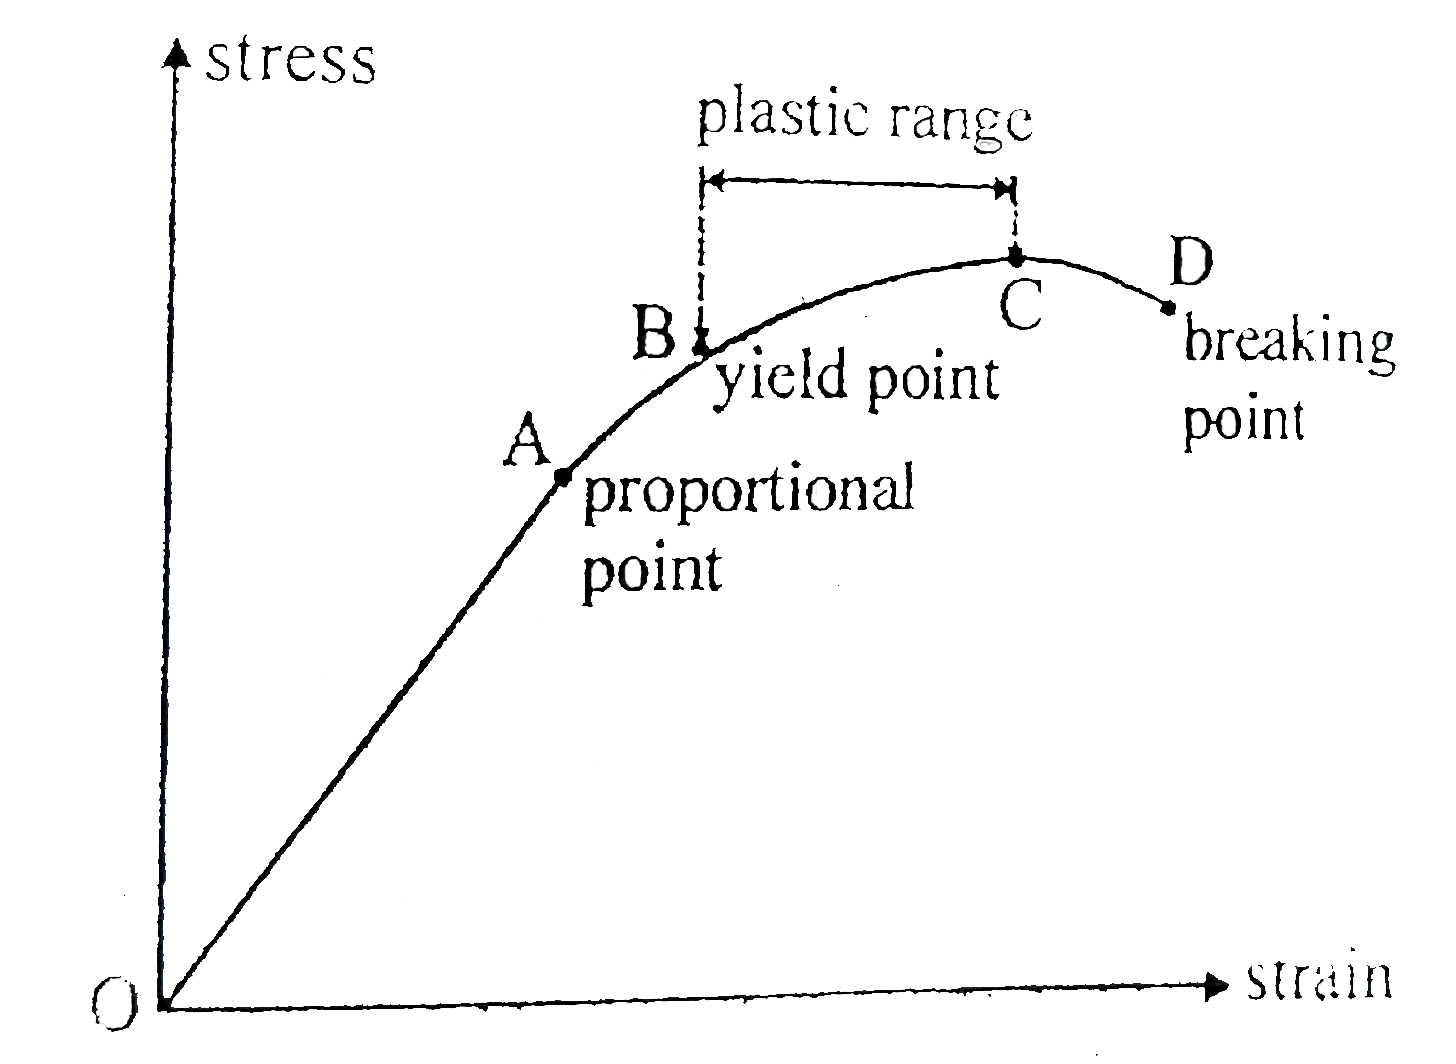
Provided the strain is below the yield point 'B' the material returns to its original shape and size when the force is removed. Beyond the yield point, the material retains a permancnt deformation after the stress is removed. For stresses beyond the yeld point, the material exhibit plastic flow, which means that it continues to elongate for little increases in the stress. Beyond C a local constriction occurs. The material fractures at D (i.e. breaking point). The graph below shows the stress-strain curve for 4 different materials.
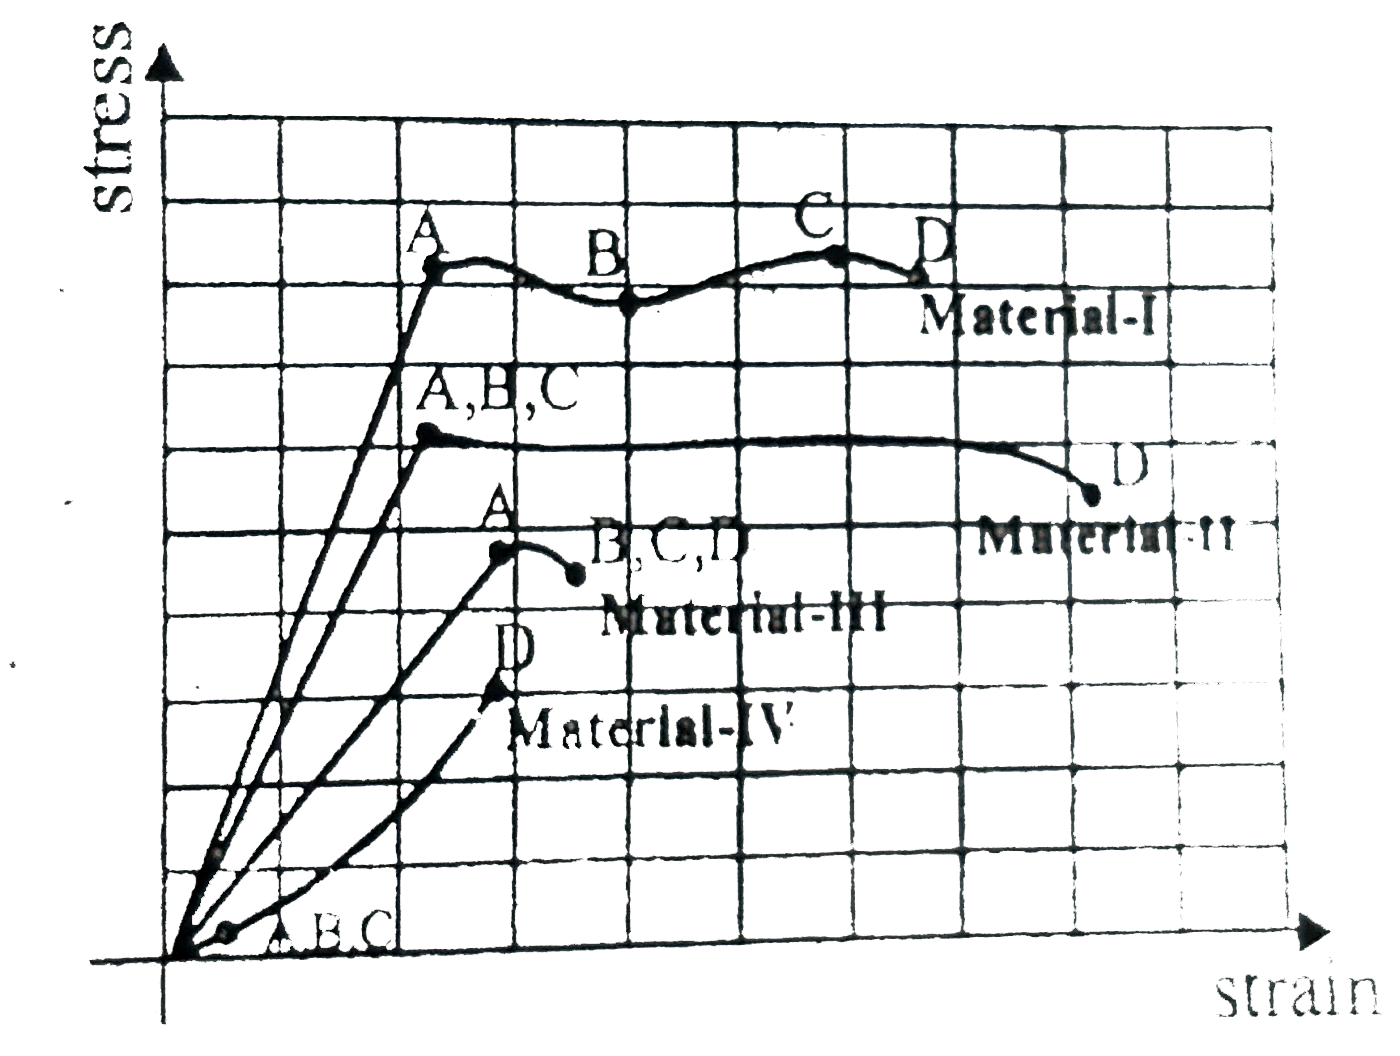
Material which is good for making wires by stretching isAMaterial-IBMaterial-IICMaterial-IIIDMaterial-IVFigure shows the relationship between tensile stress and strain for a typical material. Below proportional point A, stress is directly proportional to strain which means Young's moudulus (Y) is a constant. In this region the material obeys Hooke's law.
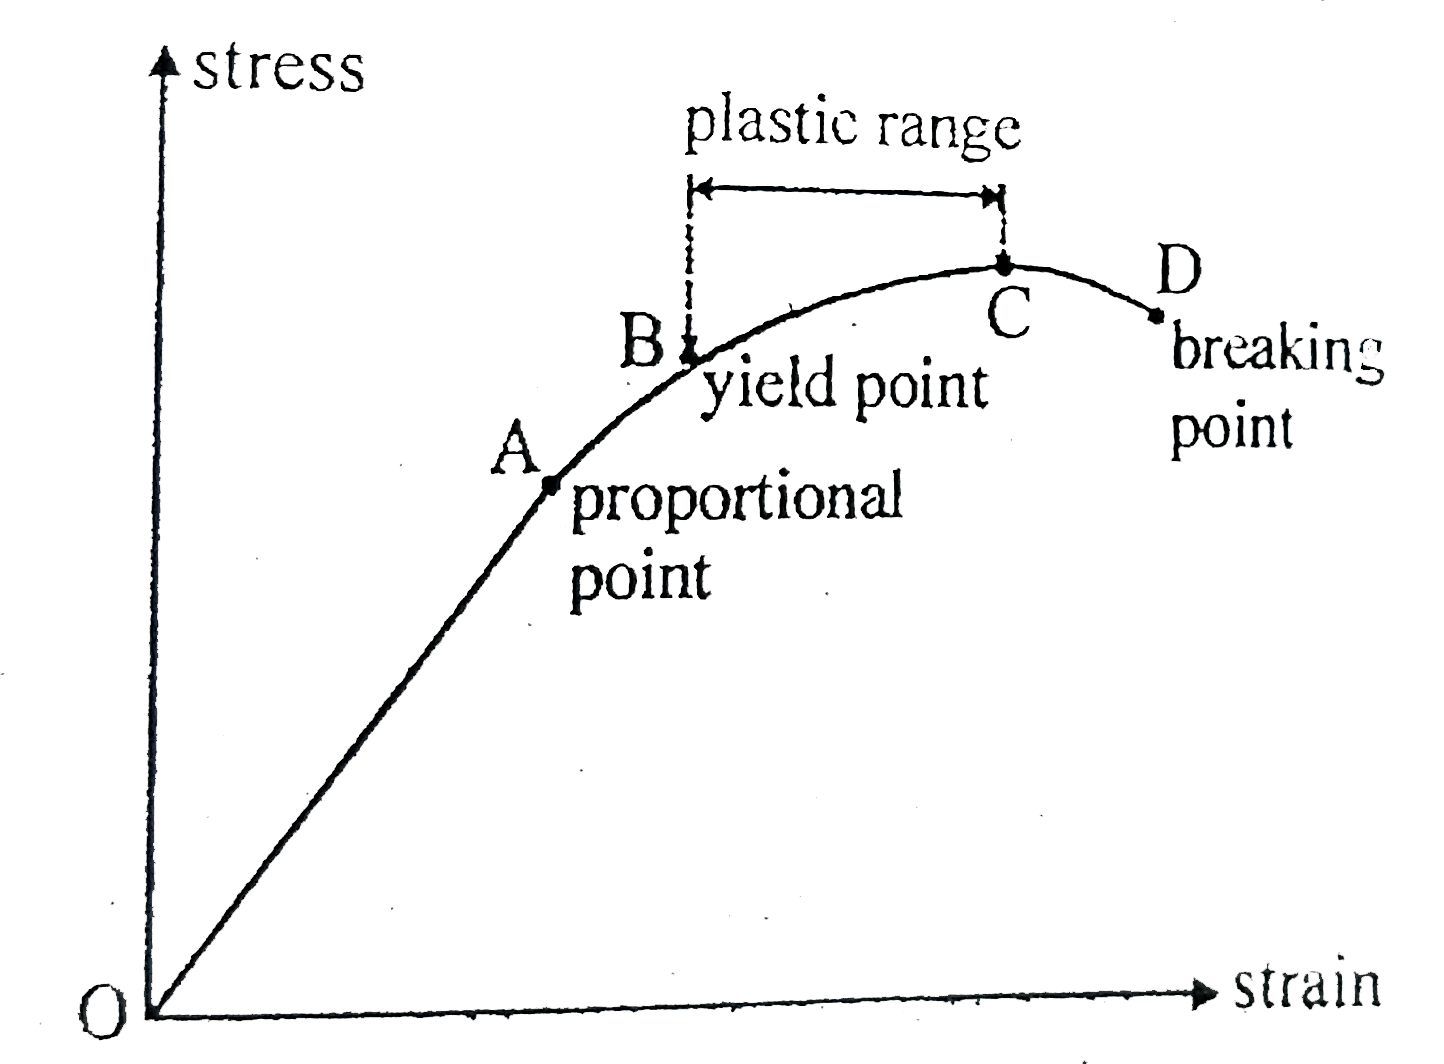
Provided the strain is below the yield point 'B' the material returns to its original shape and size when the force is removed. Beyond the yield point, the material retains a permancnt deformation after the stress is removed. For stresses beyond the yeld point, the material exhibit plastic flow, which means that it continues to elongate for little increases in the stress. Beyond C a local constriction occurs. The material fractures at D (i.e. breaking point). The graph below shows the stress-strain curve for 4 different materials.
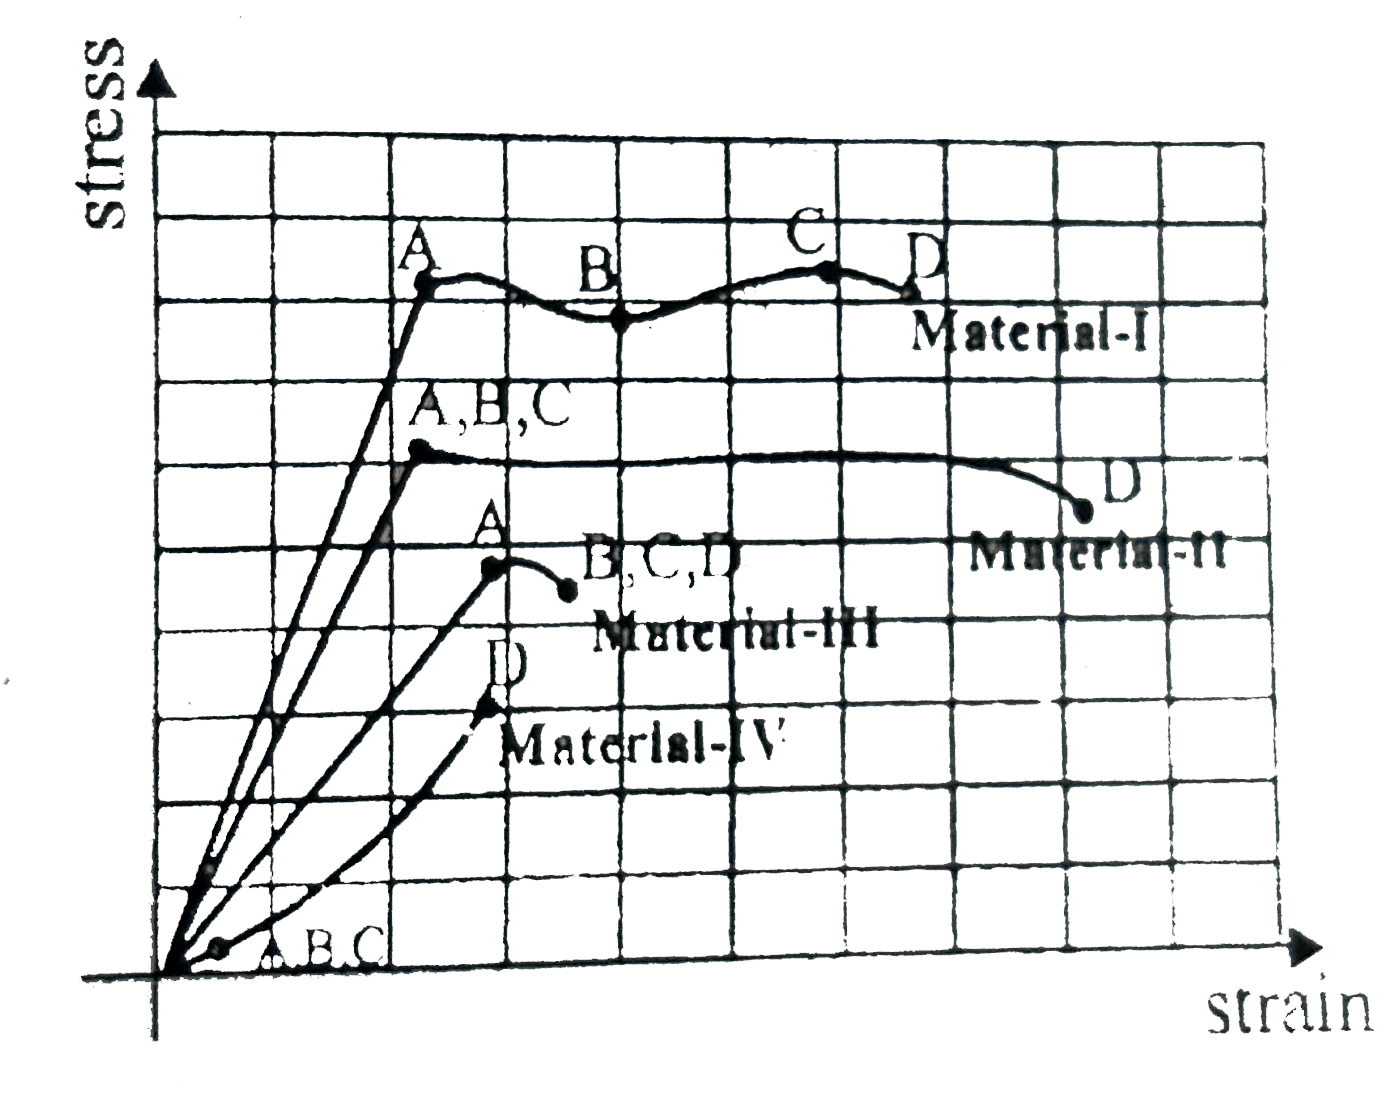
Material which is most brittle isAMaterial-IBMaterial-IICMaterial-IIIDMaterial-IV
The stress-strain graph for a metallic wire is shown at two different temperature, T1 and T2 which temperature is high T1 or T2 ?
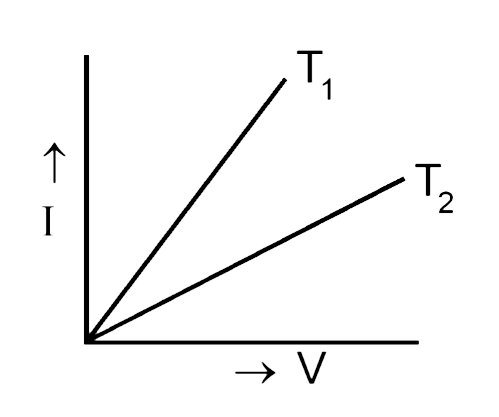
View SolutionThe current - voltage graphs for a given metallic wire at two different temperatures T1andT2 are shown in the figure.
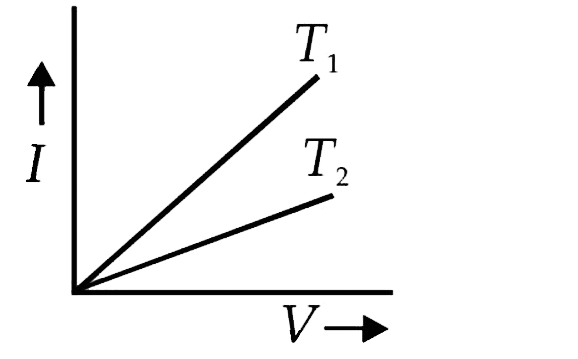
The temperature T2 is greater than T1.
View SolutionFigure shows the relationship between tensile stress and strain for a typical material. Below proportional point A, stress is directly proportional to strain which means Young's moudulus (Y) is a constant. In this region the material obeys Hooke's law.
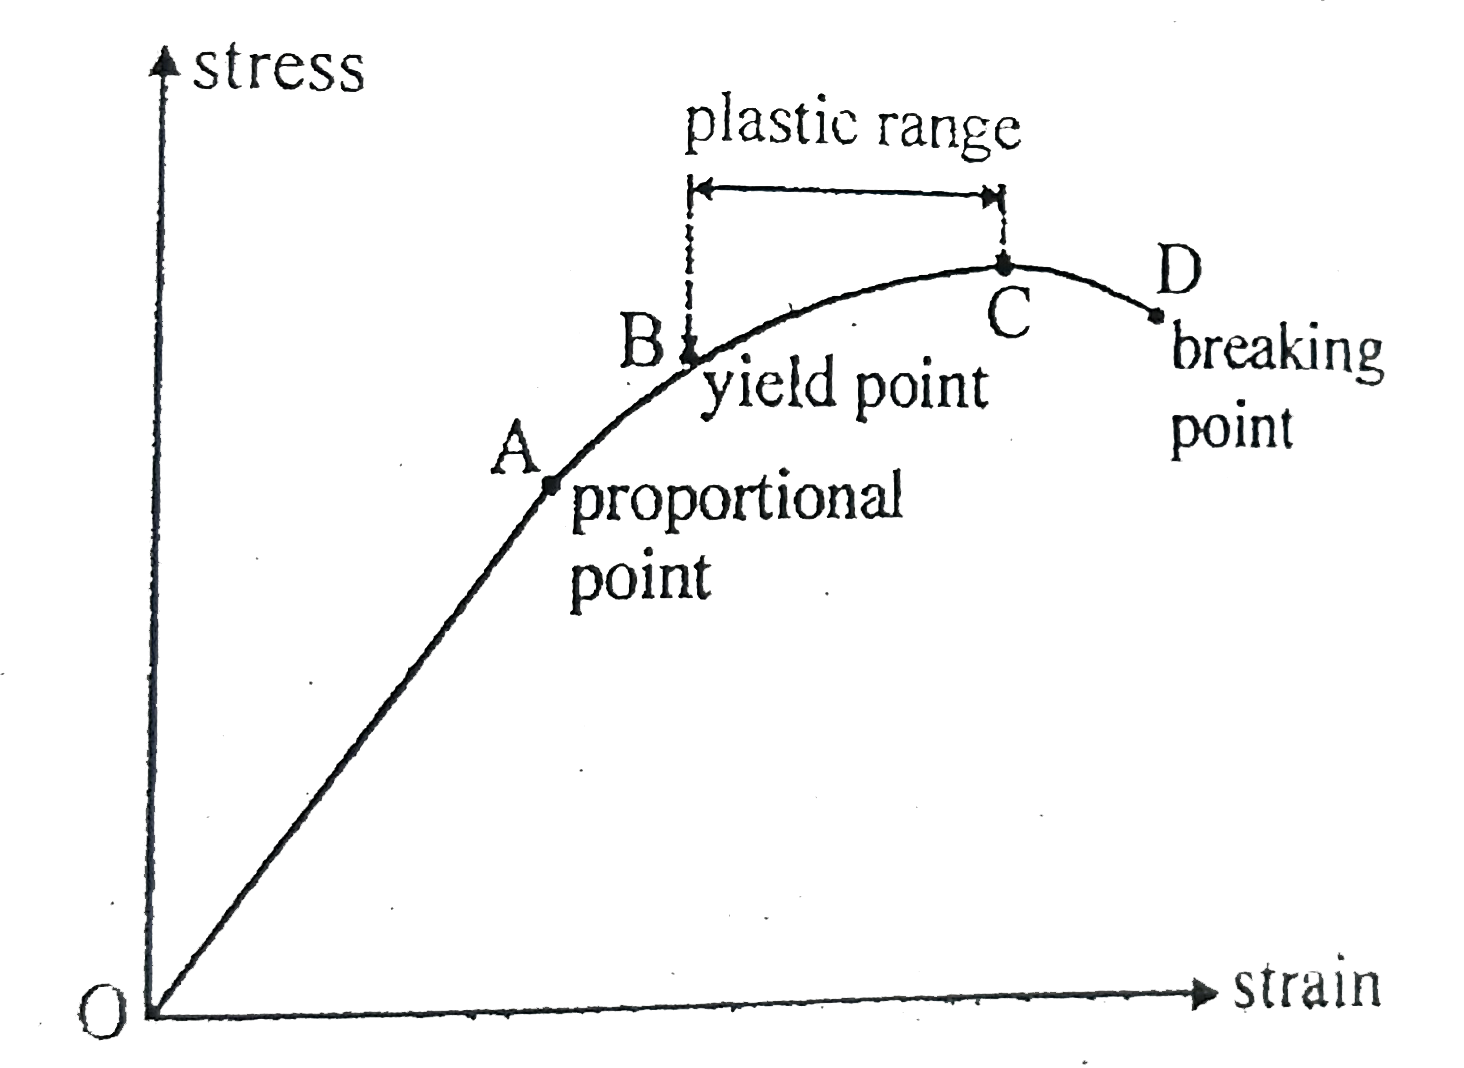
Provided the strain is below the yield point 'B' the material returns to its original shape and size when the force is removed. Beyond the yield point, the material retains a permancnt deformation after the stress is removed. For stresses beyond the yeld point, the material exhibit plastic flow, which means that it continues to elongate for little increases in the stress. Beyond C a local constriction occurs. The material fractures at D (i.e. breaking point). The graph below shows the stress-strain curve for 4 different materials.
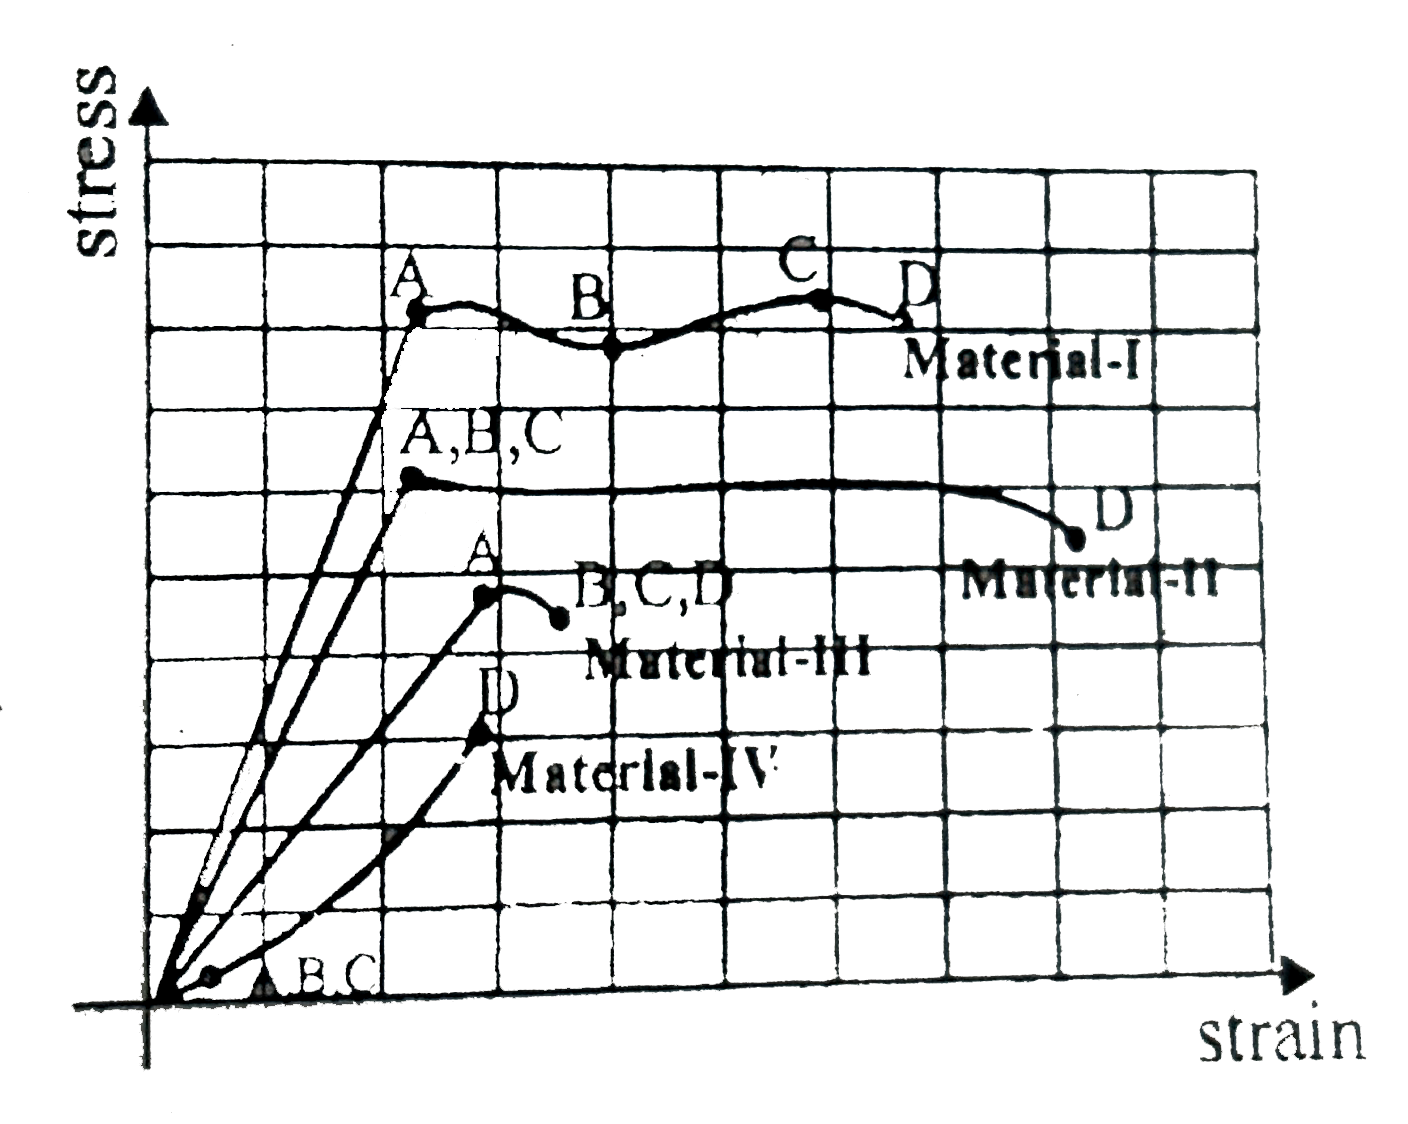
If you bough a new shoe which bites in the beginning and later on fits perfectly, then the material used to making the shoe is
View SolutionThe current (I) and voltage (V) graphs for a given metallic wire at two different temperature (T1) and (T2) are shown in fig. It is concluded that
View SolutionThe diagram shows the change x in the length of the uniform wire caused by the application of stres F at two different temperatures T and T. The variations shown suggest that
View Solution

