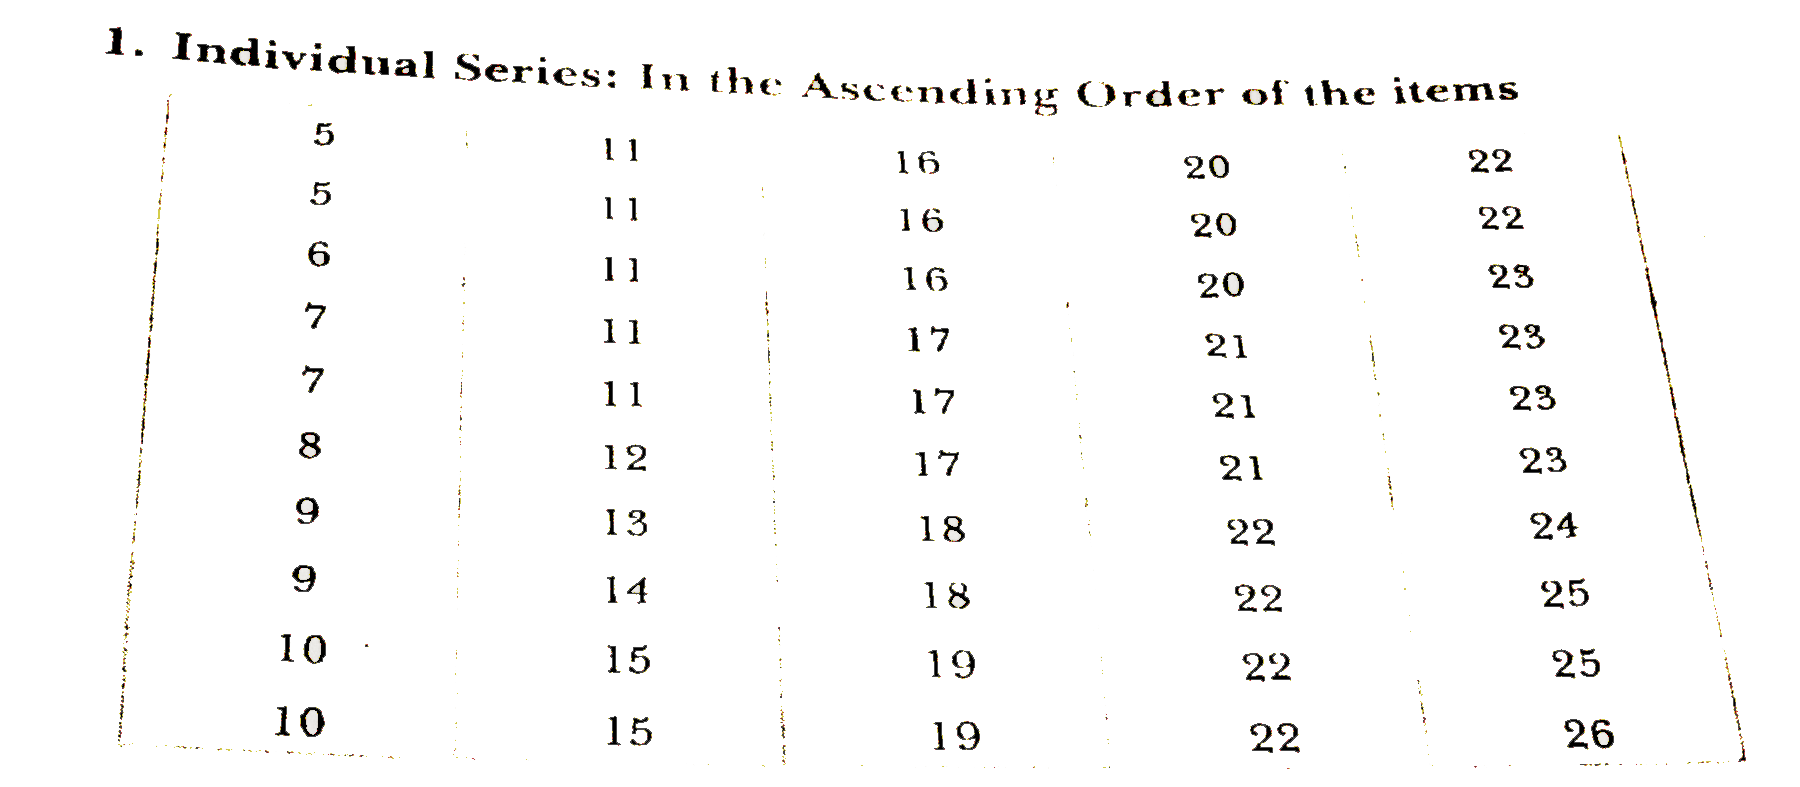
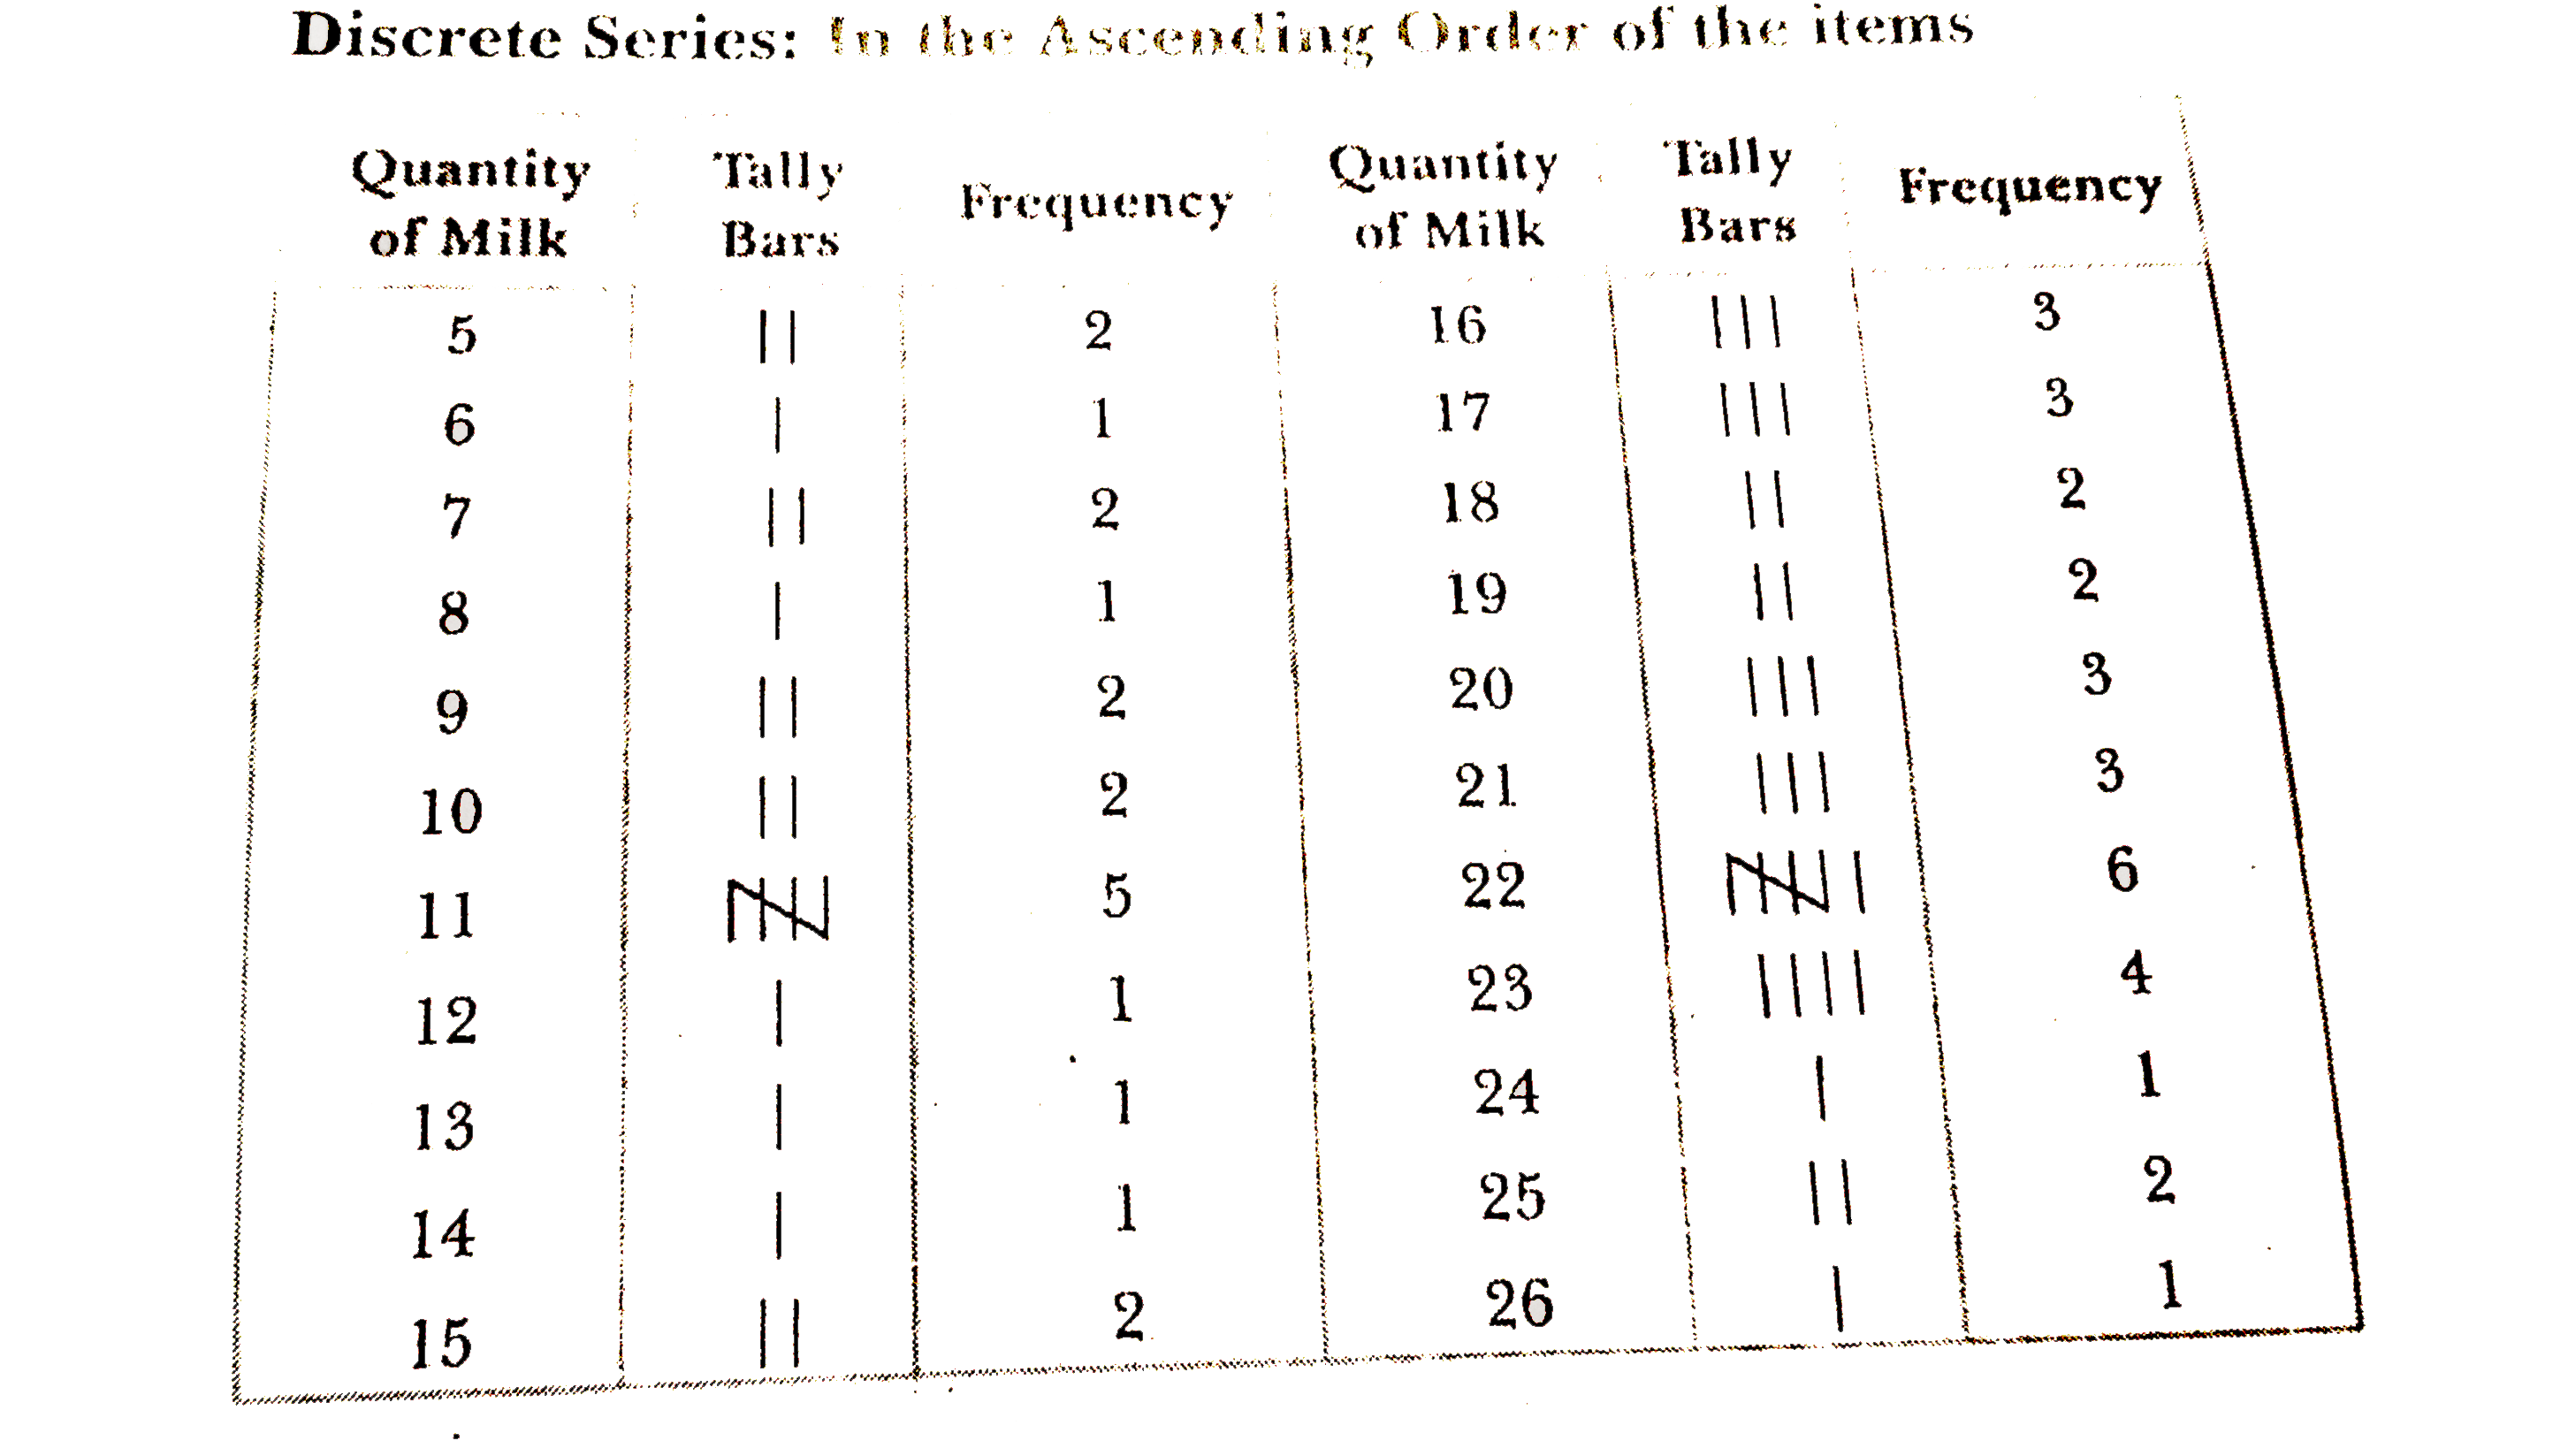
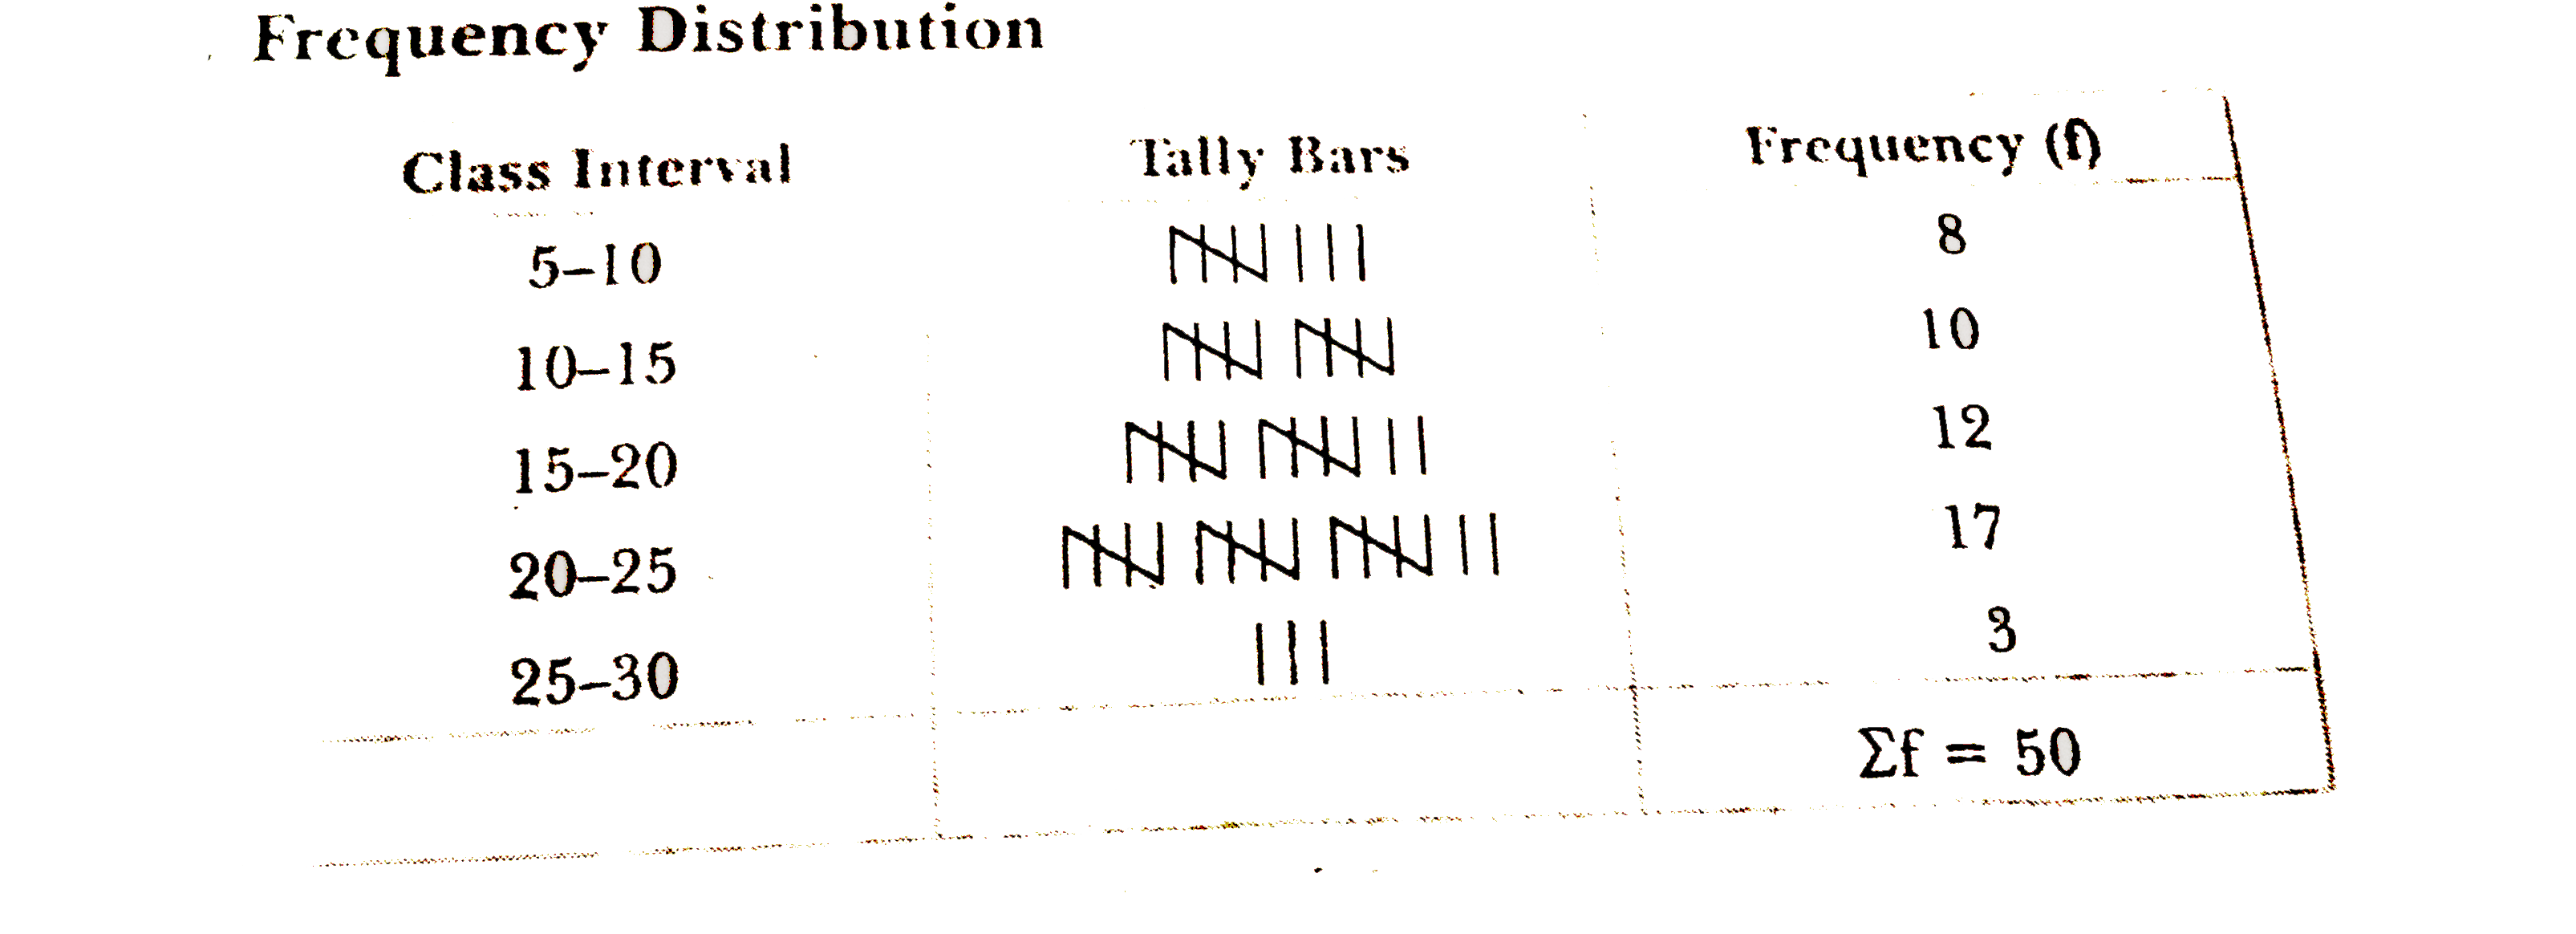
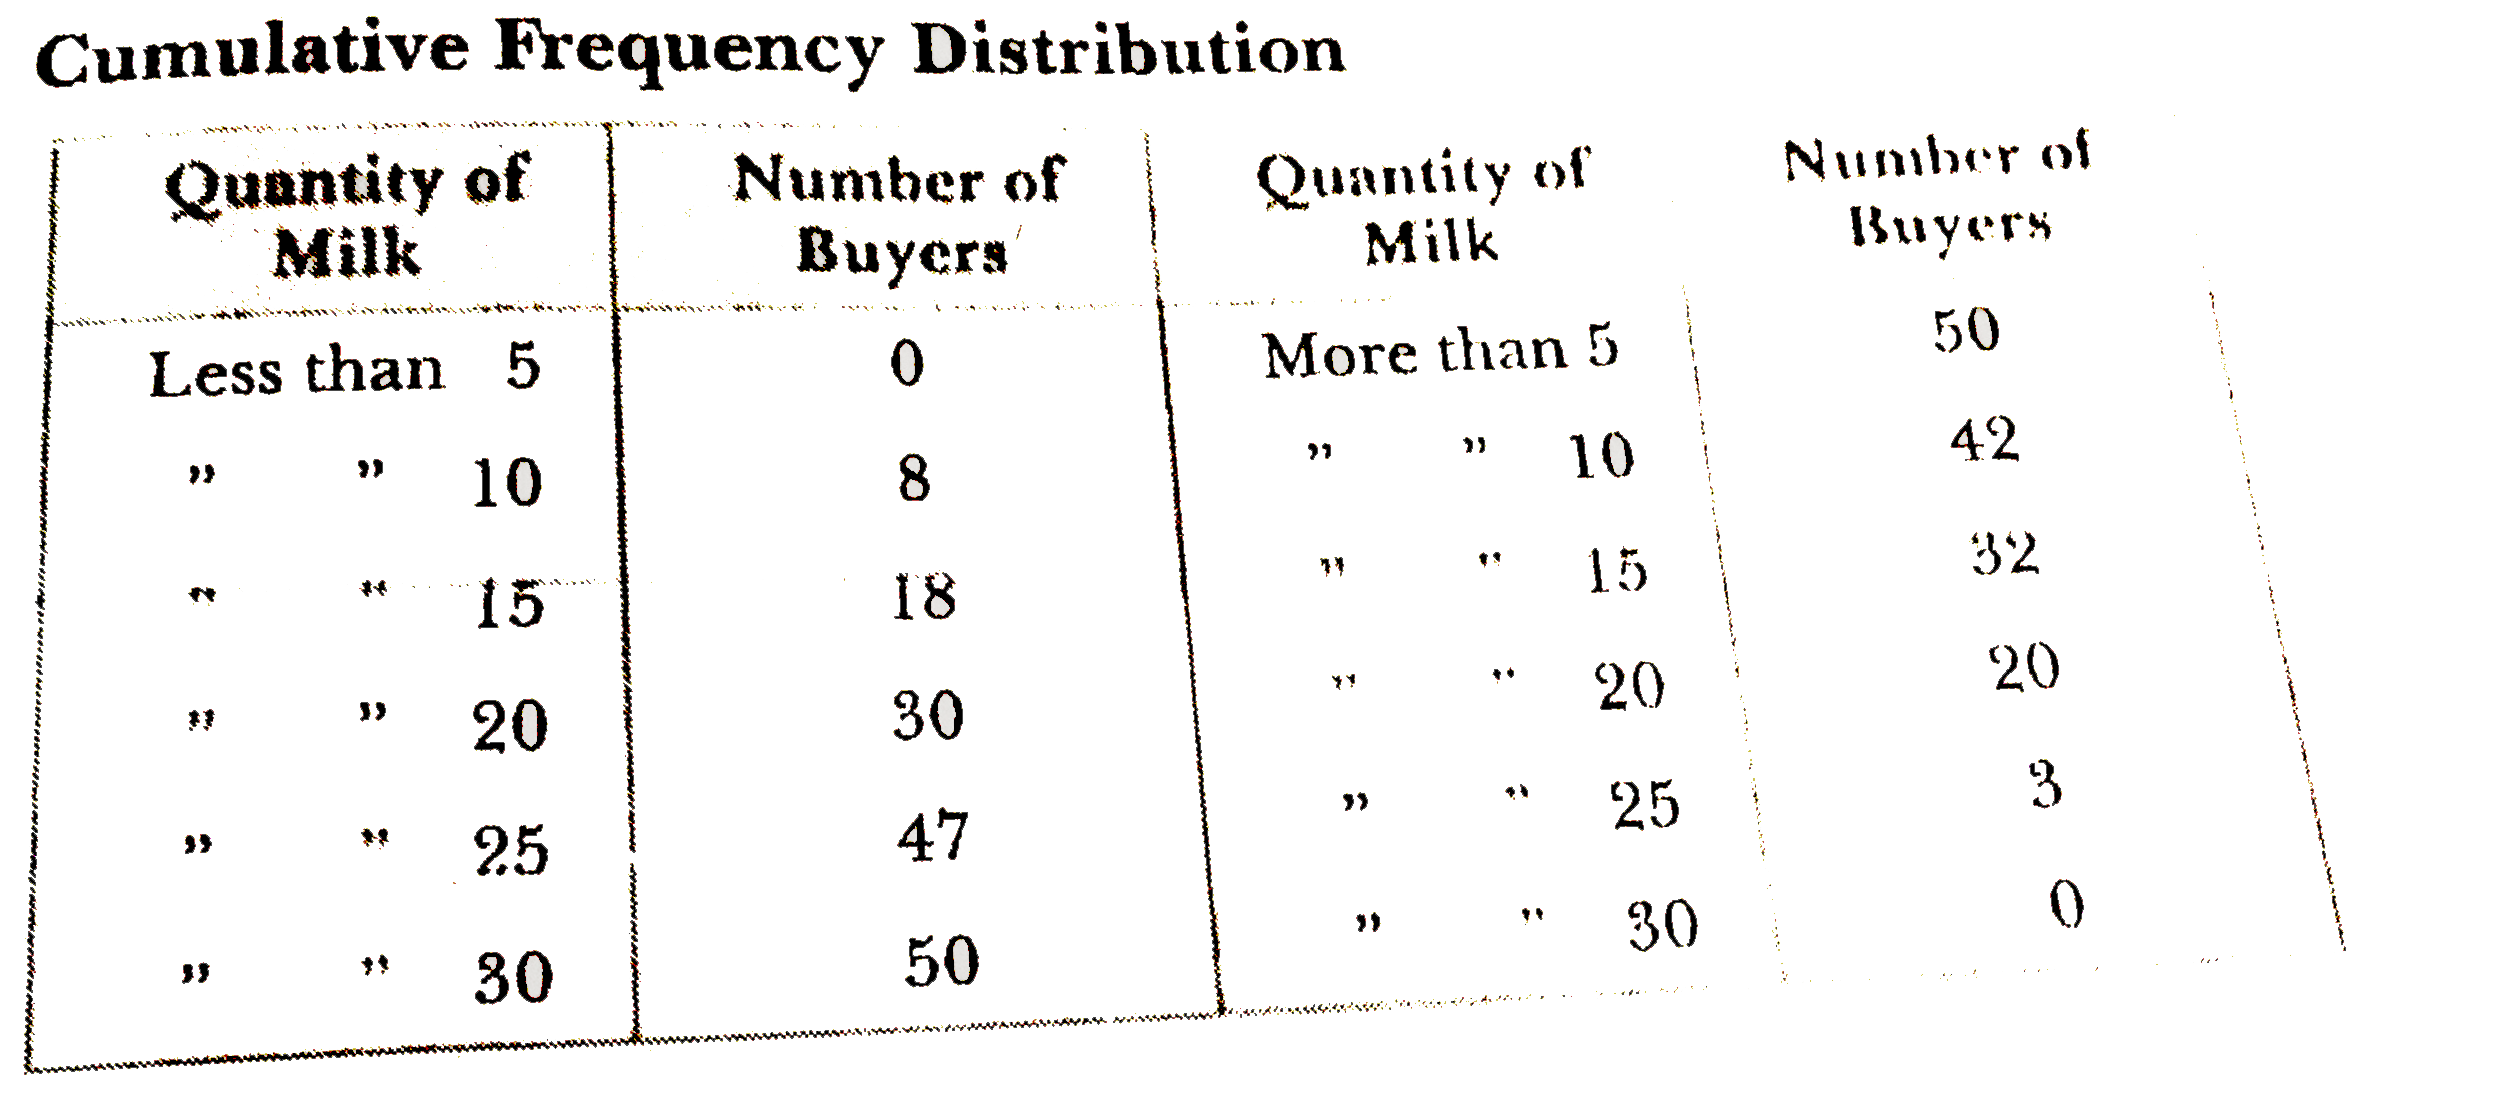
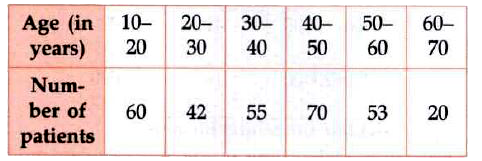
In a survey, it was found that 50 families bought milk in the following quantities in a particular month. Classify the following data in an individual, discrete, continuous and cumulative frequency series.
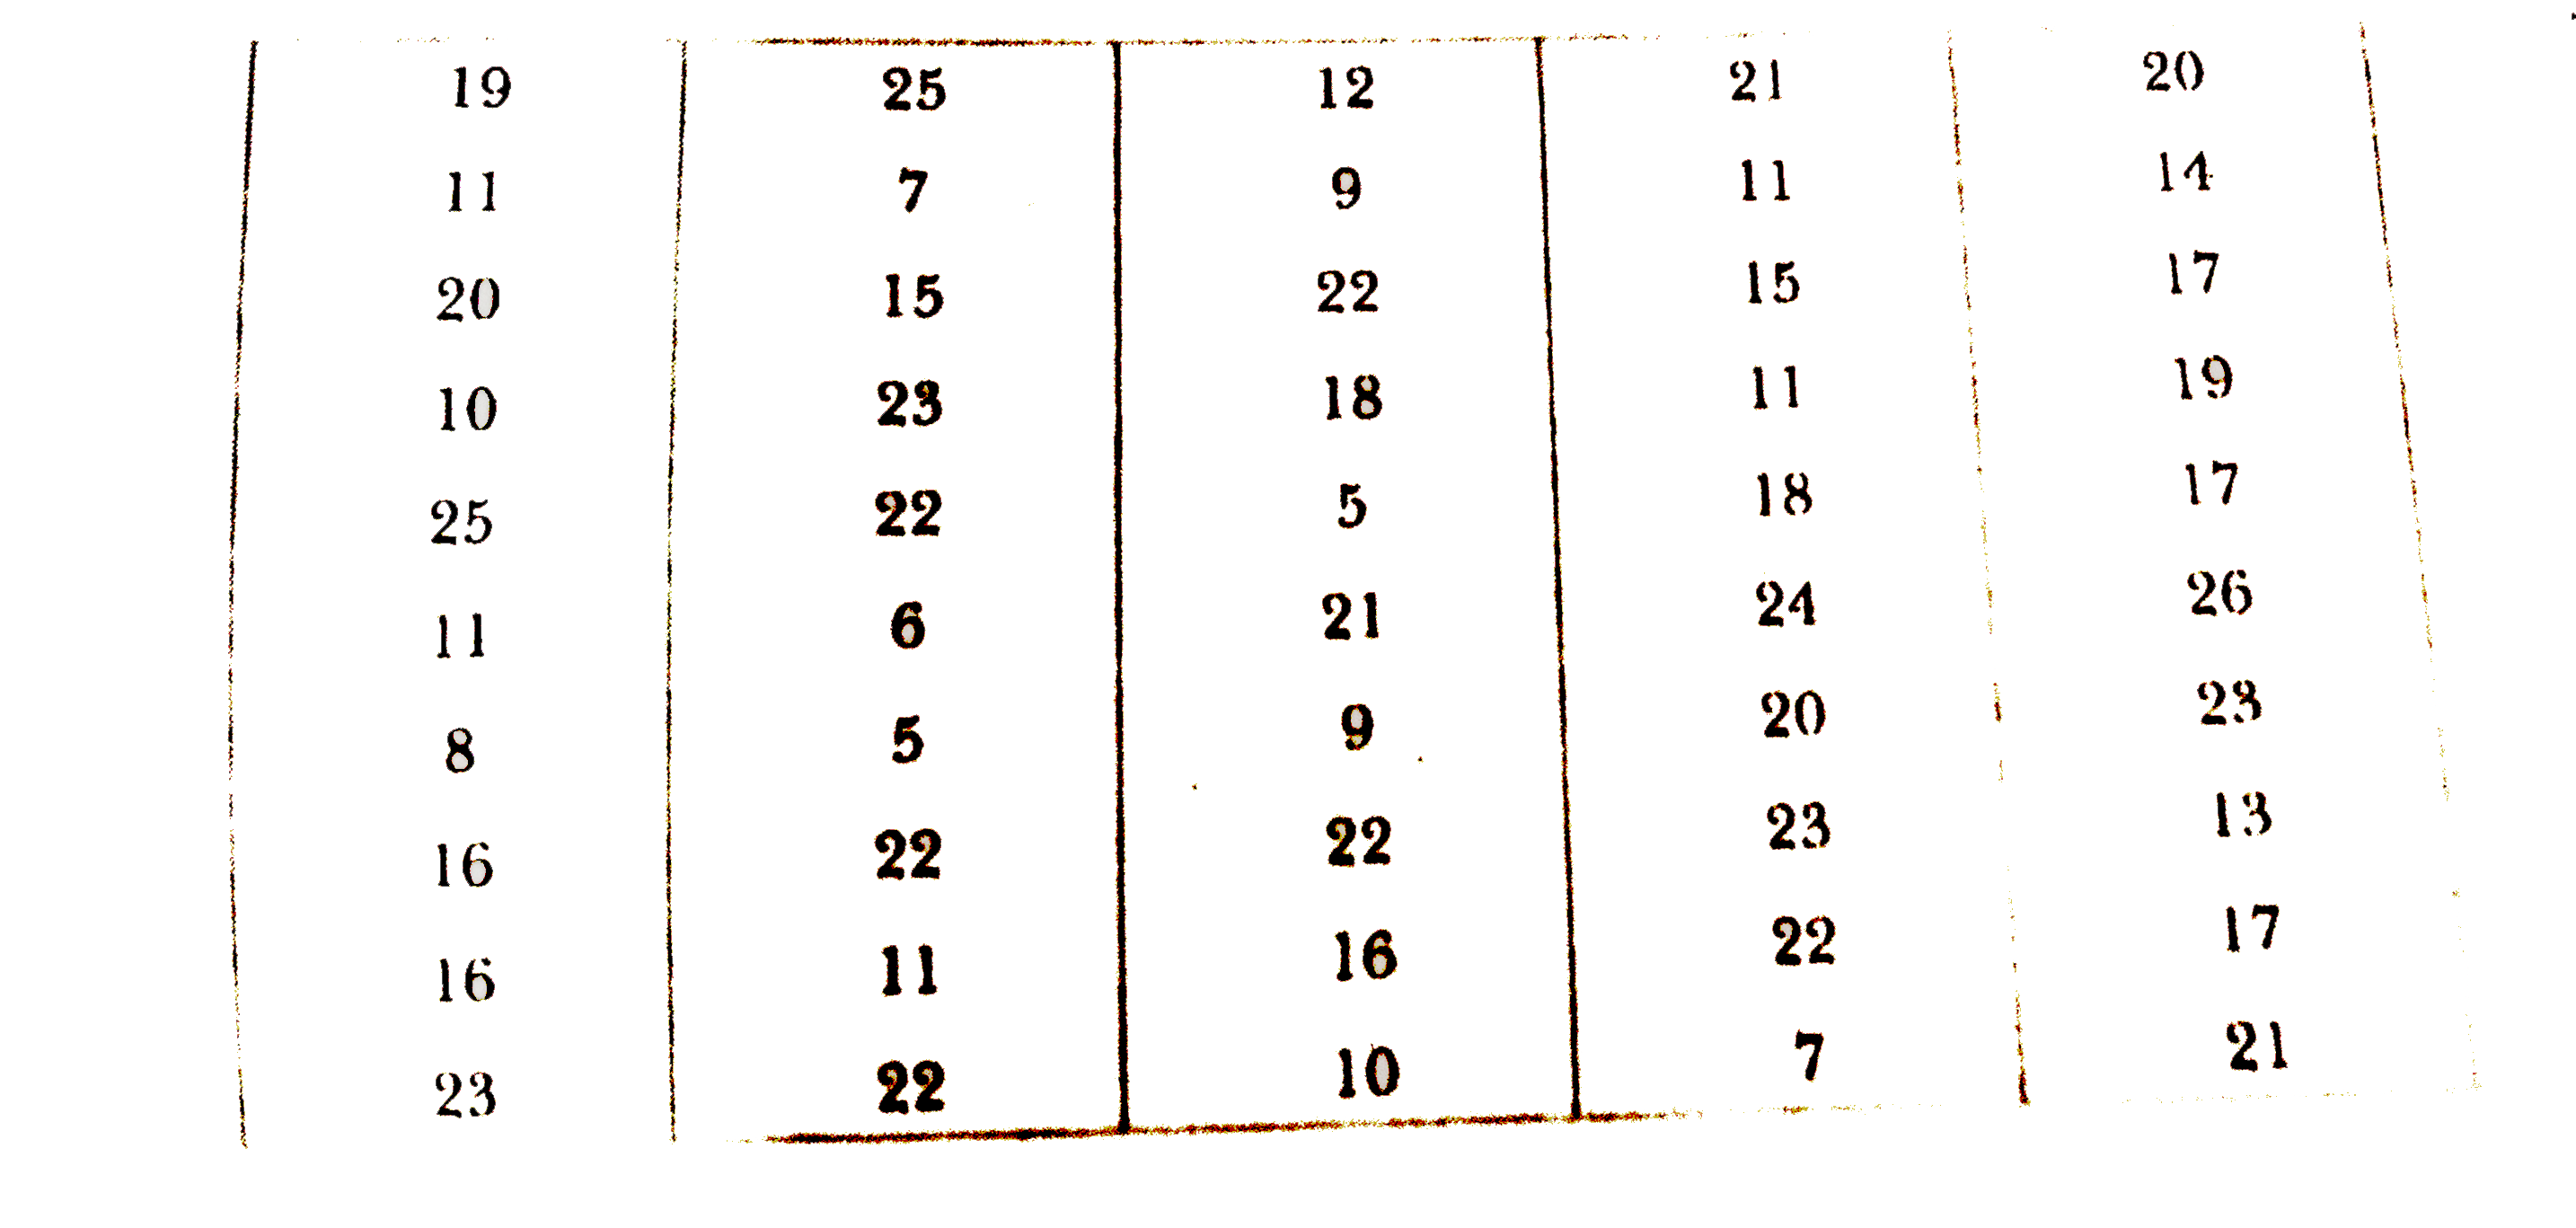
Topper's Solved these Questions
- ORGANISATION OF DATABOOK - TARUN JAIN & VK OHRICHAPTER - ORGANISATION OF DATAEXERCISE - EXERCISE M.C.Q
10 Videos
- ORGANISATION OF DATABOOK - TARUN JAIN & VK OHRICHAPTER - ORGANISATION OF DATAEXERCISE - EXERCISE FILL IN THE BLANK
7 Videos
- ORGANISATION OF DATABOOK - TARUN JAIN & VK OHRICHAPTER - ORGANISATION OF DATAEXERCISE - EXERCISE NCERT
13 Videos
- MEASURES OF DISPERSIONBOOK - TARUN JAIN & VK OHRICHAPTER - MEASURES OF DISPERSIONEXERCISE - Learning by doing
30 Videos
- PRESENTATION OF DATA - TEXTUAL AND TABULAR PRESENTATIONBOOK - TARUN JAIN & VK OHRICHAPTER - PRESENTATION OF DATA - TEXTUAL AND TABULAR PRESENTATIONEXERCISE - ESSENTIAL PRATICALS
8 Videos
Similar Questions
Knowledge Check
Which of the following is shown a graphical representation of cumulative frequency data ?
AHistogramBFrequency polygonCCumulative (ogive)DPie-chartThe median of the following data is 50. Find the values of p and q, if the sum of the all the frequencies is 90.
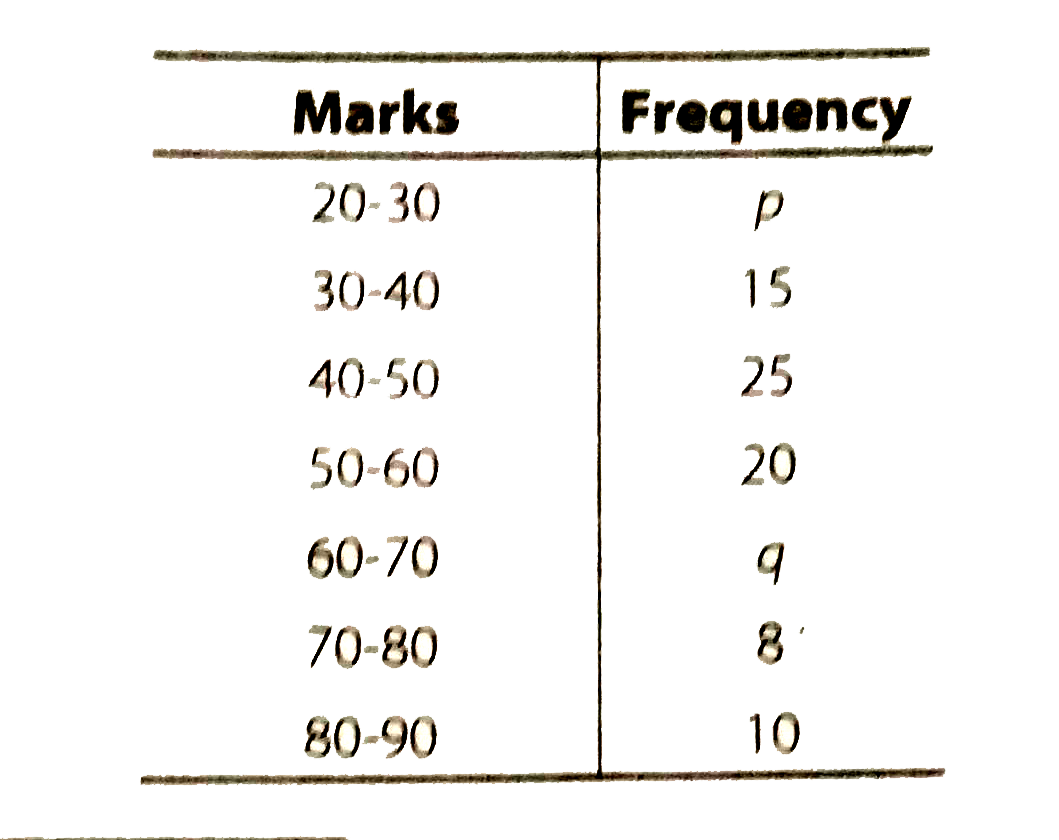 Ap=5 q=7Bp=2 q=6Cp=3 q=5Dp=5 q=8
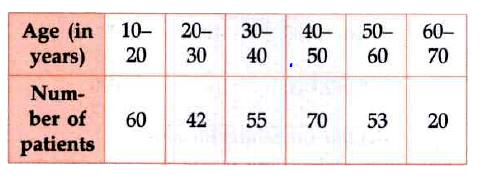
The following are the ages of 300 patients getting medical treatment in a hospital on a particular day:
Form
more than type cumulative frequency distribution.
View SolutionMake the frequency table and the cumulative frequency curve for following data
View SolutionThe following data shows the number of children in 20 families

Make a frequency table for above data
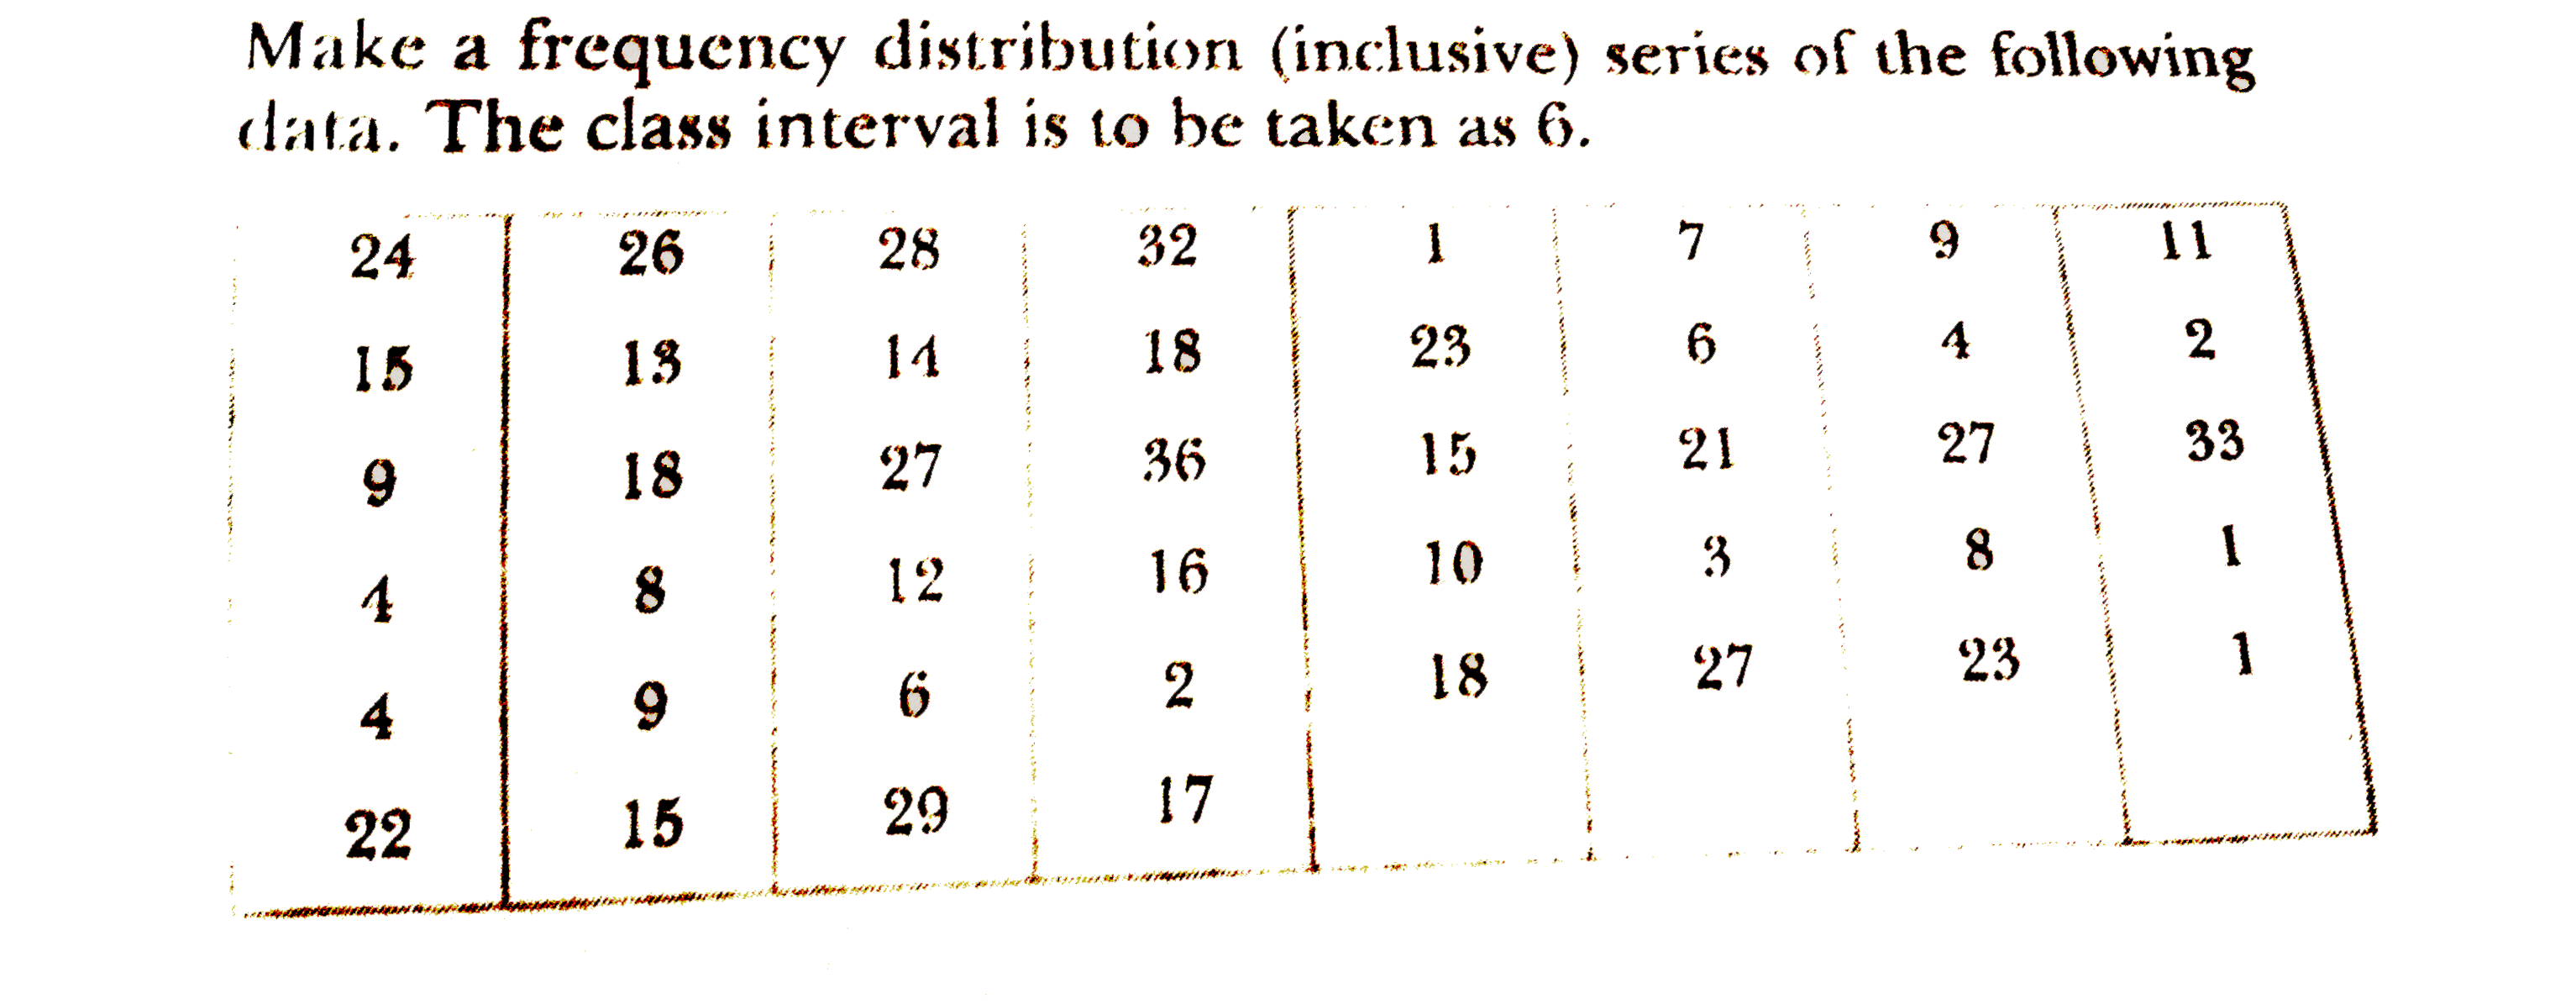
View SolutionMake a frequency distribution (inclusive ) series of the following data. The class interval is to be taken as 6.
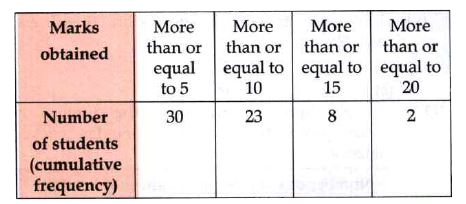
View SolutionFollowing distribution gives cumulative frequencies of 'more than type':
Change the above data to a continuous grouped frequency distribution.
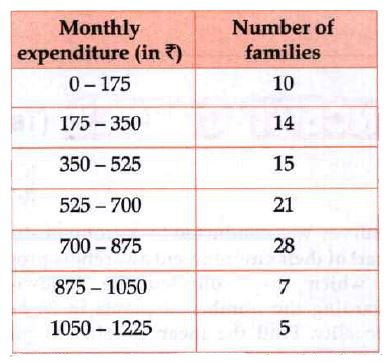
View SolutionMonthly expenditures on milk in 100 families of a housing society are given in the following frequency distribution:
Find the mode and median for this distribution.
View Solution

