We have the following data on the monthly expenditure on food (in rupees) for 30 households in a locality.

(i) Obtain a frequency distribution using following class intervals:
100-150, 150-200, 200-250, 250-300, 300-350
(ii) What percentage of households spends less than Rupees 250 per month and what percentage of households spends more than Rupess 200 per month?
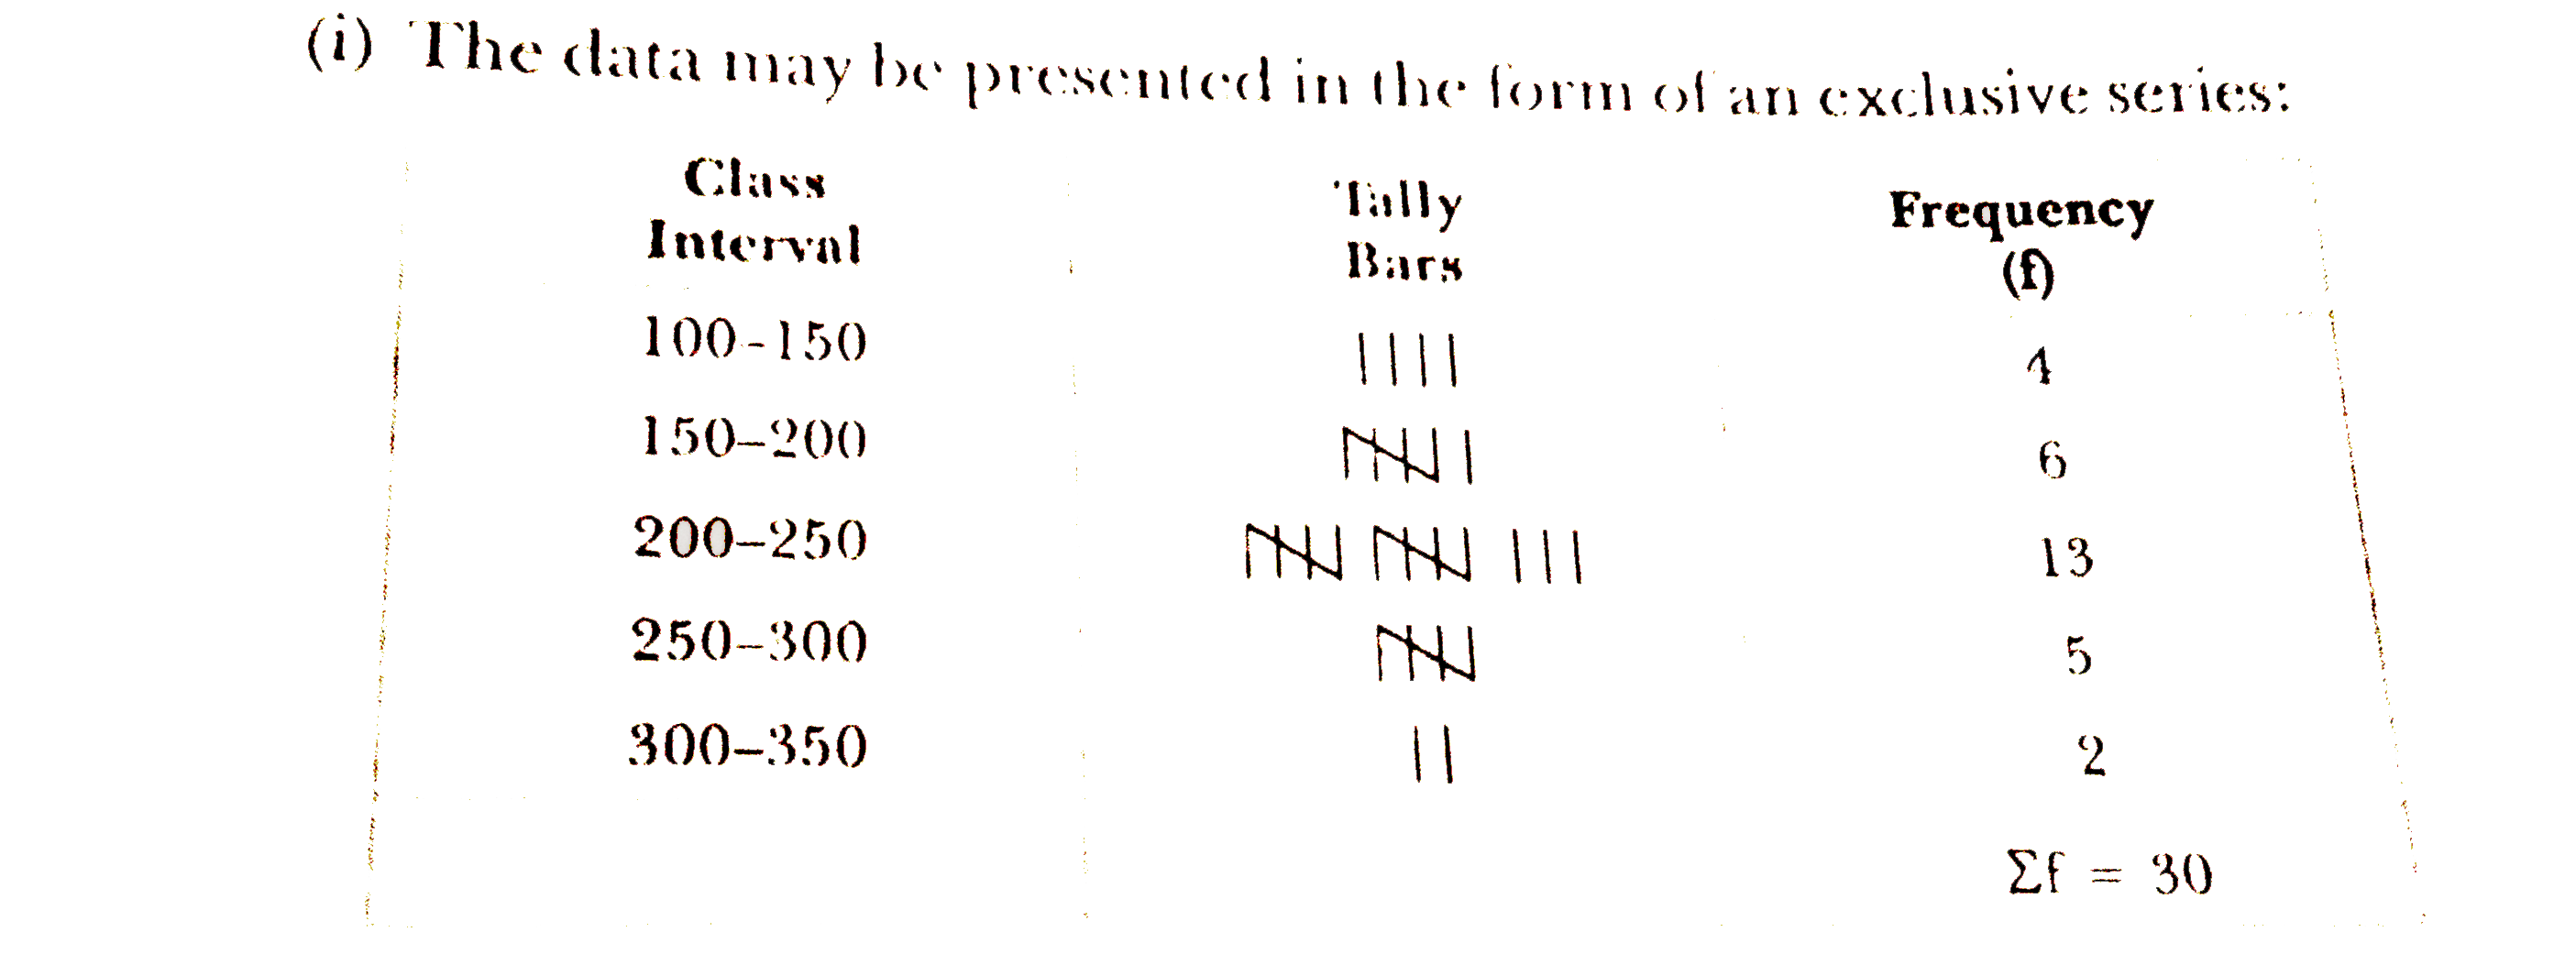
(i)The data may be presented in the form of an exclusive series :

(ii)Number of households spending less than Rupees 250 per month
= 4 +6 +13 =23
Percentage of households spending less than Rs. 250 per month
=2310×100=76.6%
Number of households spending more than Rs. 200
=13+5+2=20
Percentage of households spending more than Rs 200 per month
=2030×100=66.6%
Topper's Solved these Questions
- ORGANISATION OF DATABOOK - TARUN JAIN & VK OHRICHAPTER - ORGANISATION OF DATAEXERCISE - EXERCISE M.C.Q
10 Videos
- ORGANISATION OF DATABOOK - TARUN JAIN & VK OHRICHAPTER - ORGANISATION OF DATAEXERCISE - EXERCISE FILL IN THE BLANK
7 Videos
- ORGANISATION OF DATABOOK - TARUN JAIN & VK OHRICHAPTER - ORGANISATION OF DATAEXERCISE - EXERCISE NCERT
13 Videos
- MEASURES OF DISPERSIONBOOK - TARUN JAIN & VK OHRICHAPTER - MEASURES OF DISPERSIONEXERCISE - Learning by doing
30 Videos
- PRESENTATION OF DATA - TEXTUAL AND TABULAR PRESENTATIONBOOK - TARUN JAIN & VK OHRICHAPTER - PRESENTATION OF DATA - TEXTUAL AND TABULAR PRESENTATIONEXERCISE - ESSENTIAL PRATICALS
8 Videos
Similar Questions
An economic survey revealed that 30 families in a town incur following expenditure in a day (rupees)

(i)Convert these data in the form of a frequency distribution, using the following class intervals.
10-14,15-19,20-24,25-29,30-34 and 35-39 .
(ii)How many families spend more than 29 rupees a day ?
View SolutionThe table below shows the daily expenditure on food of 25 households in a locality.
Dail expenditure (in Rs)100−150150−200200−250250−300300−350Number of households451222
Find the mean daily expenditure on food by suitable method.
View Solution
Knowledge Check
Every month ,Kritika spends 30% of her income on house rent and 60% of the rest on household expenditure .If she saves Rs. 6300 per month ,what is her total monthly income ?
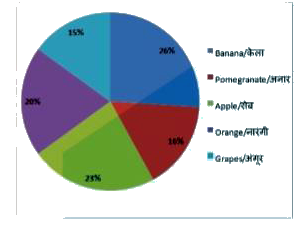
ARs. 22,000BRs. 20,500CRs. 22,500DRs. 25,000A household spend 20 per cent of their monthly food expenses on fruits. If the monthly food expense of the family is Rs 7500, answer the following questions on the basis of pie chart showing the share of expenses on different fruits in a particular month.

The amount spent on Pomegranate is how much less than spent on Orange?ARs 80BRs 75CRs 20DRs 60
The following table gives the distribution of total household expenditure (in rupees) of manual workers in a city. Expenditure (in rupees) (xi) Frequency (fi) 100-150 24 150-200 40 200-250 33 250-300 28 300-350 30 350-450 22 400-450 16 450-500 7 Find the average expenditure (in rupees) per household.
View SolutionThe following table gives the distribution of total household expenditure (in rupees) of manual workers in a city. Expenditure: (in Rs.) 100-150 150-200 200-250 250-300 300-350 350-400 400-450 450-500 Frequency: 24 40 33 28 30 22 16 7 Find the average expenditure (in Rs.) per household.
View SolutionThe monthly profits (in Rs.) of 100 shops are distributed as follows: Profits per shop: 0-50 50-100 100-150 150-200 200-250 250-300 No. of shops: 12 18 27 20 17 6 Draw the frequency polygon for it.
View SolutionA study was conducted to find out the concentration of sulphur dioxide in the air in parts per million (ppm) of a certain city. The data obtained for 30 days is a follows :

(i) Make a grouped frequency distribution table for this data with class-intervals as 0.00−0.04,0.04−0.08 and so on.
(ii) For how many day's was the concentration of sulphar dioxide more than 0.11 parts per million (ppm)?
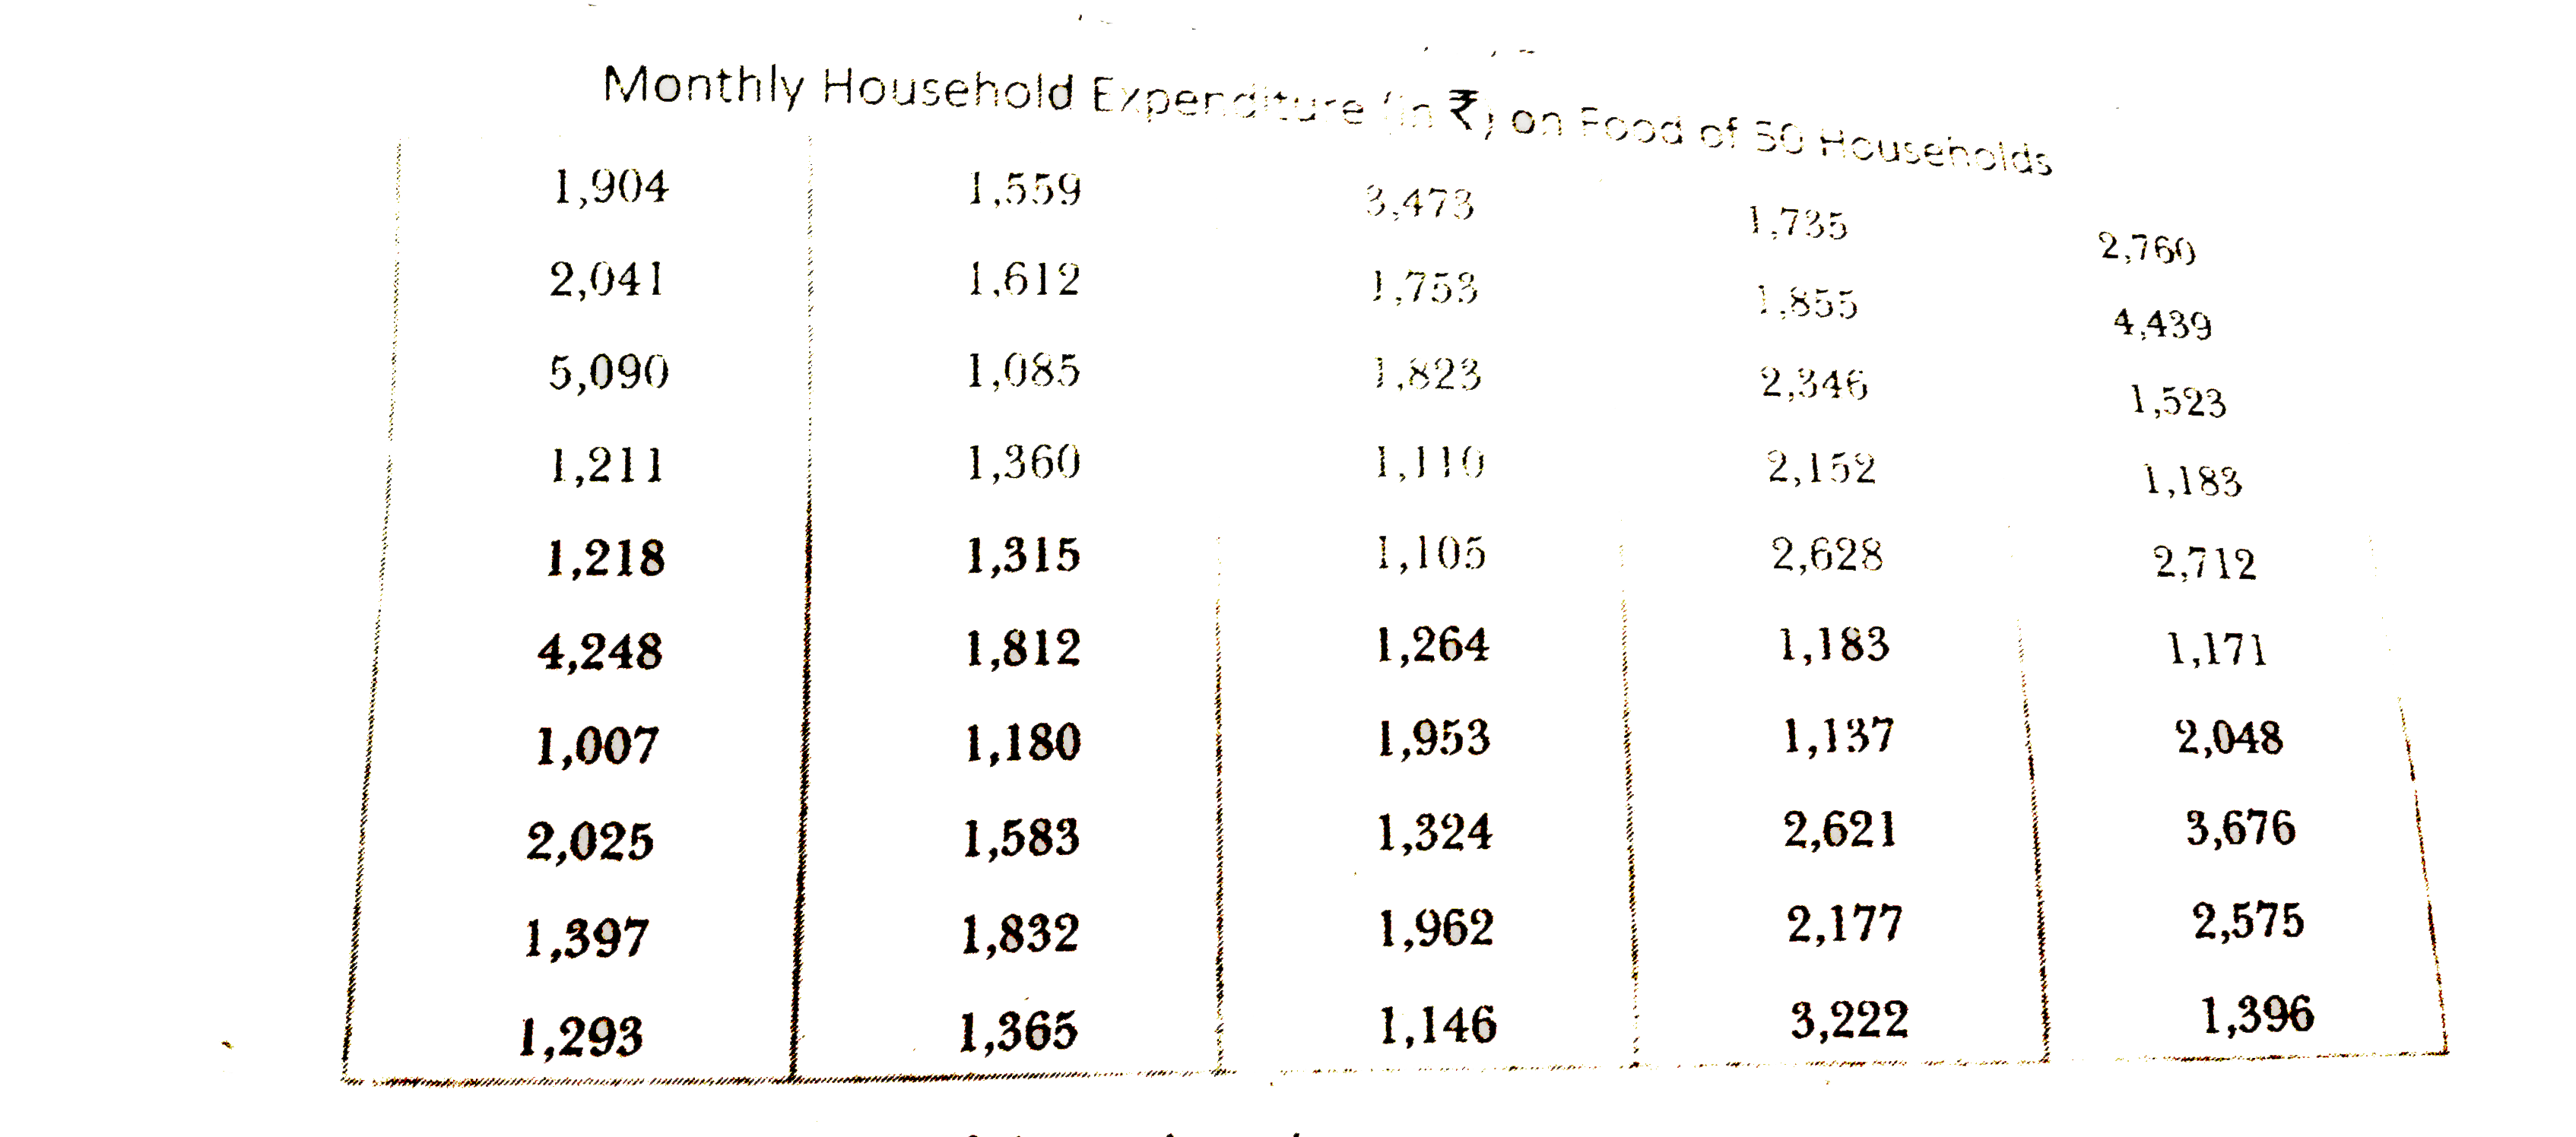
View SolutionUse the data in following table that relate to monthly household expenditure (in Rs.) on food of 50 households, and
(i) Obtain the range of monthly household expenditure on food.
(ii) Divide the range into appropriate number of class intervals and obtain the frequency distribution of expenditure.
(iii) Find the number of households whose monthly expenditure on food is
(a) less than Rs. 2,000, (b) more than Rs. 3,000, (c) between Rs. 1,500 and Rs. 500.

View SolutionOut of his total monthly income,Amit spends 30% on house rent and 60% of rest on household expanses.If he saves $3500 per month,what is his total month income?
View Solution
