In a city 45 families were surveyed for the number of domestic appliances they used. Prepare a frequency array based on their replies as recorded below .

The correct Answer is:(##TRJECOXIC04E01077_A01##)
Topper's Solved these Questions
- ORGANISATION OF DATABOOK - TARUN JAIN & VK OHRICHAPTER - ORGANISATION OF DATAEXERCISE - EXERCISE ESSENTIAL PRACTICALS
4 Videos
- MEASURES OF DISPERSIONBOOK - TARUN JAIN & VK OHRICHAPTER - MEASURES OF DISPERSIONEXERCISE - Learning by doing
30 Videos
- PRESENTATION OF DATA - TEXTUAL AND TABULAR PRESENTATIONBOOK - TARUN JAIN & VK OHRICHAPTER - PRESENTATION OF DATA - TEXTUAL AND TABULAR PRESENTATIONEXERCISE - ESSENTIAL PRATICALS
8 Videos
Similar Questions
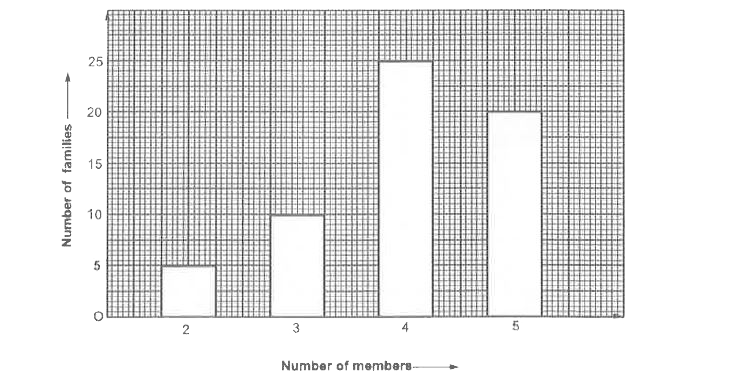
In a survey of 60 families of a colony, the number of members in each family was recorded and the data has been represented by the bar graph given below :

Read the gar graph carefully and answer the fquestion
What information does the bar graph give ?
How many families have 3 members ?
How many coupies have no child ?
Which type of family is the most common ?
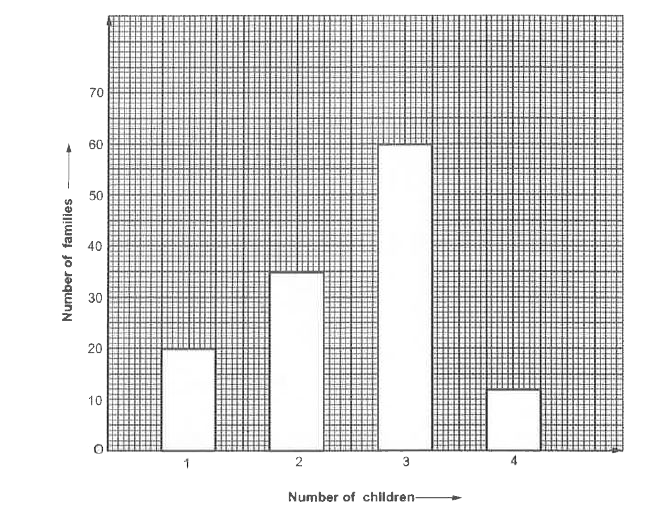
View SolutionIn a survey of 130 families of a colony, the number of children in each family was recorded and the data has been represented by the bar graph, given below.

Read the bar graph carefully and answer the questions given below:
(i)what information does the bar graph give?
(ii)how many families have two children ?
(iii)how many families have no children ?
(iv)what percentage of families have 4 children?
View Solution
Knowledge Check
The following are the steps involved in preparing a frequency table to analyse 50 families based on the number of children of those families. Arrange them in sequential order.
(A) Record tally marks for the entire data.
(B) Count the tally marks and write the number under frequency columne.
(C ) Draw a table with columne namely (1). number of children , (2). Tally marks, and (3). number of families (frequency).
(D) Select a family and write tally mark against the corresponding number of children.ACBDABDCABCCDABDCBAD
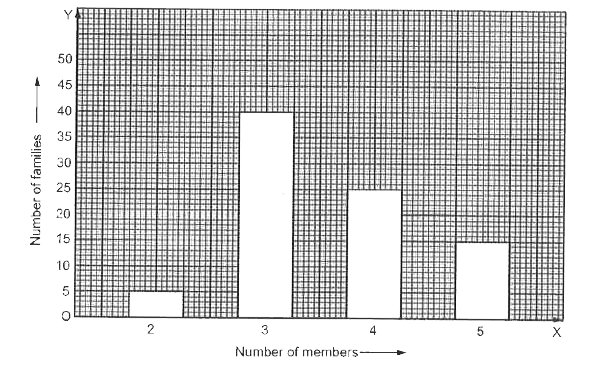
In a survey of 85 families of a colony, the number of members in each family was recorded and the data has been represented by the following bar graph
Read the bar graph carefully and answer the questions given below
Q (i) What information does the bar graph give
(ii) How many families have 3 members
(iii) How many people live alone
(iv) Which type of family is the most common? How many members are there in each family of this kind

View SolutionStudents were asked to conduct a survey and prepare a report on the number of tigers in Rajasthan. They were surprised to see that very less number of tigers are there.
How is the small number of surviving tigers a cause of worry from the genetics point of view ?
View SolutionStudents were asked to conduct a survey and prepare a report on the number of tigers in Rajasthan. They were surprised to see that very less number of tigers are there.
As a student, what measures can you take to create awareness among people ?
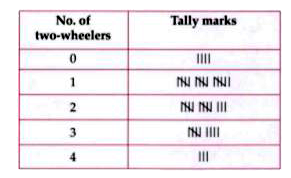
View SolutionThe number of two-wheelers owned by each of 45 families are listed below.

Assertion: The number of families having 3 two-wheelers is 9.
Reason : 9 is represented as cancel(|||) |||.
View SolutionStudents were asked to conduct a survey and prepare a report on the number of tigers in Rajasthan. They were surprised to see that very less number of tigers are there.
What caused this sharp decrease in number of tigers ?
View SolutionElectricity energy consumption is the form of energy consumption that uses electric energy. Global electricity consumption continues to increase faster than world population, leading to an increase in the average amount of electricity consumed per person (per capita electricity consumption).

A survey is conducted for 56 families of a Colony A. The following tables gives the weekly consumption of electricity of these families.

The similar survey is conducted for 80 families of Colony B and the data is recorded as below:

Refer to data received from Colony A
The median weekly consumption is
View SolutionElectricity energy consumption is the form of energy consumption that uses electric energy. Global electricity consumption continues to increase faster than world population, leading to an increase in the average amount of electricity consumed per person (per capita electricity consumption).

A survey is conducted for 56 families of a Colony A. The following tables gives the weekly consumption of electricity of these families.

The similar survey is conducted for 80 families of Colony B and the data is recorded as below:

Refer to data received from Colony A
The mean weekly consumption is
View Solution
