In a survey of 60 families of a colony, the number of members in each family was recorded and the data has been represented by the bar graph given below :
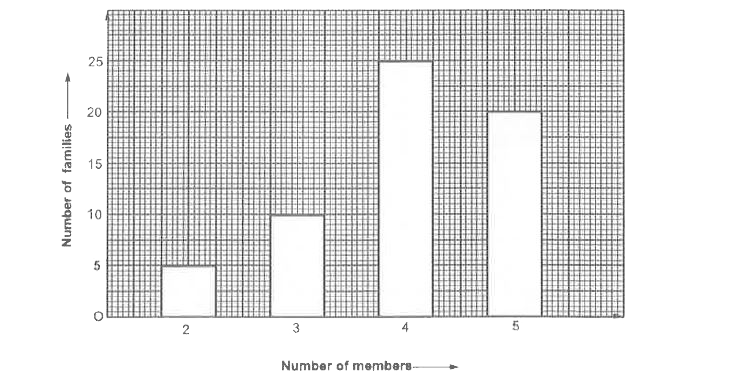
Read the gar graph carefully and answer the fquestion
What information does the bar graph give ?
How many families have 3 members ?
How many coupies have no child ?
Which type of family is the most common ?
The correct Answer is:(i) The given bar graph shows the number of members in each of the 60 families of a colony.
(ii) 10 families have 3 members each.
(iii) 5 couples have no child.
(iv) A family of 4 members is most common.
Step by step video, text & image solution for In a survey of 60 families of a colony, the number of members in each family was recorded and the data has been represented by the bar graph given below : Read the gar graph carefully and answer the fquestion What information does the bar graph give ? How many families have 3 members ? How many coupies have no child ? Which type of family is the most common ? by Maths experts to help you in doubts & scoring excellent marks in Class 6 exams.
Topper's Solved these Questions
- BOOK - RS AGGARWALCHAPTER - BAR GRAPH EXERCISE - EXERCISE4videos
BAR GRAPH
- BOOK - RS AGGARWALCHAPTER - ANGLES AND THEIR MEASUREMENTEXERCISE - EXERCISE D13videos
ANGLES AND THEIR MEASUREMENT
- BOOK - RS AGGARWALCHAPTER - CIRCLESEXERCISE - C. WRITE T FOR TRUE AND F FOR FALSE FOR EACH OF THE STATEMENTS GIVEN BELOW:1videos
CIRCLES
Similar Questions
In a survey of 130 families of a colony, the number of children in each family was recorded and the data has been represented by the bar graph, given below.
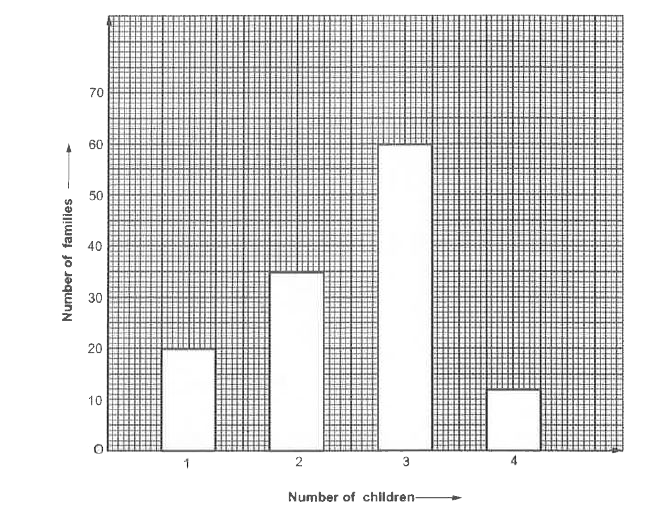
Read the bar graph carefully and answer the questions given below:
(i)what information does the bar graph give?
(ii)how many families have two children ?
(iii)how many families have no children ?
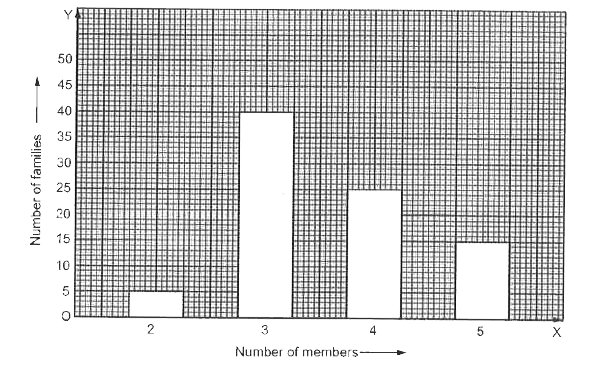
(iv)what percentage of families have 4 children?View SolutionIn a survey of 85 families of a colony, the number of members in each family was recorded and the data has been represented by the following bar graph
Read the bar graph carefully and answer the questions given below
Q (i) What information does the bar graph give
(ii) How many families have 3 members
(iii) How many people live alone
(iv) Which type of family is the most common? How many members are there in each family of this kind
 View Solution
Knowledge Check
- Question 1 - Select One
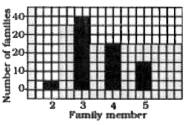
Study the bar graph carefully and answer the following question.
Which type if family is the most common ?A2 membersB3 membersC4 membersD5 members
Read the bar graph and answer the following questons.
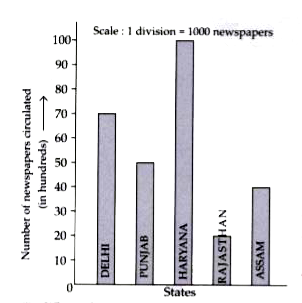
What information is given by graph ?View SolutionRead the graph and answer the following questions
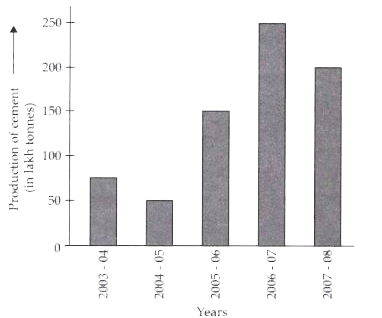
What information is conveyed by the bar graphView SolutionRead the bar graph given below and answer the following questions:

What information is given by the þar graph?View SolutionRead the bar graph shown in figure and answer the following questions.
What is the information given by the bar graph?
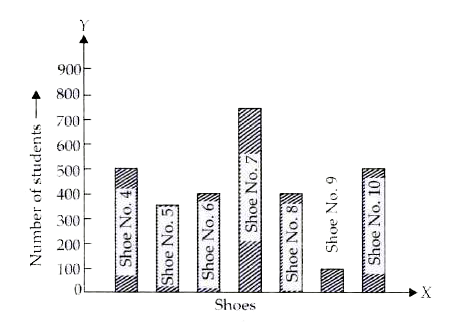 View Solution
Number of wrist watches manufactured by a factory in six days of a particular week is given below.
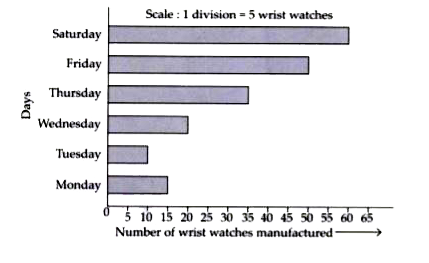
Read the bar graph and answer the following questions.
What information does the bar graph gives ?View SolutionRead the following bar graph given in figure and answer the following questions.
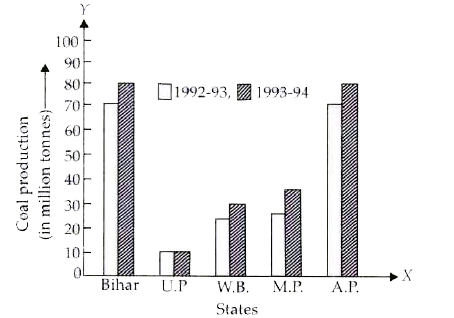
(i) What information is given by this bar graph?View SolutionRead the graph and answer the following questions
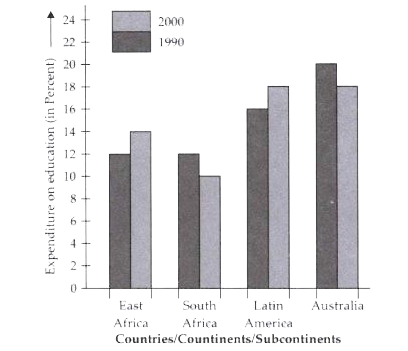
Give a suitable title to bar graphView Solution

