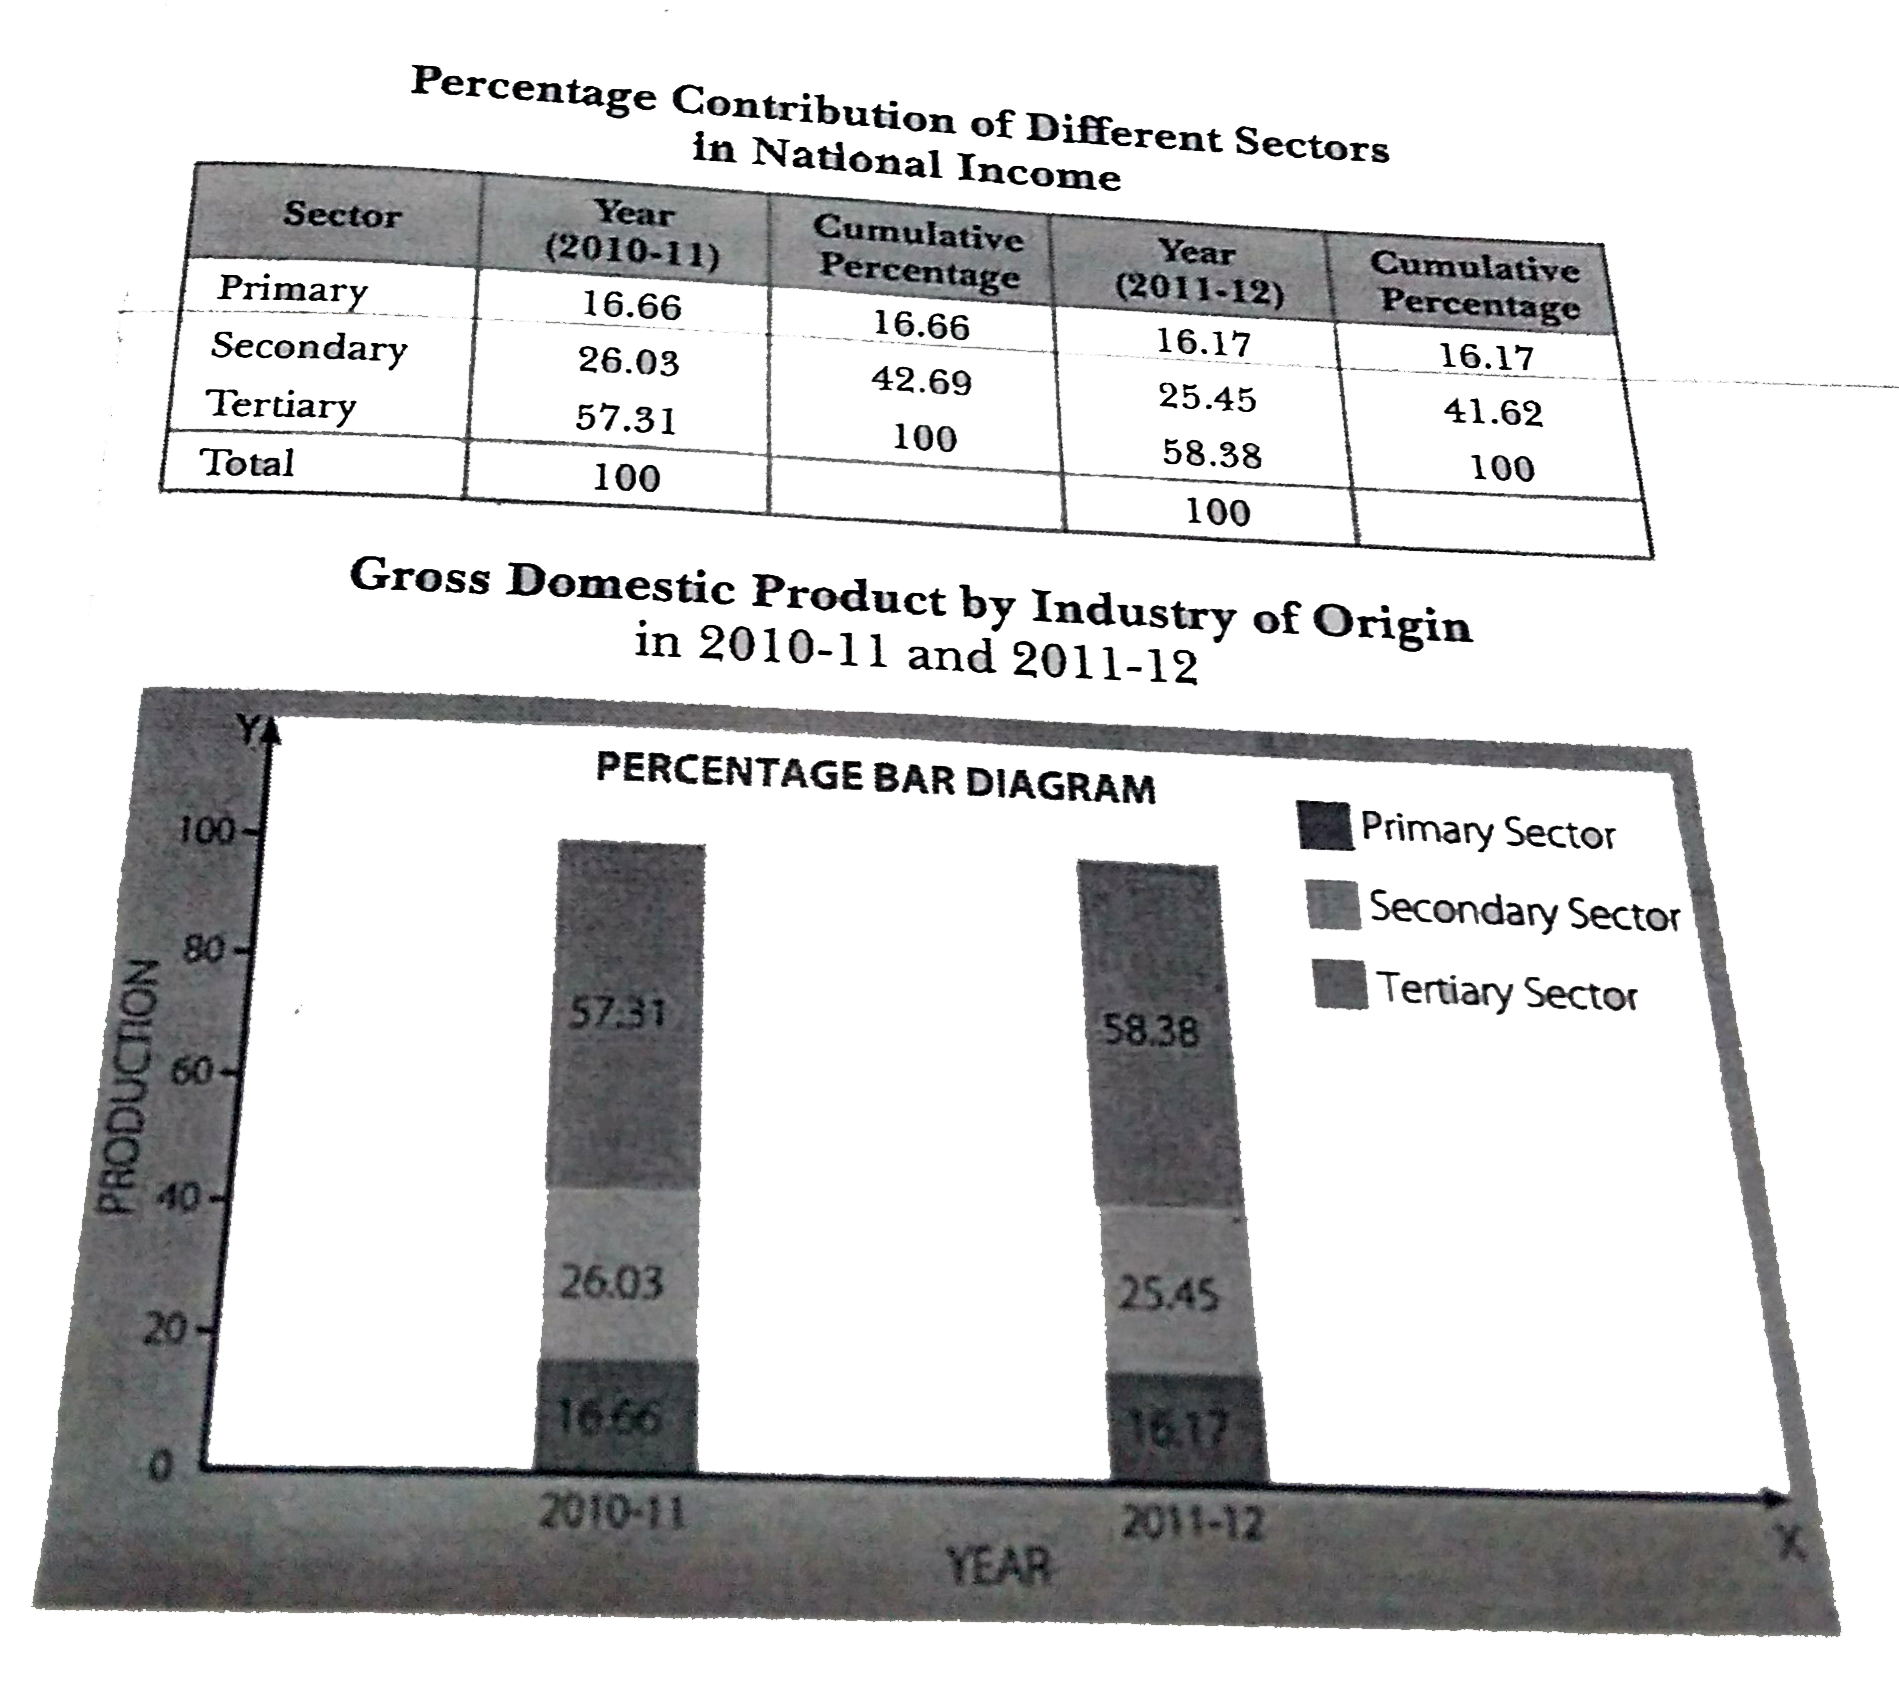
Gross Domestic Product by Industry of origin (at 2004-05 prices) is given for the years 2010-11 and 2011-12. Present this data in terms of percentage bar diagram.
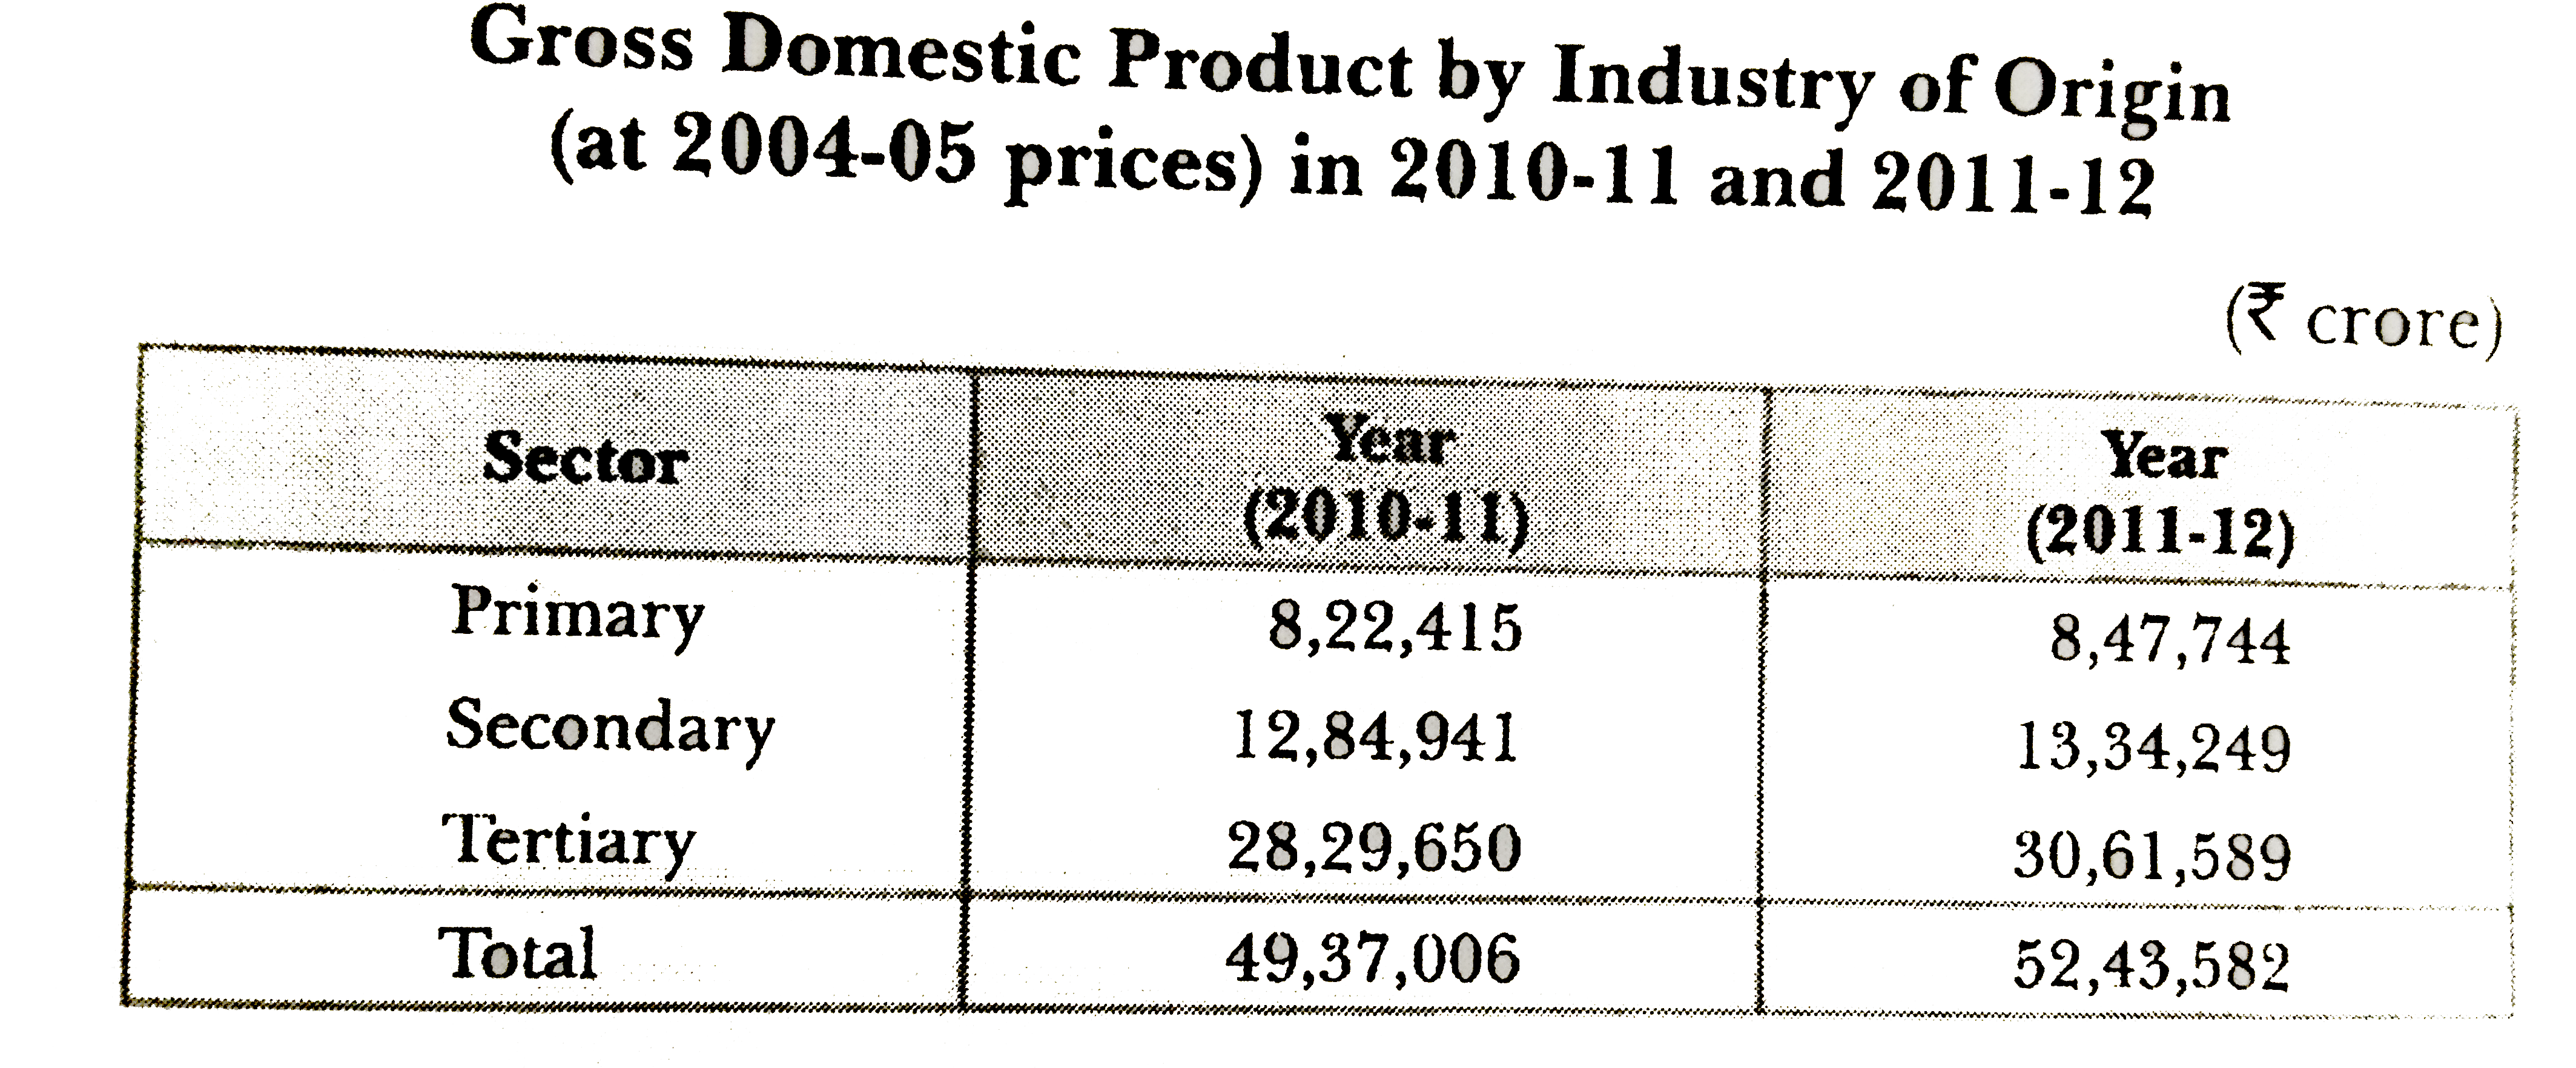
These data are first reduced to percentages and than presented in terms of percentage bar diagram, as under :
Similar Questions
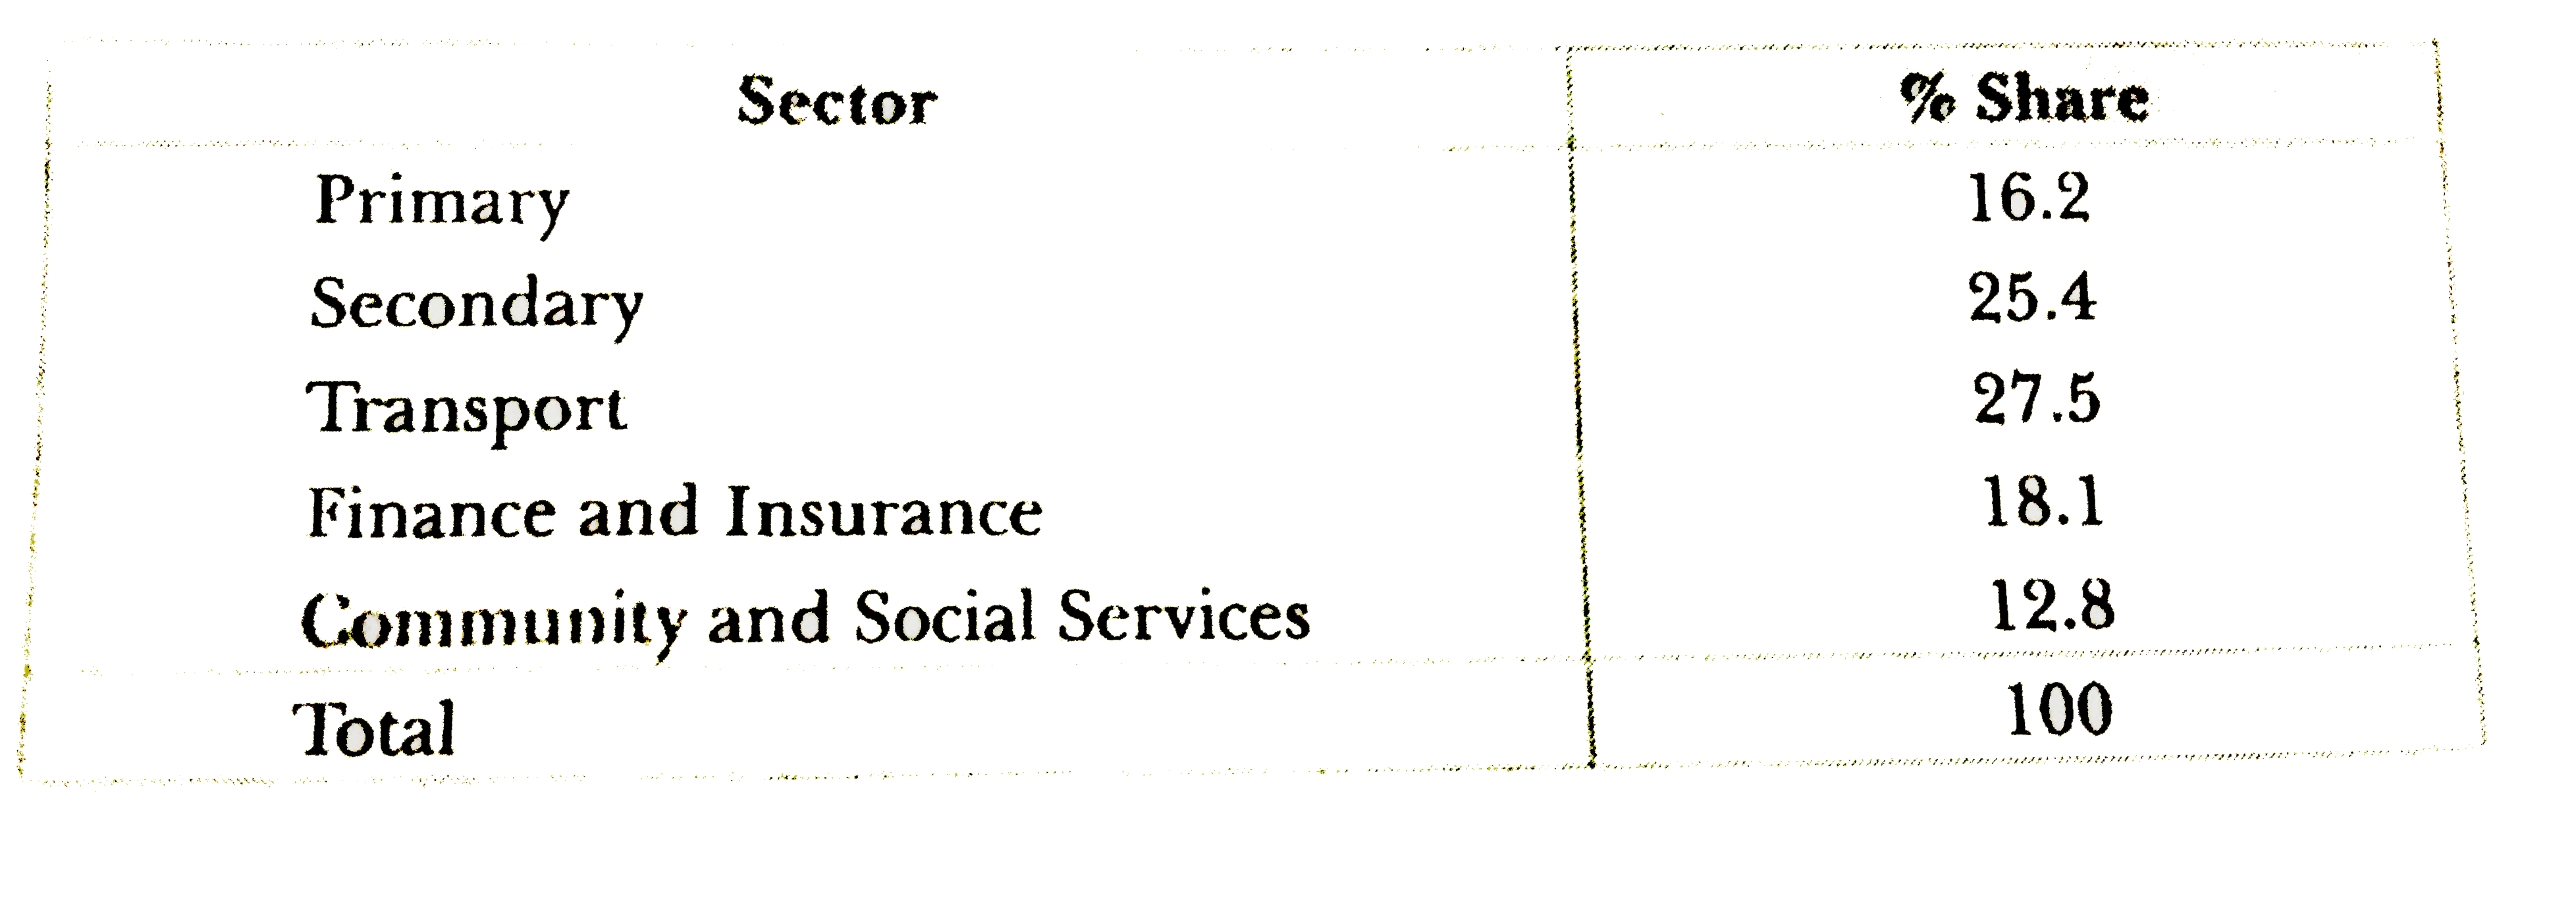
In 2011-12, Net Domestic Pdoduct by Industry of origin (at 2004-05) is as given below. Present information in the form of a pic diagram.
 View Solution
For the year 2012-13 and 2013-14 value of gross domestic product at factor cost by the industry of origin is given in the following table. Prsent the information in the form of pie diagaram showing differences in the percentage contribution of different secotrs between the said years.
 View Solution
Knowledge Check
- Question 1 - Select One
Statement I : Indian economy has experienced slower growth rate during the years 2010 - 11 and 2011 - 12.
Statement II : Indian economy has experienced weakening industrial growth during the period.ABoth the statements are individually true and Statement II is the correct explanation of Statement I.BBoth the statements are individually true but Statement II is not the correct explanation of Statement I.CStatement I is true but Statement II is false.DStatement I is false but Statement II is true. - Question 2 - Select One
The bar graph given below shows the production (in000 tonnes) of rice of a country for the year 2007 to 2011 .
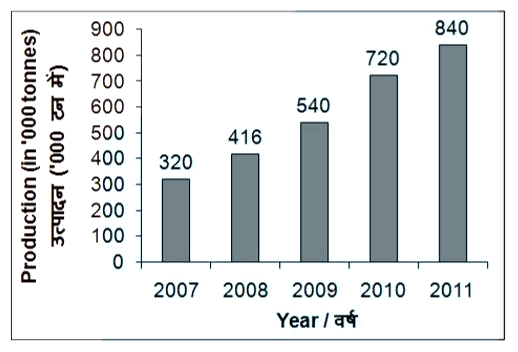
the production of rice in year 2011 is what percent of the production of rice in 2010 ?A116.66B121.5C133.33D108.5 - Question 3 - Select One
The bar graph given below shows the production (in000 tonnes) of rice of a country for the year 2007 to 2011 .
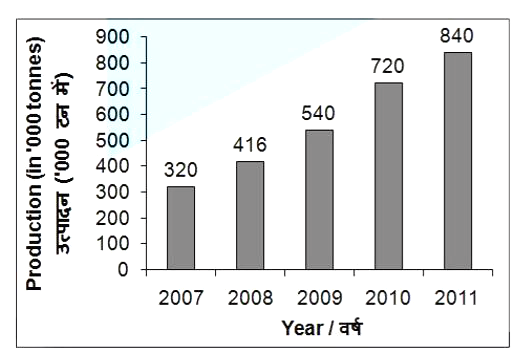
The production of rice in year 2010 is how much percent more that the production of rice in the year 2009 ?A21.5B37.5C42.5D33.33
Study the following information carefully and answer the given questions: The following bar graph shows the price per square feet of lands in different years
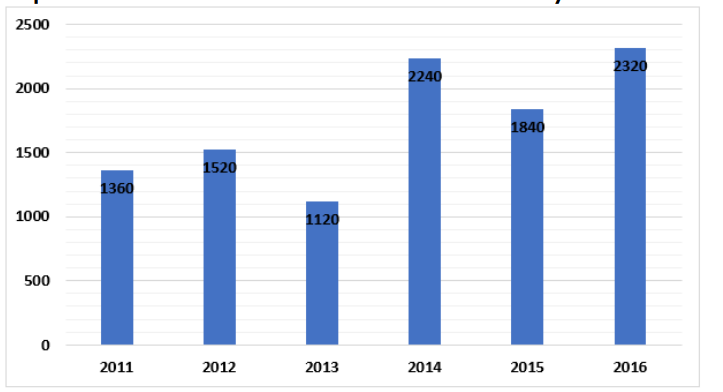
The price per square feet in the year 2011 and 2014 together is approximately what percentage of the price per square feet in the year 2012 and 2015 together?View SolutionThe given Bar Graph presents the results in terms of the number of students in a school for the five academic years, 2013-2014 to 2017-2018. In which year the percentage increase in total number of students is the lowest in comparison to its previous academic year?
दिया गया दंड आरेख पांच शैक्षणिक वर्षों : 2013-2014 से 2017-2018 तक एक विद्यालय में छात्रों की संख्या के संदर्भ में परिणामों को प्रस्तुत करता है |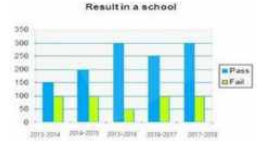
किस वर्ष छात्रों की कुल संख्या में प्रतिशत वृद्धि पिछले शैक्षणिक वर्ष की तुलना में सबसे कम है ?View SolutionWith reference to Indian economy, consider the following statements :
1. The Gross Domestic Product (GDP) has increased by four times in the last 10 years
2. The percentage share of Public sector in GDP has declined in the last 10 years.
Which of the statements given above is/are correct?View SolutionThe bar graph given below shows the production (in 000 tonnes) of rice of a country for the year 2007 to 2011 ?
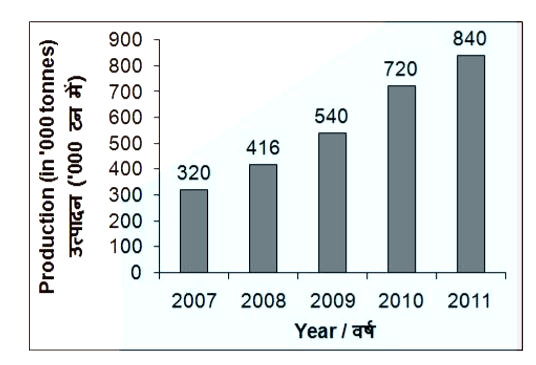
How much is the percentage increase in the production of rice in the year 2008 in comparison to year 2007 ?View SolutionThe given Bar Graph presents the results in terms of the number of students in a school for the five academic years, 2013-2014 to 2017-2018.
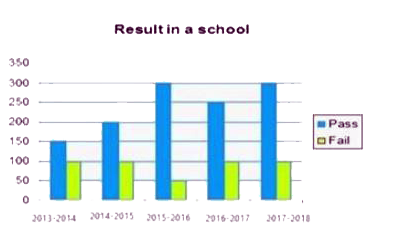
In which year the percentage increase in total number of students is the lowest in comparison to its previous academic yearView Solution

