For the year 2012-13 and 2013-14 value of gross domestic product at factor cost by the industry of origin is given in the following table. Prsent the information in the form of pie diagaram showing differences in the percentage contribution of different secotrs between the said years.

Step by step video & image solution for For the year 2012-13 and 2013-14 value of gross domestic product at factor cost by the industry of origin is given in the following table. Prsent the information in the form of pie diagaram showing differences in the percentage contribution of different secotrs between the said years. by Economics experts to help you in doubts & scoring excellent marks in Class 11 exams.
Updated on:21/07/2023Topper's Solved these Questions
- DIAGRAMMATIC PRESENTATION OF DATA BAR DIAGRAMS AND PIE DIAGRAMSBook:TARUN JAIN & VK OHRIChapter:DIAGRAMMATIC PRESENTATION OF DATA BAR DIAGRAMS AND PIE DIAGRAMSExercise:NCERT Question (With Hints to Answers)
Explore 3 Videos
- DIAGRAMMATIC PRESENTATION OF DATA BAR DIAGRAMS AND PIE DIAGRAMSBook:TARUN JAIN & VK OHRIChapter:DIAGRAMMATIC PRESENTATION OF DATA BAR DIAGRAMS AND PIE DIAGRAMSExercise:Essential praticals
Explore 1 Video
- CORRELATIONBook:TARUN JAIN & VK OHRIChapter:CORRELATIONExercise:NCERT Questions (with Hints to Answers)
Explore 10 Videos
- FREQUENCY DIAGRAMS - HISTOGRAM, POLYGON AND OGIVEBook:TARUN JAIN & VK OHRIChapter:FREQUENCY DIAGRAMS - HISTOGRAM, POLYGON AND OGIVEExercise:EXERCISE NCERT
Explore 7 Videos
Similar Questions
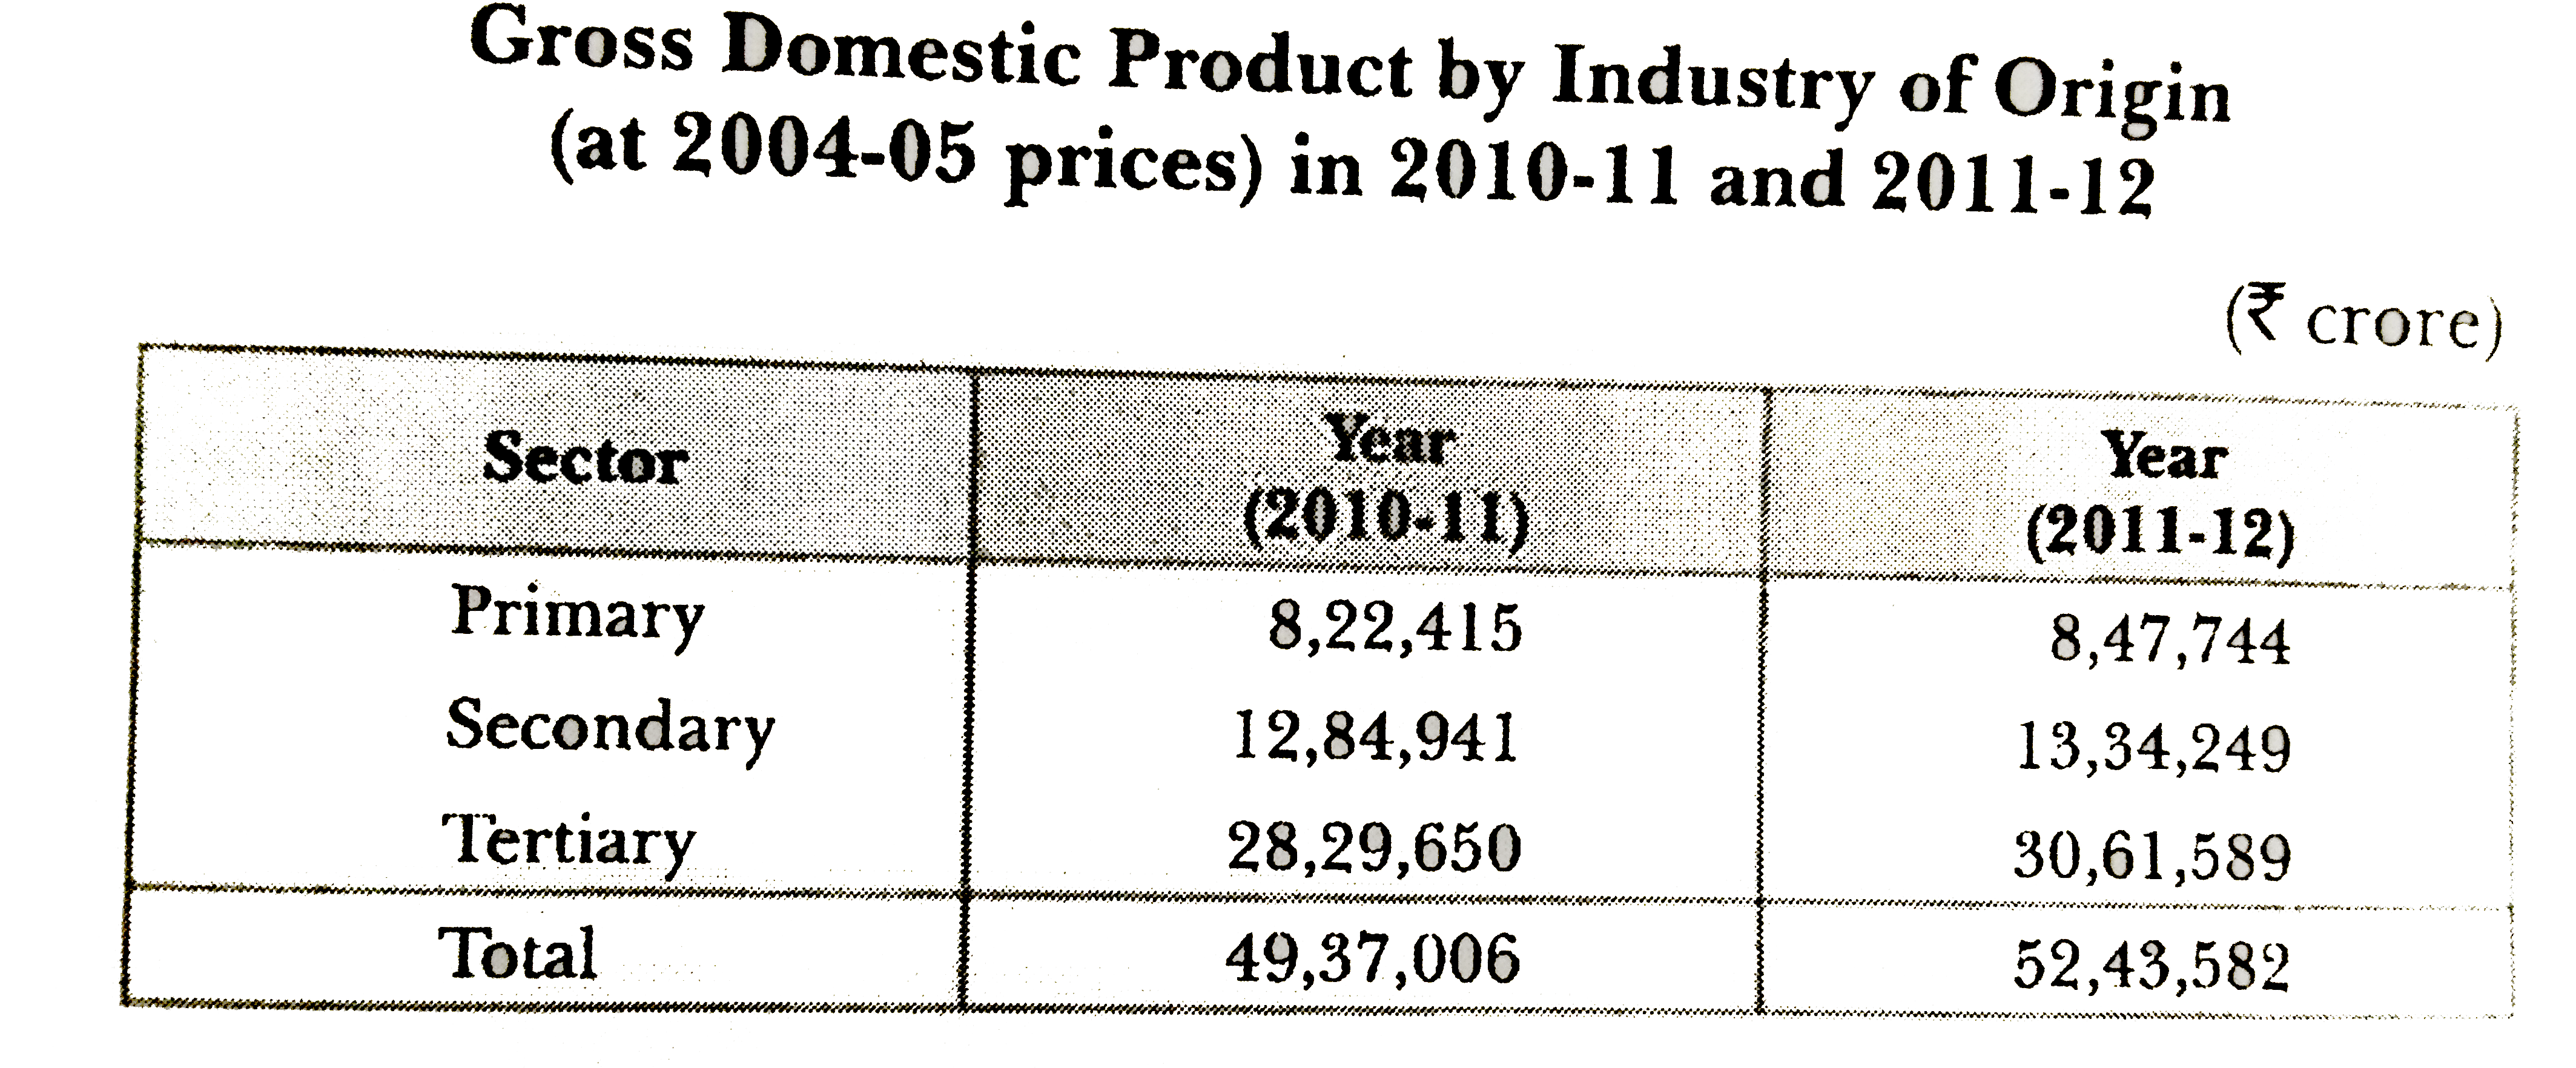
Gross Domestic Product by Industry of origin (at 2004-05 prices) is given for the years 2010-11 and 2011-12. Present this data in terms of percentage bar diagram.
View SolutionFollowing information relates to the production of wheat and Rice in India in different years. Present it in the form of a table.

View Solution
Knowledge Check
International trade represents a significant share of Gross Domestic Product (GDP). While international trade has been present throughout much of history, its economic , social and political importance has been on the rise in recent centuries.
Industrialization , advances in technology, transportation, globalization, multinational corporations, and outsourcing are all having a major impart on the international trade is crucial to the continuance of globalization. International trade is, in principle,, not different from domestic as the motivation and the behaviour of parties is across a border or not. The main difference is that international trade. Another difference between domestic and international trade is that factors of production such as capital and labour are typically more mobile within a country than across countries.
Which of the following is one of the factors of production?ACapitalBCostCProfitDLossThe bar diagram given below shows the productions (in the unit of thousand pieces) of three types of biscuits by a company in the five consecutive years. Study the diagram and answer the following questions.
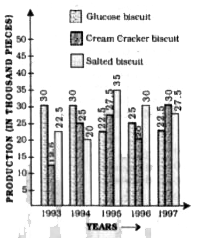
The difference (in the unit of thousand pieces) between the total number of cream cracker biscuits manufactured in the years 1993, 1995 and 1997 and hte total number of the biscuits of same type in the years 1994 and 1996 isA15B25C30D20
The line graph shows the number of students of a certain university who passed in the given year in their final exams. Study the diagram and answer the following questions.
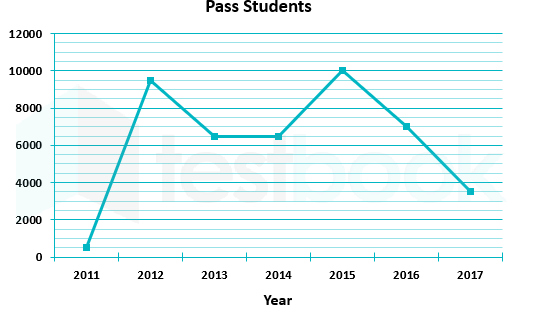
What was the difference in the number of students who passed between the years 2013 and 2016?
View SolutionThe line graph shows the number of students of a certain university who failed in the given year in their final exams. Study the diagram and answer the following questions
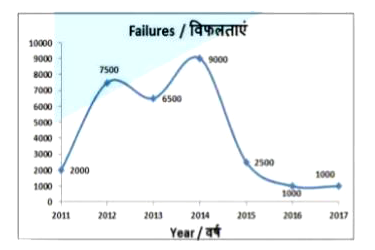
What was the difference in failures between the years 2011 and 2013?
View SolutionRead the bar graph given below and answer the following questions.
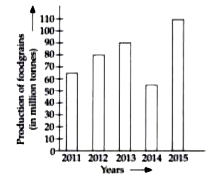
Find the difference between the production of foodgrains in million tonnes) in the year 2012 and 2015.
View SolutionThe line graph show the number of students admitted in the given year to a certain university. Study the diagram and answer the following questions.
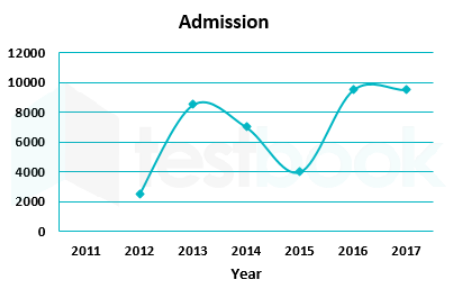
What was the difference in admissions between the years 2016 and 2012 ?
View SolutionIndia is competitive manufacturing location due to the low cost of manpower and strong technical and engineering capabilities contributing to higher quality production runs. The production of TV sets in a factory increases uniformly by a fixed number every year. It produced 16000 sets in 6th year and 22600 in 9th year.
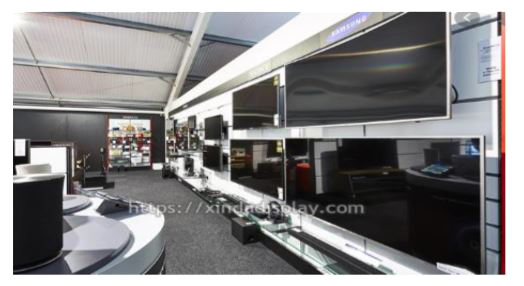
Based on the above information, answer the following questions:
Find the difference of the production during 7th year and 4th year.
View SolutionA table showing the percentage of the total population of a State by age groups for the year 1991 is given below. Answer the questions given below it.
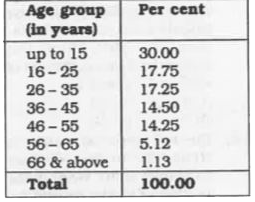
If there are 10 millions people in the age group 56 years and above, what is the difference between the numbers of people in the age groups 16-25 and 46-55?
View Solution