What is a multiple bar diagram ?
The correct Answer is:Multiple bar diagrams are those diagrams which show two or more sets data simultaneously. Generally, these diagrams are used to make comparison between two sets of series, such as birth-rate series.
Multiple bar diagrams are those diagrams which show two or more sets data simultaneously. Generally, these diagrams are used to make comparison between two sets of series, such as birth-rate series.
Similar Questions
Knowledge Check
Glven here is a multiple bar diagram depicting the changes in the students strength of a college in four faculties from 1990-91 to 199293. Study the diagram and answer the questions.
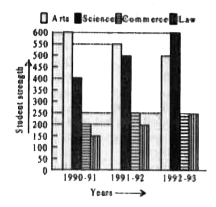
In which faculty was there a regular decrease in students' strength?AArtsBScienceCCommerceDLawGlven here is a multiple bar diagram depicting the changes in the students strength of a college in four faculties from 1990-91 to 199293. Study the diagram and answer the questions.
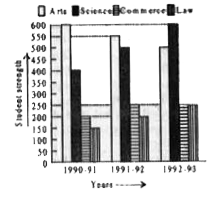
The percentage of students in Science faculty in 1990-91 wasA26.9B27.8C29.6D30.2Given here is a multiple bar diagram depicting the changes in the students strength of a college in four faculties from 1990 - 91 to 1992 - 93. Study the diagram and answer the questions.
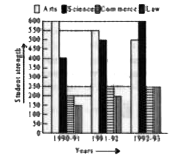
The percentage of students in Science faculty in 1990 - 91 wasA26.9%B27.8%C29.6%D30.2%
Given here is a multiple bar diagram depicting the changes in the students strength of a college in four faculties from 1990 - 91 to 1992 - 93. Study the diagram and answer the questions.
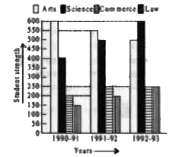
In which faculty was there a regular decease in students' strength?
View SolutionGlven here is a multiple bar diagram depicting the changes in the students strength of a college in four faculties from 1990-91 to 199293. Study the diagram and answer the questions.
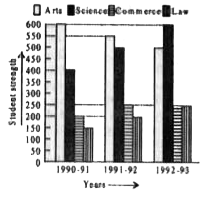
What was the percent in crease in Science students from the year 1990 - 91 to 1992-93 ?
View SolutionGiven here is a multiple bar diagram depicting the changes in the students strength of a college in four faculties from 1990 - 91 to 1992 - 93. Study the diagram and answer the questions.
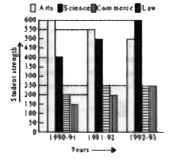
What was the percent increase in Science students from the year 1990 - 91 to 1992 - 93 ?
View SolutionGlven here is a multiple bar diagram depicting the changes in the students strength of a college in four faculties from 1990-91 to 199293. Study the diagram and answer the questions.
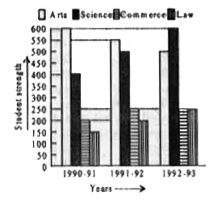
The total students strength in 1991-92 was how many times that of Commerce students in the same year ?
View SolutionGiven here is a multiple bar diagram depicting the changes in the students strength of a college in four faculties from 1990 - 91 to 1992 - 93. Study the diagram and answer the questions.
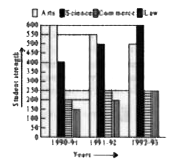
The total students strength in 1991 - 92 was how many times that of Commerce students in the same year ?
View Solution

