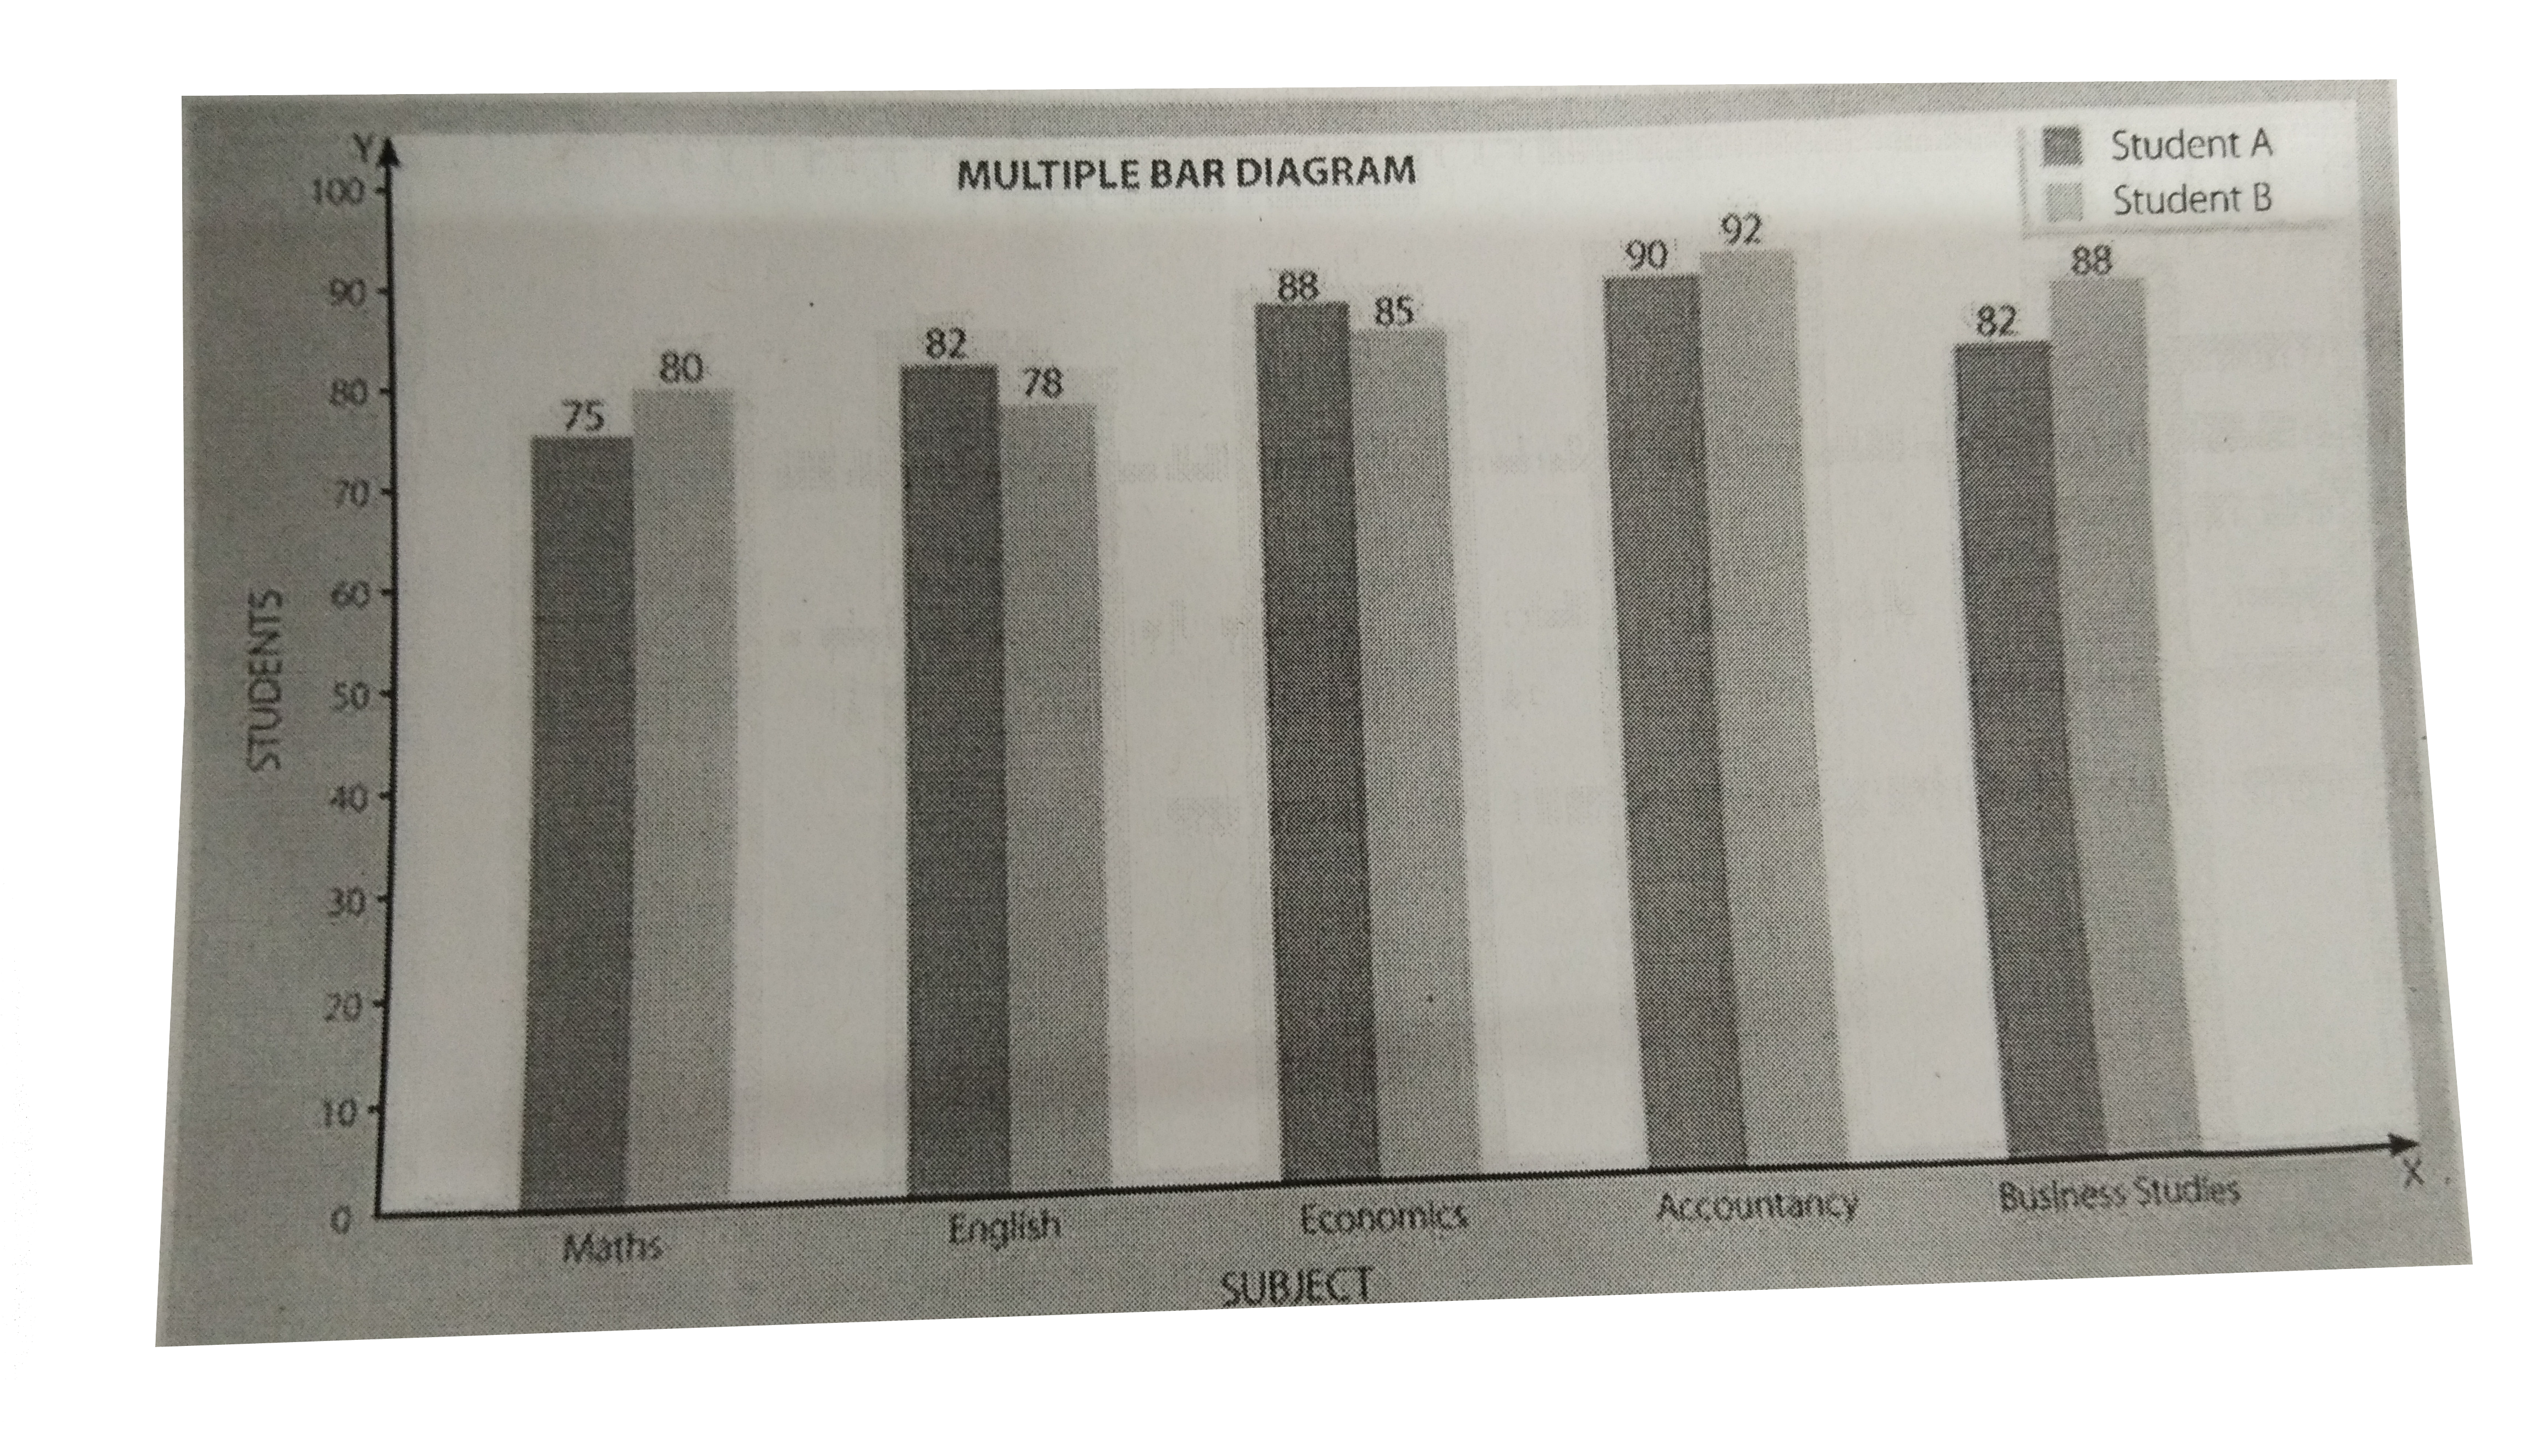
The following table gives the data on the marks obtained by two students 'A and B' in five subjects :

Represent the data by a multiple bar diagram.
Similar Questions
Following data gives the marks obtained by 100 students in a test. Find the median

View SolutionThe marks obtained by a student in an examination are given below :

Represent the data using a pie diagram.
View SolutionThe marks obtained by a student in an examination are given below:

Represent the data using pie diagram
View SolutionThe marks obtained by a student in an examination are given below:

Represent the data using pie diagram.
View SolutionReprent the following data by a deviation bar diagram :

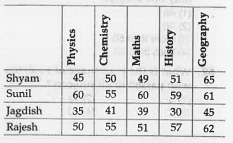
View SolutionThe folowing table represents in the marks of four students in five subjects.

Who has the highest average marks?
View SolutionThe marks obtained by 60 students of a class in a methematics test are given

Represent the above data by means of a histogram.
View SolutionThe following table represent marks obtained by 100 students in a test.

Find mean marks of the students.
View SolutionReprent the following data by a percentage bar diagram :

View SolutionThe marks obtained by a student in various subjects in an examination are given below.

Represent the data using pie diagram.
View Solution
