Define deviation bar diagram.
Text Solution
The correct Answer is:The deviation are used to compare the net deviation of related variables with respect to time and location. Bars representing positive and negative deviations are drawn above and below the base line.
The deviation are used to compare the net deviation of related variables with respect to time and location. Bars representing positive and negative deviations are drawn above and below the base line.
|
Similar Questions
Knowledge Check
18 Bar diagram is
AsingularBmultipleC(1) and (2) both,DNone of these.
Deifine percentage bar diagram.
View SolutionDraft a multiple bar diagram.
View SolutionDefine standard deviation.
View SolutionDefine quartile deviation.
View SolutionGeneral method of finding deviation by prism.

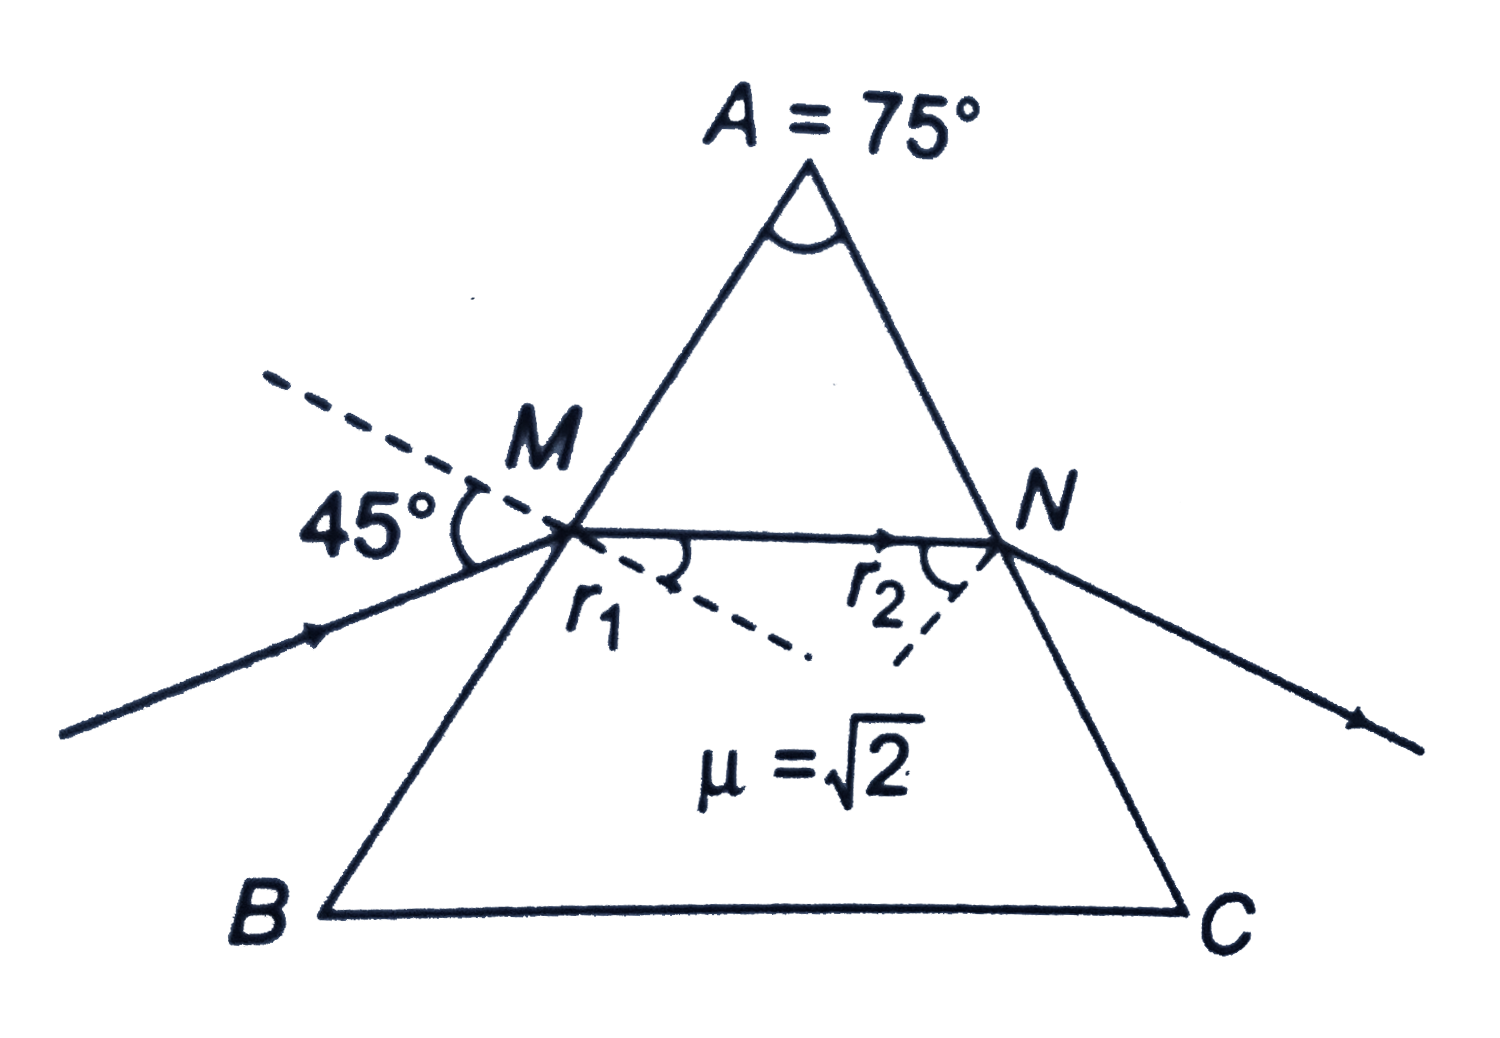
In the ray diagram shown in figure, find total deviation by prism.
View SolutionGeneral method of finding deviation by prism.

In the ray diagram shown in figure, find total deviation by prism.
View SolutionDefine ovulation. Draw a labelled diagram of mammalian ovum
View Solution

