Deifine percentage bar diagram.
Text Solution
The correct Answer is:Percentage bar diagrams are those diagrams which show simultaneously, different part of the values of a set of data in terms of percentages.
Percentage bar diagrams are those diagrams which show simultaneously, different part of the values of a set of data in terms of percentages.
|
Updated on:21/07/2023
Similar Questions
Knowledge Check
- Question 1 - Select One
18 Bar diagram is
AsingularBmultipleC(1) and (2) both,DNone of these. - Question 2 - Select One
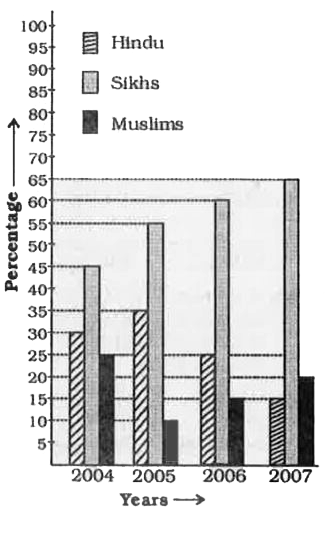
The following bar diagram shows the percentage of Hindus, Sikhs and Muslims in a state during the years from 2004 to 2007 . Examine the bar diagram and answer the following questions .

The ratio between the Hindus and Sikh populations in 2004 wasA3:5B1:2C2:3D3:4
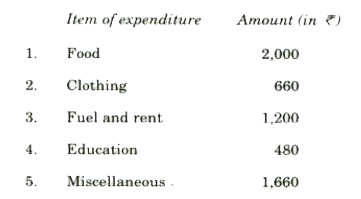
The monthly expenditure of a person is 6,000. The distribution of expenditure on various items is as follows :

If the above data is represented by a percentage bar diagram of height 15 cm, then what are the lengths of the two segments of the bar diagram corresponcling to education and miscellaneous respectively?View SolutionReprent the following data by a percentage bar diagram :
 View Solution
Deigrams which simultaneously presetn total values as well as part values of a set data are called……………… (percentage bar diagrams/sub-divided bar diagrams)
View SolutionDefine deviation bar diagram.
View SolutionDifferentiate between multiple bar diagram and compound bar diagram.
View SolutionDraft a multiple bar diagram.
View Solution


