State one limitation of graphic presentation of time series data.
Text Solution
Graphic presentation may be misused for false projection of the statistical facts, especially in case of advertisements.
|
Topper's Solved these Questions
- ARITHMETIC LINE-GRAPHS OR TIME SERIES GRAPHSBOOK - TARUN JAIN & VK OHRICHAPTER - ARITHMETIC LINE-GRAPHS OR TIME SERIES GRAPHSEXERCISE - Short Answer Type Questions
5 Videos
- ARITHMETIC LINE-GRAPHS OR TIME SERIES GRAPHSBOOK - TARUN JAIN & VK OHRICHAPTER - ARITHMETIC LINE-GRAPHS OR TIME SERIES GRAPHSEXERCISE - Long Answer Type Questions
3 Videos
- ARITHMETIC LINE-GRAPHS OR TIME SERIES GRAPHSBOOK - TARUN JAIN & VK OHRICHAPTER - ARITHMETIC LINE-GRAPHS OR TIME SERIES GRAPHSEXERCISE - C. True or False
2 Videos
- CENSUS AND SAMPLE METHODS OF COLLECTION OF DATABOOK - TARUN JAIN & VK OHRICHAPTER - CENSUS AND SAMPLE METHODS OF COLLECTION OF DATAEXERCISE - NCERT Question
9 Videos
Similar Questions
Knowledge Check
Which is graphical presentation?
AFolderBIconsCFileDtextThe simplest form of graphical presentation is
ASimple bar diagramBpie diagramCMultiple bar diagram,DRectangular diagram.......... is one of the methods of the graphic presentation of the frequency distribution.
ADiagramBHistogramCMonogramDHolographic design
Presentation of data
View SolutionPresentation of data.
View SolutionState one limitation of historical cost.
View SolutionState one limitation of sales promotion.
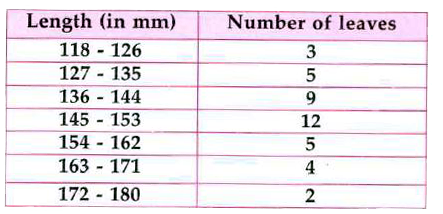
View SolutionThe length of 40 leaves of a plant are measured correct to one millimetre, and the obtained data is represented in the following table:

Is there any other suitable graphical representation for the same data?
View Solution
