What are time series graphs?
Or
What are arithmetic-line graphs ?
Text Solution
A graph showing arithmetic values of a variable (on a graph paper) is called arithmetic line-graph. Often such graphs are constructed to present time series data, that is, the data (like the value of exports or imports) corresponding to different weeks, months or years. Therefore, arithmetic line-graphs are often called 'time series graphs'.
|
Topper's Solved these Questions
- ARITHMETIC LINE-GRAPHS OR TIME SERIES GRAPHSBOOK - TARUN JAIN & VK OHRICHAPTER - ARITHMETIC LINE-GRAPHS OR TIME SERIES GRAPHSEXERCISE - Short Answer Type Questions
5 Videos
- ARITHMETIC LINE-GRAPHS OR TIME SERIES GRAPHSBOOK - TARUN JAIN & VK OHRICHAPTER - ARITHMETIC LINE-GRAPHS OR TIME SERIES GRAPHSEXERCISE - Long Answer Type Questions
3 Videos
- ARITHMETIC LINE-GRAPHS OR TIME SERIES GRAPHSBOOK - TARUN JAIN & VK OHRICHAPTER - ARITHMETIC LINE-GRAPHS OR TIME SERIES GRAPHSEXERCISE - C. True or False
2 Videos
- CENSUS AND SAMPLE METHODS OF COLLECTION OF DATABOOK - TARUN JAIN & VK OHRICHAPTER - CENSUS AND SAMPLE METHODS OF COLLECTION OF DATAEXERCISE - NCERT Question
9 Videos
Similar Questions
Knowledge Check
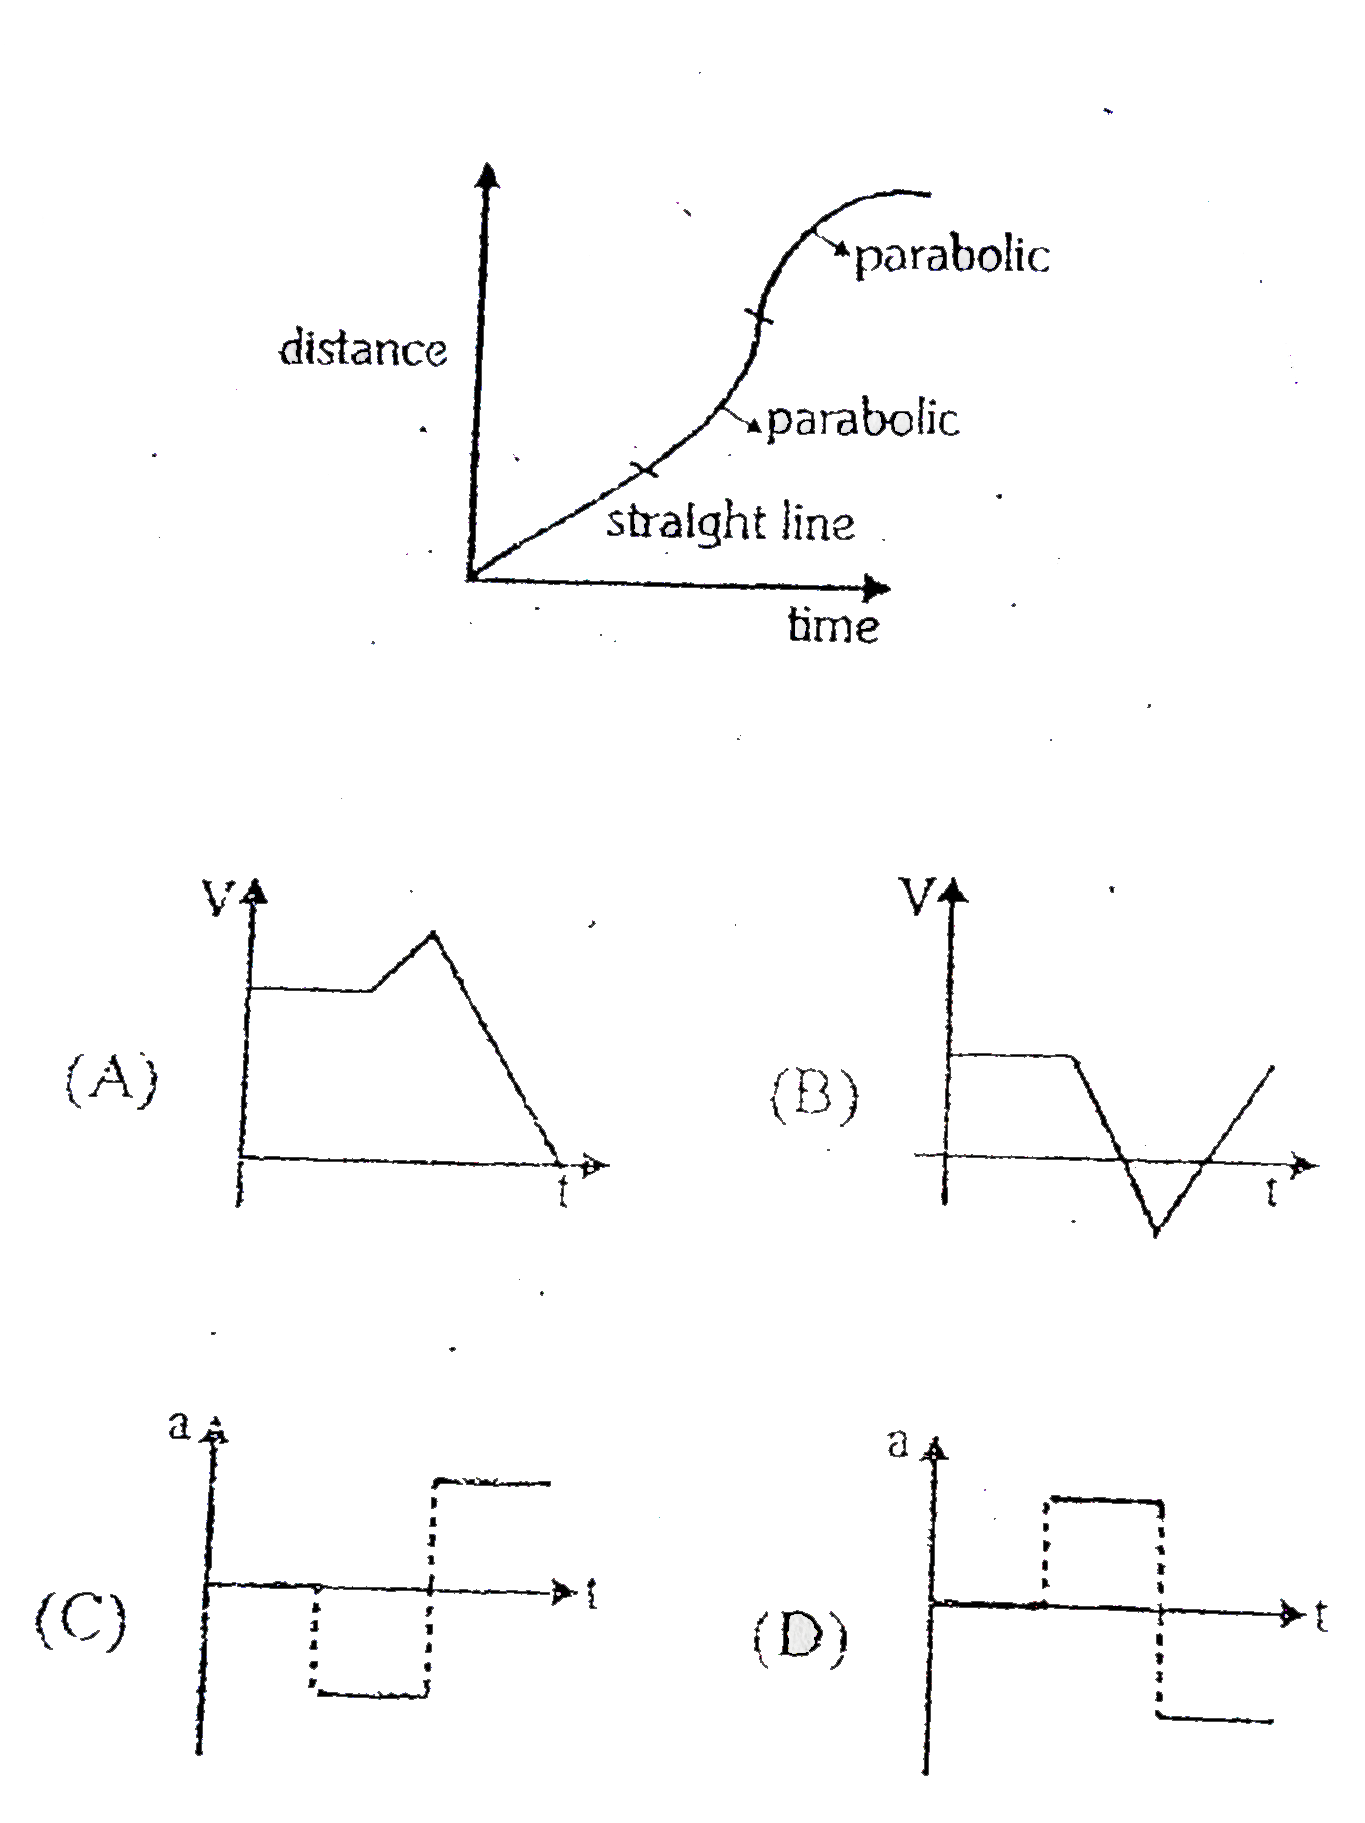
What is/are the possible graph / graphs, if particle moves in a straight line path according to the give distance−time graph?
 A(A) & (C)B(A) & (D)COnly (A)DOnly (C)
How many types are there of time series graphs?
View SolutionWhat is a line graph? For which type of data are they used?
View SolutionWhat does the slope of a work-time graph represent?
View SolutionWhat does the slope of a work-time graph represent?
View SolutionWhat can you say about the motion of a body if :
(a) its displacement-time graph is a straight line ?
(b) its velocity-time graph is a straight line ?
View SolutionWhat can you say about the motion of an object whose distance-time graph is a straight line parallel to the time axis ?
View SolutionWhat can you say about the motion of an object whose distance-time graph is a straight line parallel to the time axis ?
View Solution
