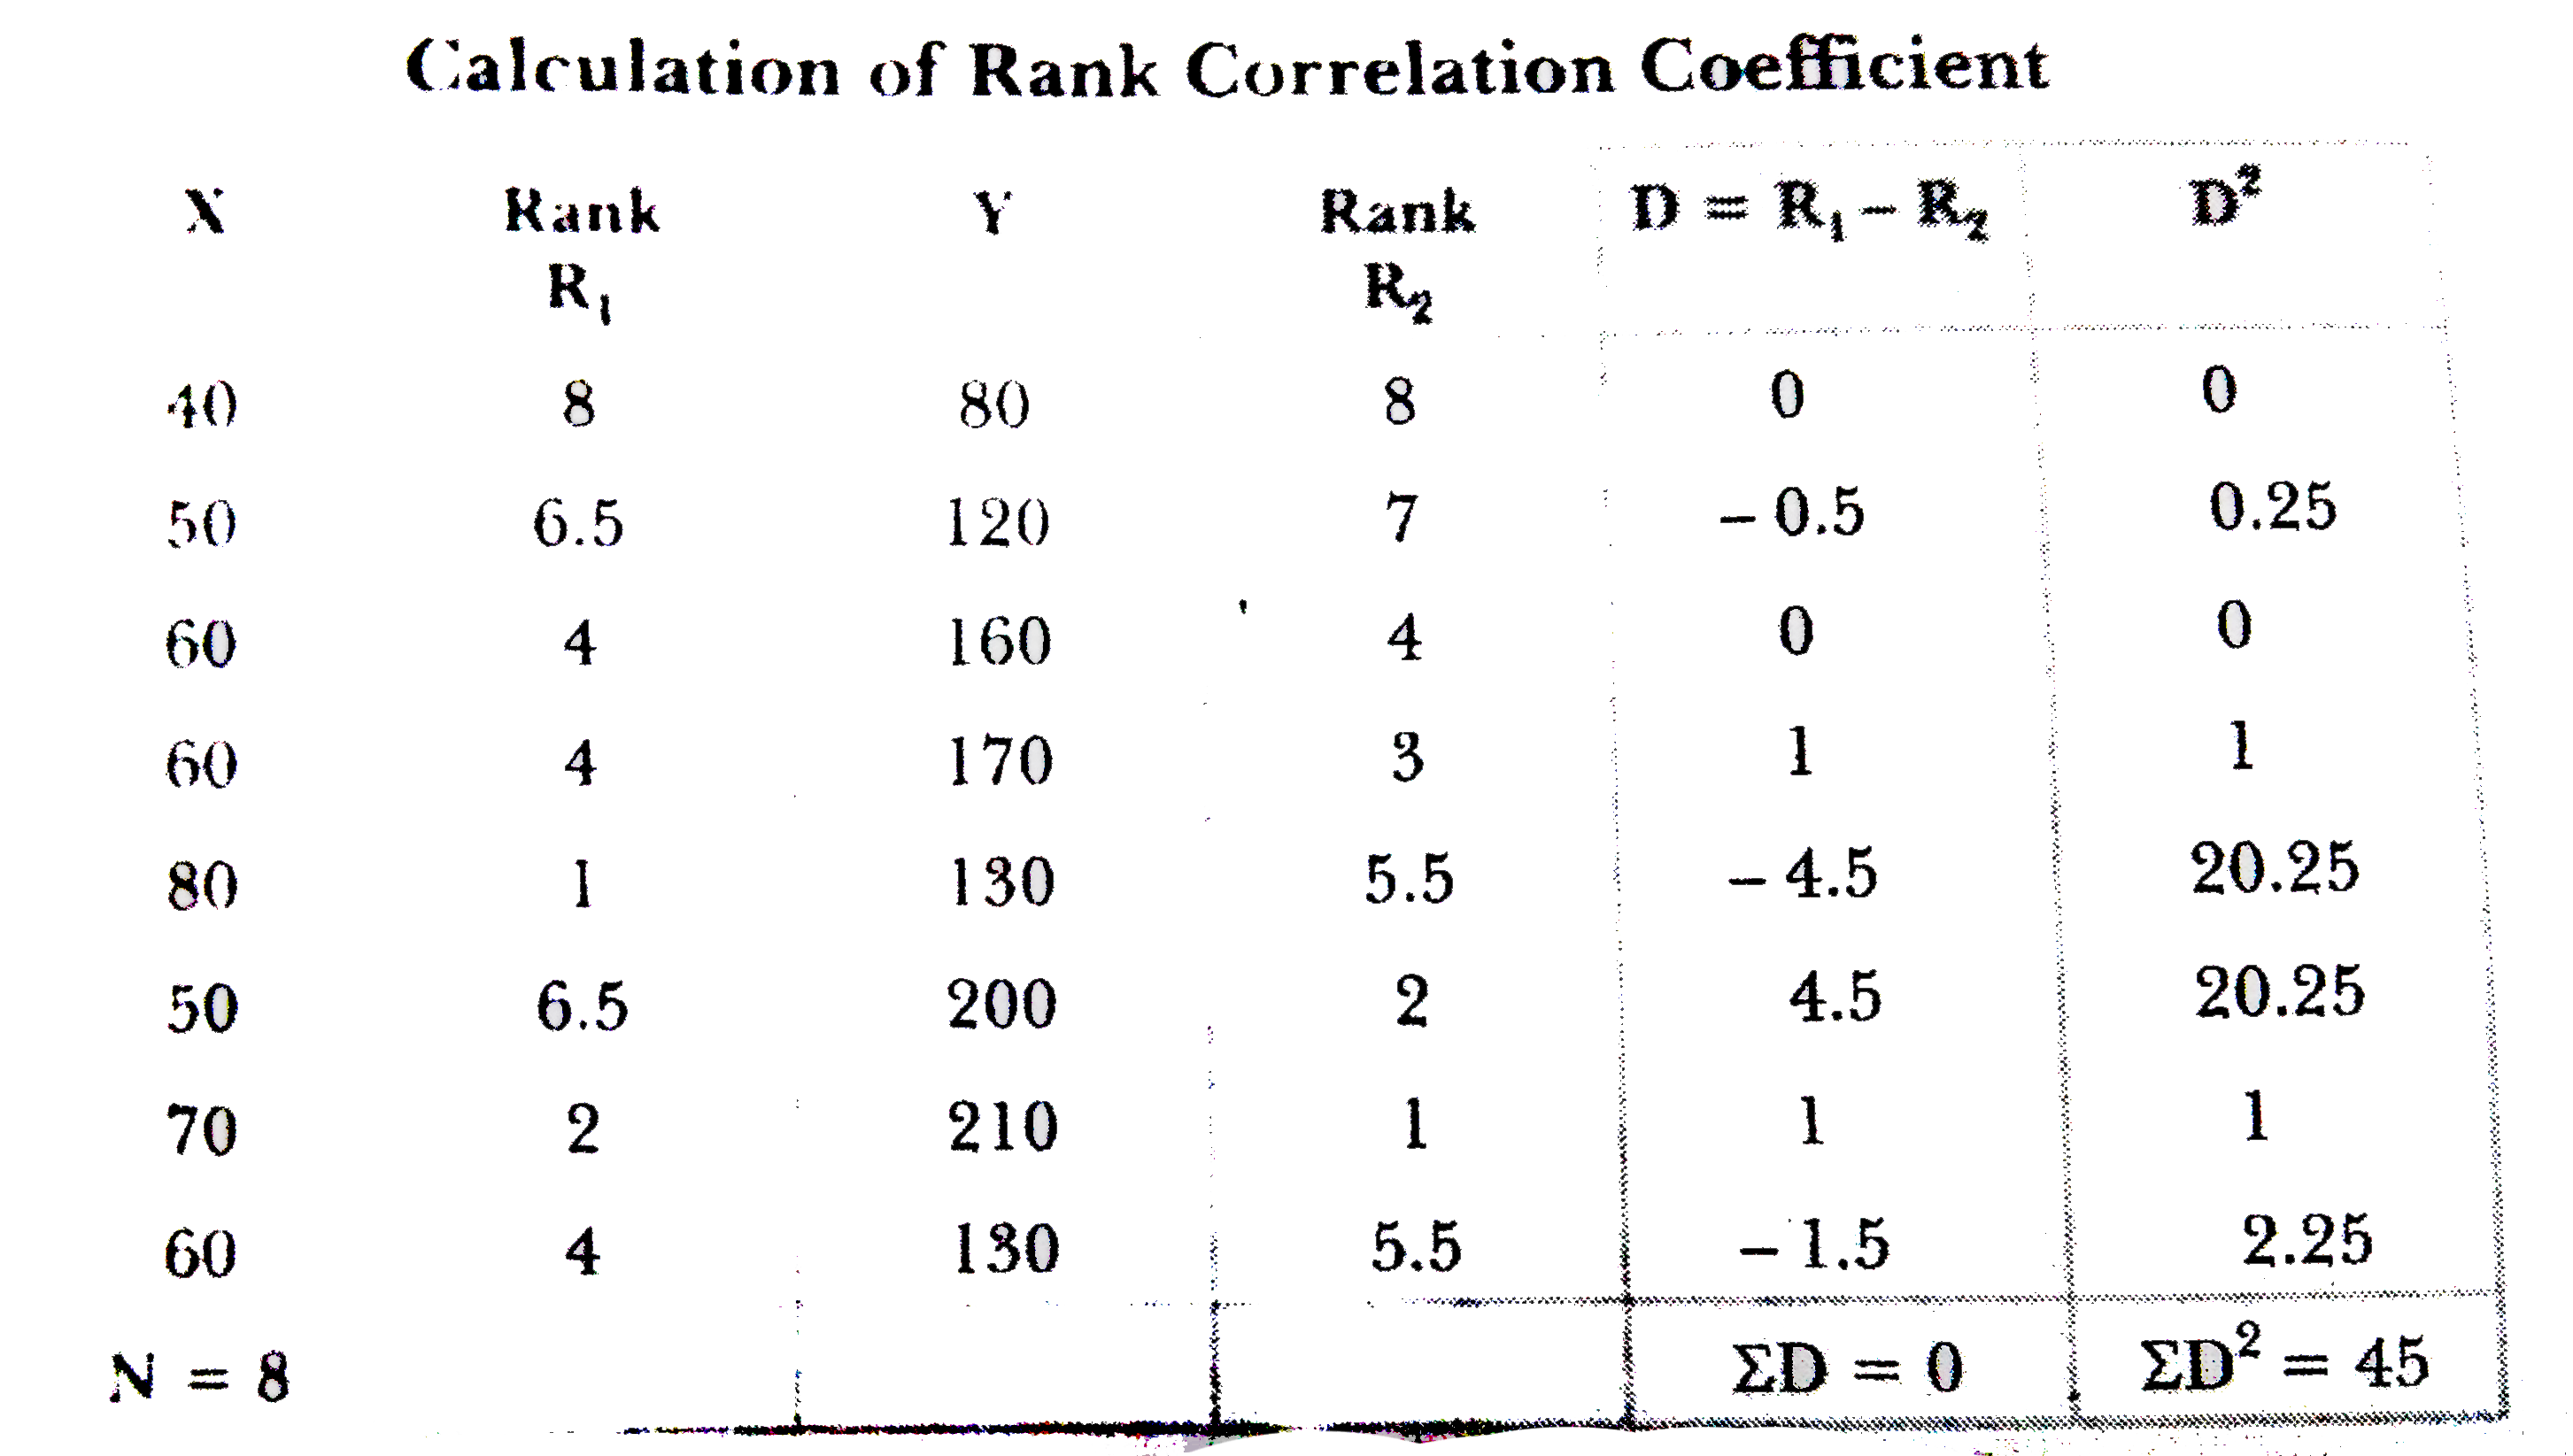
Calculate coefficient of correlation by means of ranking method from the following data :


In this question in X series, the values 60 and 50 are repeated thrice and twice. The averages rank for the value 60 is 4(3+4+5÷3) while for the value 50 it is 6.5 (6+7÷2). In both the cases, the correlation factor will be 112(33−3) and 112(23−2) respectively . In series Y, the 130 is repeated twice. The average rank for the value 130 is 5.5 (5+6÷2). In this case, correlation factor will be 112(23−2).
rk=1−6[∑D2+112(m31−m1)+112(m32−m2)+112(m33−m3)]N3−N
Here, ∑D2=45,m1=3,m2=2,m3=2N=8
By substituting values in the above formula, we get
rk=1−6[45+112(33−3)+112(23−2)+112(23−2)](8)3−8
=1−6[45+112(24)+112(6)+112(6)]512−8
=1−6(45+2+12+12)504=1−6(48)504=1−288504=1−0.571=0.429
Coefficient of Rank Correlation (rk)=0.429
Topper's Solved these Questions
- BOOK - TARUN JAIN & VK OHRICHAPTER - CORRELATIONEXERCISE - Learning by doing5videos
CORRELATION
- BOOK - TARUN JAIN & VK OHRICHAPTER - CORRELATIONEXERCISE - Objective type questions9videos
CORRELATION
- BOOK - TARUN JAIN & VK OHRICHAPTER - CONCEPT OF ECONOMICS AND SIGNIFICANCE OF STATISTICS IN ECONOMICSEXERCISE - NCERT Questions6videos
CONCEPT OF ECONOMICS AND SIGNIFICANCE OF STATISTICS IN ECONOMICS
- BOOK - TARUN JAIN & VK OHRICHAPTER - DIAGRAMMATIC PRESENTATION OF DATA BAR DIAGRAMS AND PIE DIAGRAMSEXERCISE - NCERT Question (With Hints to Answers)3videos
DIAGRAMMATIC PRESENTATION OF DATA BAR DIAGRAMS AND PIE DIAGRAMS
Similar Questions
Calculate the coefficient of rank correlation.
 View Solution
Calculate coefficient of correlation between series A and B.
 View Solution
Calculate coefficient of correlation between series X and Y.
 View Solution
Calculate coefficient of correlation from the following data:
 View Solution
Calculate cofficient of correlation of the following data :
 View Solution
Calculate coefficient of correlation, given the following data :
 View Solution
Calculate the coefficient of correlation between the two series :
 View Solution
Calculate Karl Pearson's coefficient of correlation between the values of X and Y for the following data:

Assume 69 and 112 as the mean values for X and Y respectively.View SolutionEstimate the coefficient of mean deviation from the median from the following data:
 View Solution
Calculate coefficient of variation of the following data:
 View Solution

