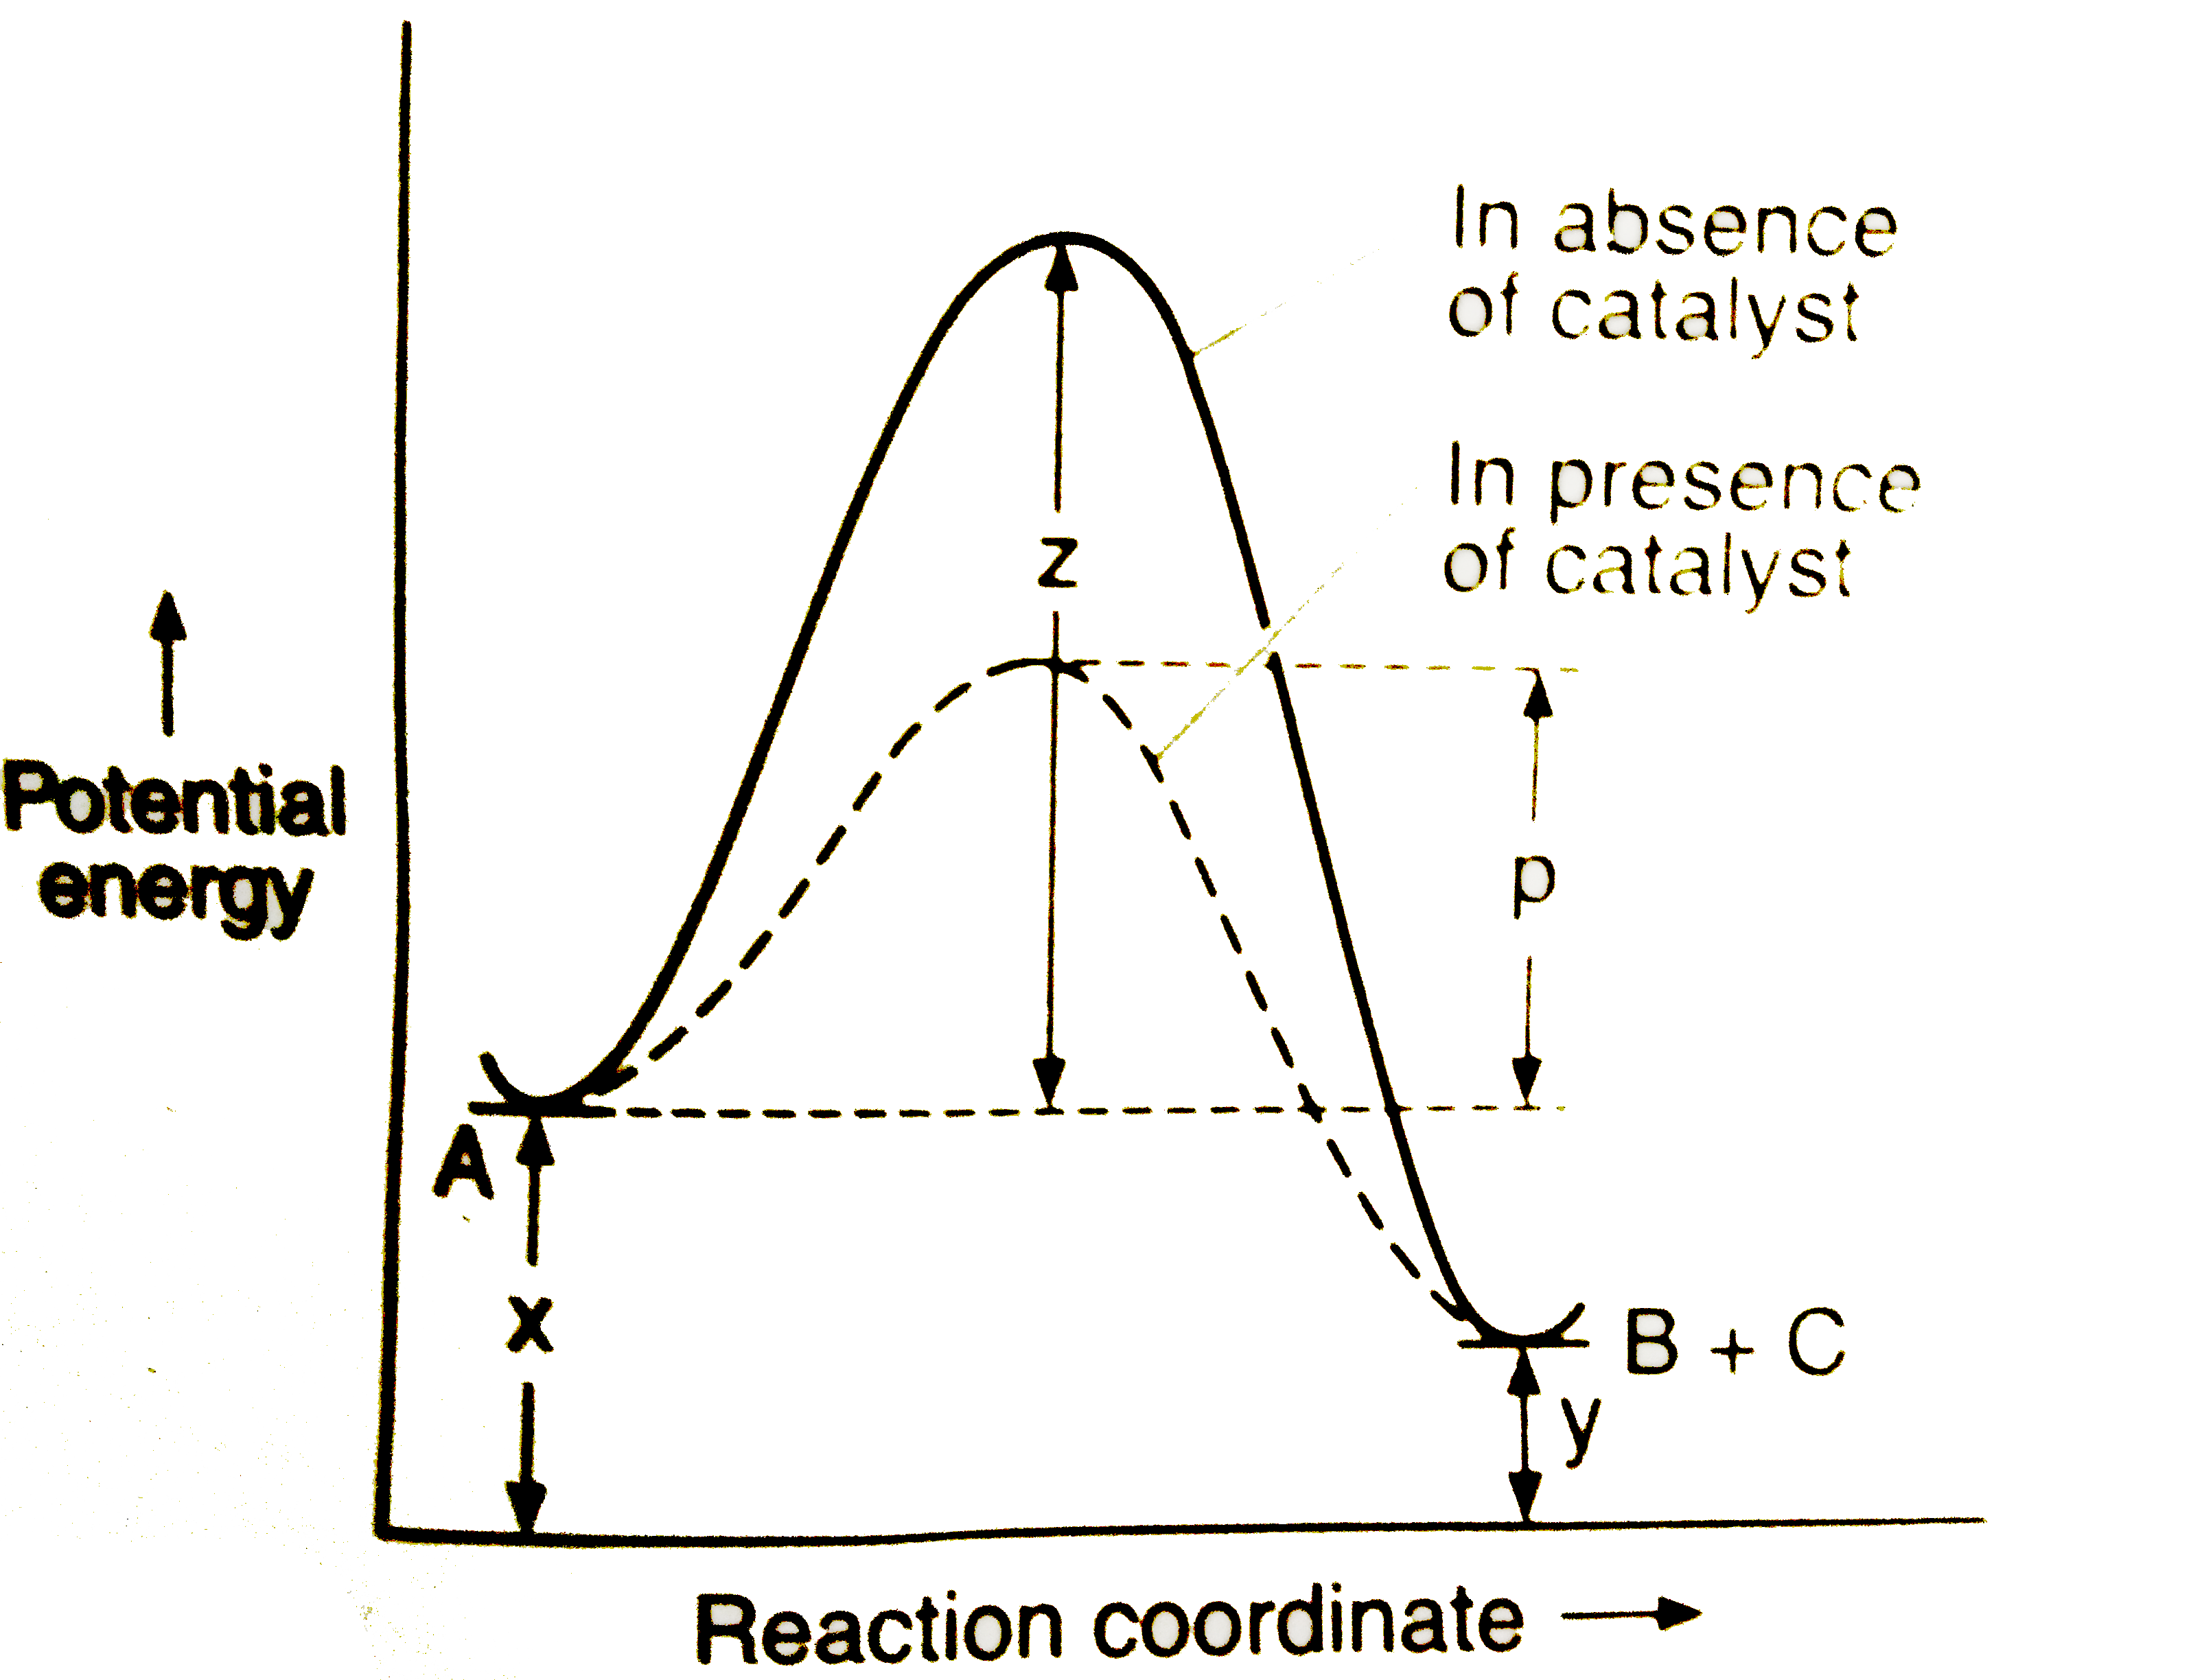
For the reaction (A→B+C), the energy profile diagram is given in the figure .

z
z - p
y - z
z - x
The correct Answer is:B
Topper's Solved these Questions
- ADSORPTION AND CATALYSISBOOK - OP TANDONCHAPTER - ADSORPTION AND CATALYSISEXERCISE - Assertion -Reason TYPE QUESTIONS
19 Videos
- ADSORPTION AND CATALYSISBOOK - OP TANDONCHAPTER - ADSORPTION AND CATALYSISEXERCISE - Matrix Matching Type Questions
7 Videos
- ADSORPTION AND CATALYSISBOOK - OP TANDONCHAPTER - ADSORPTION AND CATALYSISEXERCISE - OBJECTIVE QUESTIONS (LEVEL-A)
119 Videos
- AROMATIC HYDROCARBONS (ARENES)BOOK - OP TANDONCHAPTER - AROMATIC HYDROCARBONS (ARENES)EXERCISE - EXAMPLES
24 Videos
Similar Questions
Substances which alter the velocity of a reaction by mere presence, without undergoing any change in mass and compossition are termed catalyst and the phenomenon is known as catalysis
For the reaction (A→B+C) , the energy profile diagram is given in the figure below.

The decrease in the energy of activation in the presence of catalyst is
View SolutionDraw energy profile diagrams for exothermic and endothermic reactions.
View Solution
Knowledge Check
Substances which alter the velocity of a reaction by mere presence, without undergoing any change in mass and compossition are termed catalyst and the phenomenon is known as catalysis
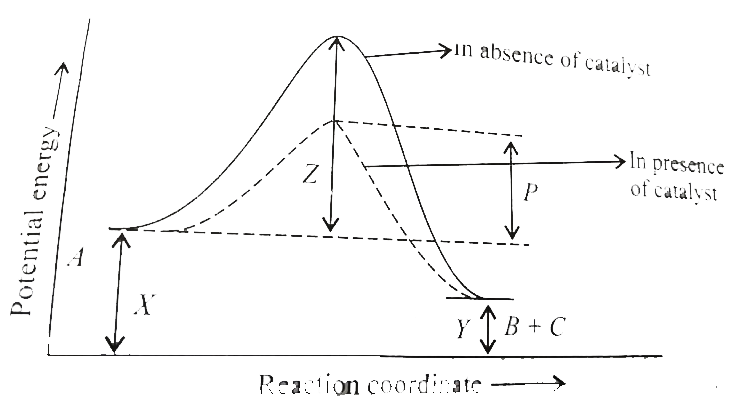
For the reaction (A→B+C) , the energy profile diagram is given in the figure below.

The decrease in ht eenergy of activation in hte presence of catalyst isAZBZ−PCY−ZDZ−XFor the energy profile diagram

Heat of reaction will beA100 kJ/moleB-100 kJ/moleC50 kJ/moleD-50 kJ/moleFor the energy profile diagram

Threshold energy will beA20 kJ/moleB60 kJ/moleC70 kJ/moleD30 kJ/mole
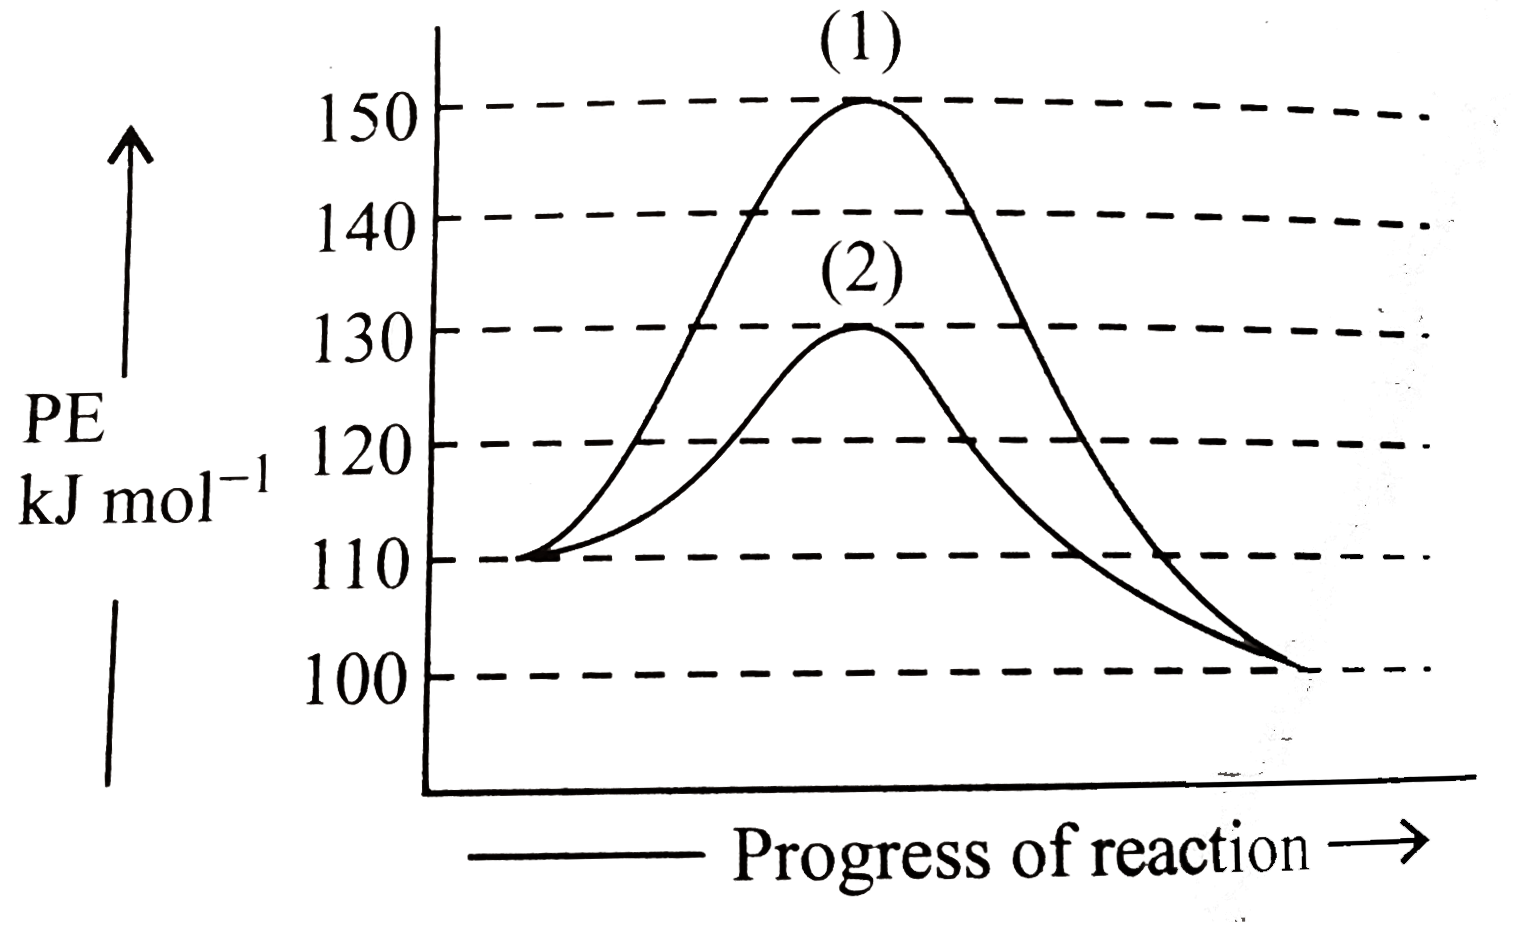
Given the following graph.
(a) Calculate ΔH for the reaction and energy of activation for the forward and backward reaction.

(b) Curve (2) is the energy profile in the presence of a catalyst. What is the energy of activation for the two reaction in the presence of a catalyst?
( c) Will the catalyst change the extent of the reaction?
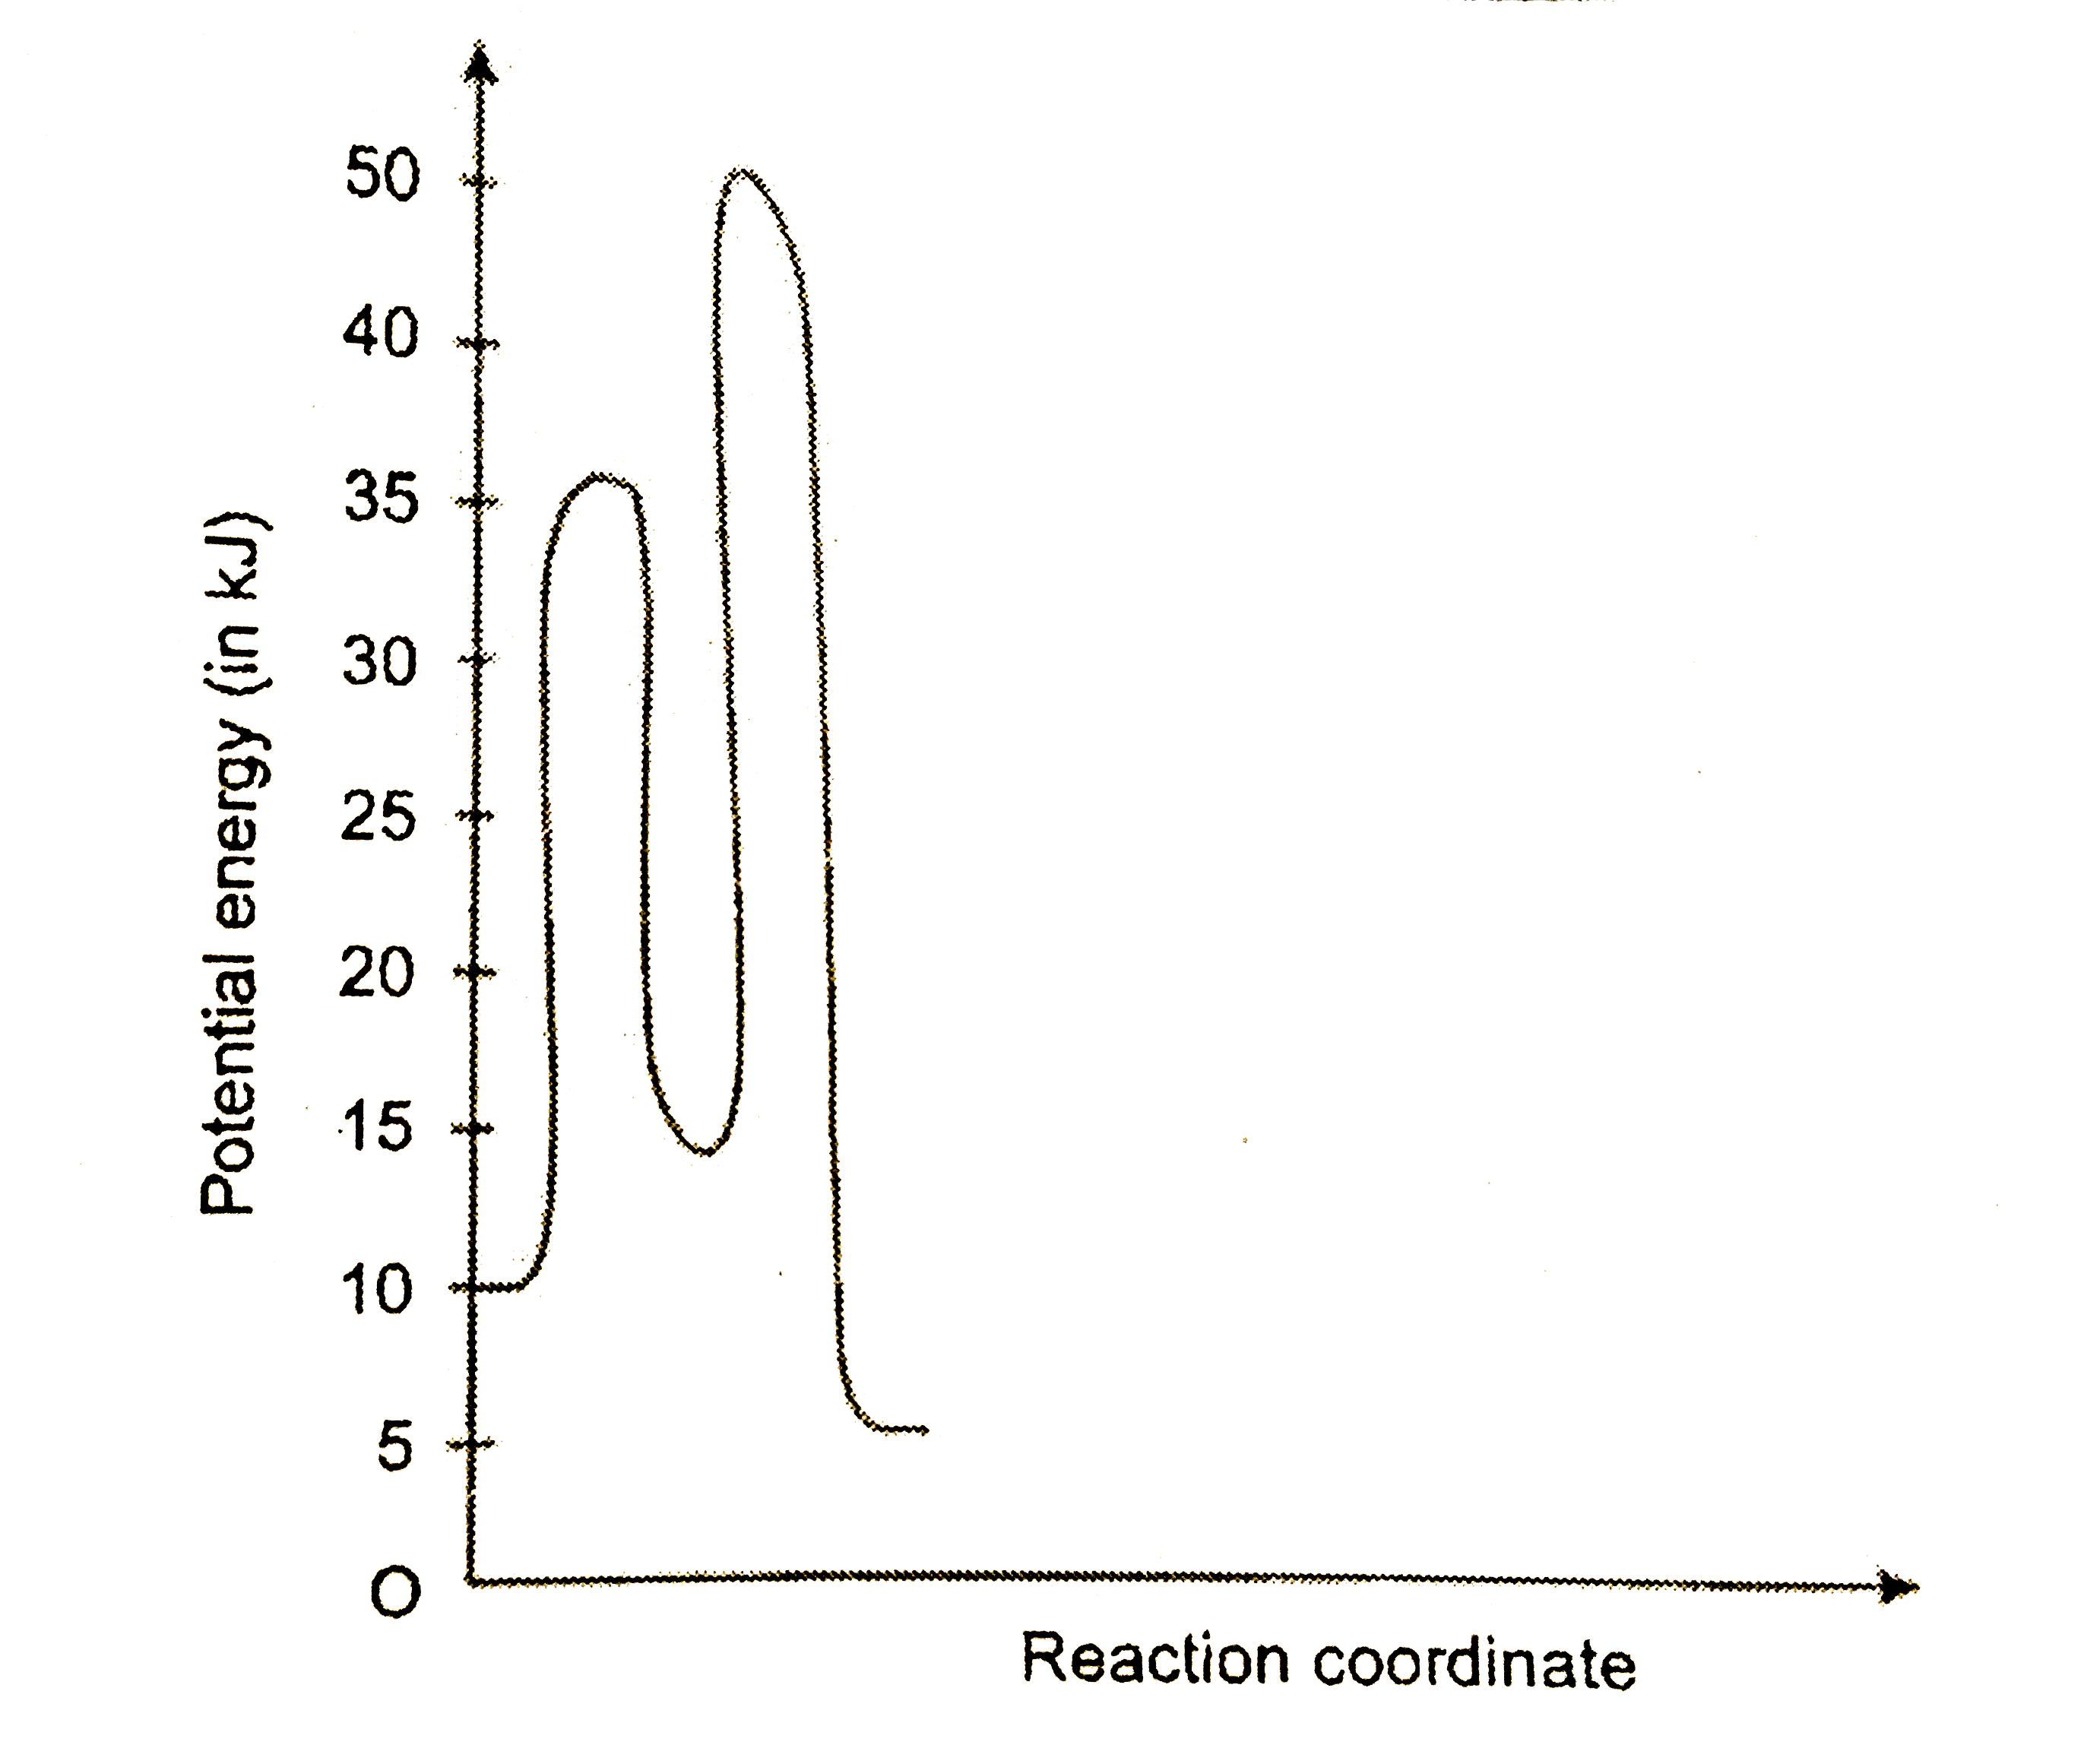
View SolutionThe following diagram represents the energy profile diagram for a two-step reaction. Calculate the ratio of change in heat energy involved in step I to step II.

View SolutionWhich one is the correct energy profile for

View SolutionWhich energy diagram best reprsents the given reaction ?

View SolutionWhich energy diagram best represents the given reaction ?

View Solution
