Following graphs will be true when :
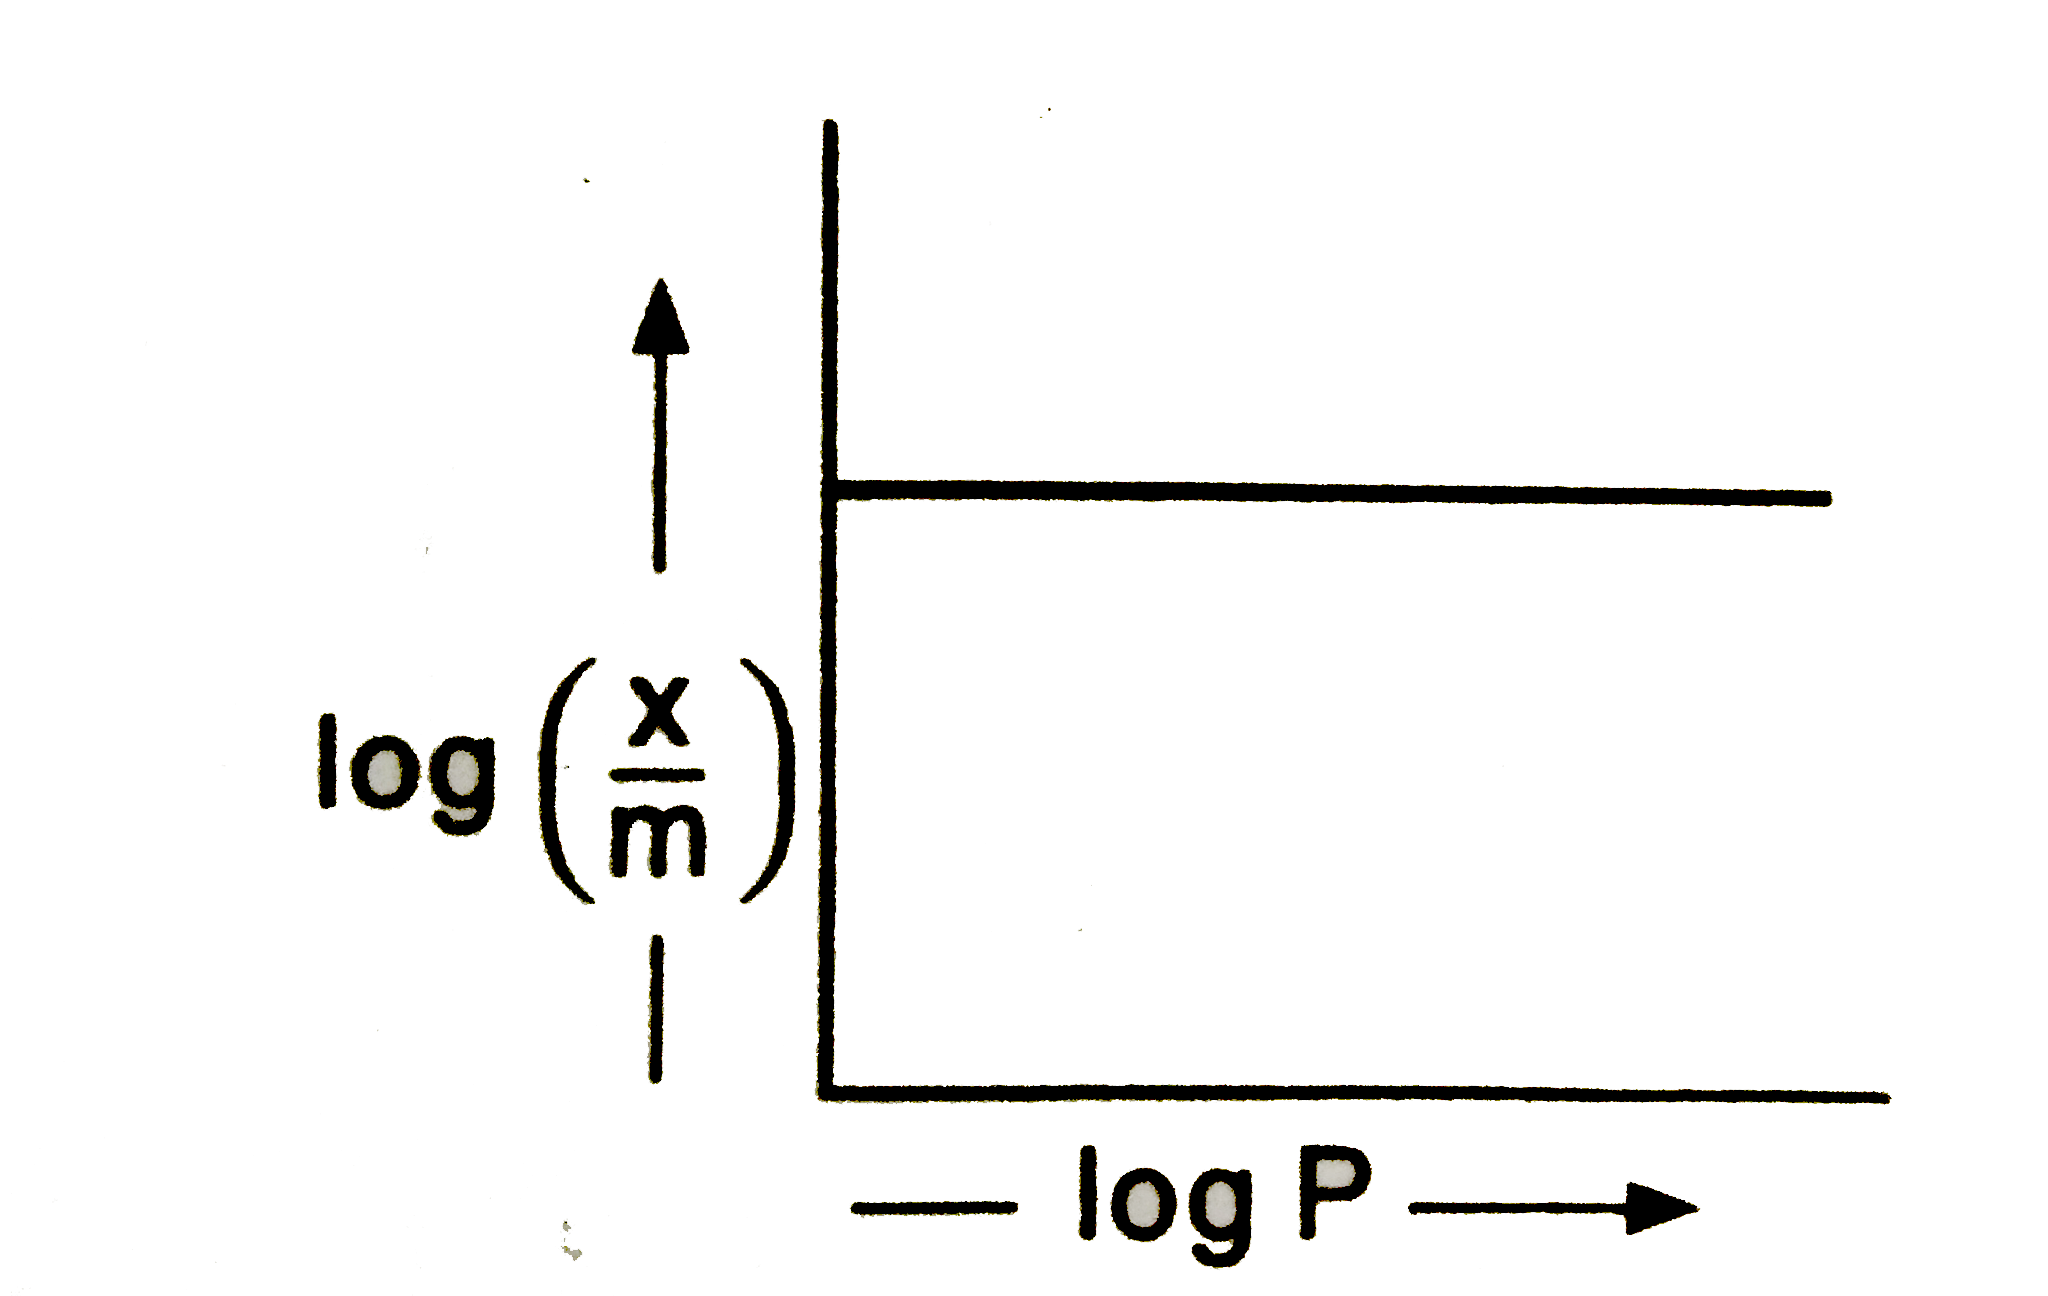
P = 0
P = 1
The correct Answer is:C
Adsorption is exothermic process, hence it is accompanied by decrease in enthalpy.
Topper's Solved these Questions
- ADSORPTION AND CATALYSISBOOK - OP TANDONCHAPTER - ADSORPTION AND CATALYSISEXERCISE - Assertion -Reason TYPE QUESTIONS
19 Videos
- ADSORPTION AND CATALYSISBOOK - OP TANDONCHAPTER - ADSORPTION AND CATALYSISEXERCISE - Matrix Matching Type Questions
7 Videos
- ADSORPTION AND CATALYSISBOOK - OP TANDONCHAPTER - ADSORPTION AND CATALYSISEXERCISE - OBJECTIVE QUESTIONS (LEVEL-A)
119 Videos
- AROMATIC HYDROCARBONS (ARENES)BOOK - OP TANDONCHAPTER - AROMATIC HYDROCARBONS (ARENES)EXERCISE - EXAMPLES
24 Videos
Similar Questions
Following graphs are obtained when different gases are subjected to change in pressure at constant temperature. Identify the option which has correctly matched gas wth the graph.
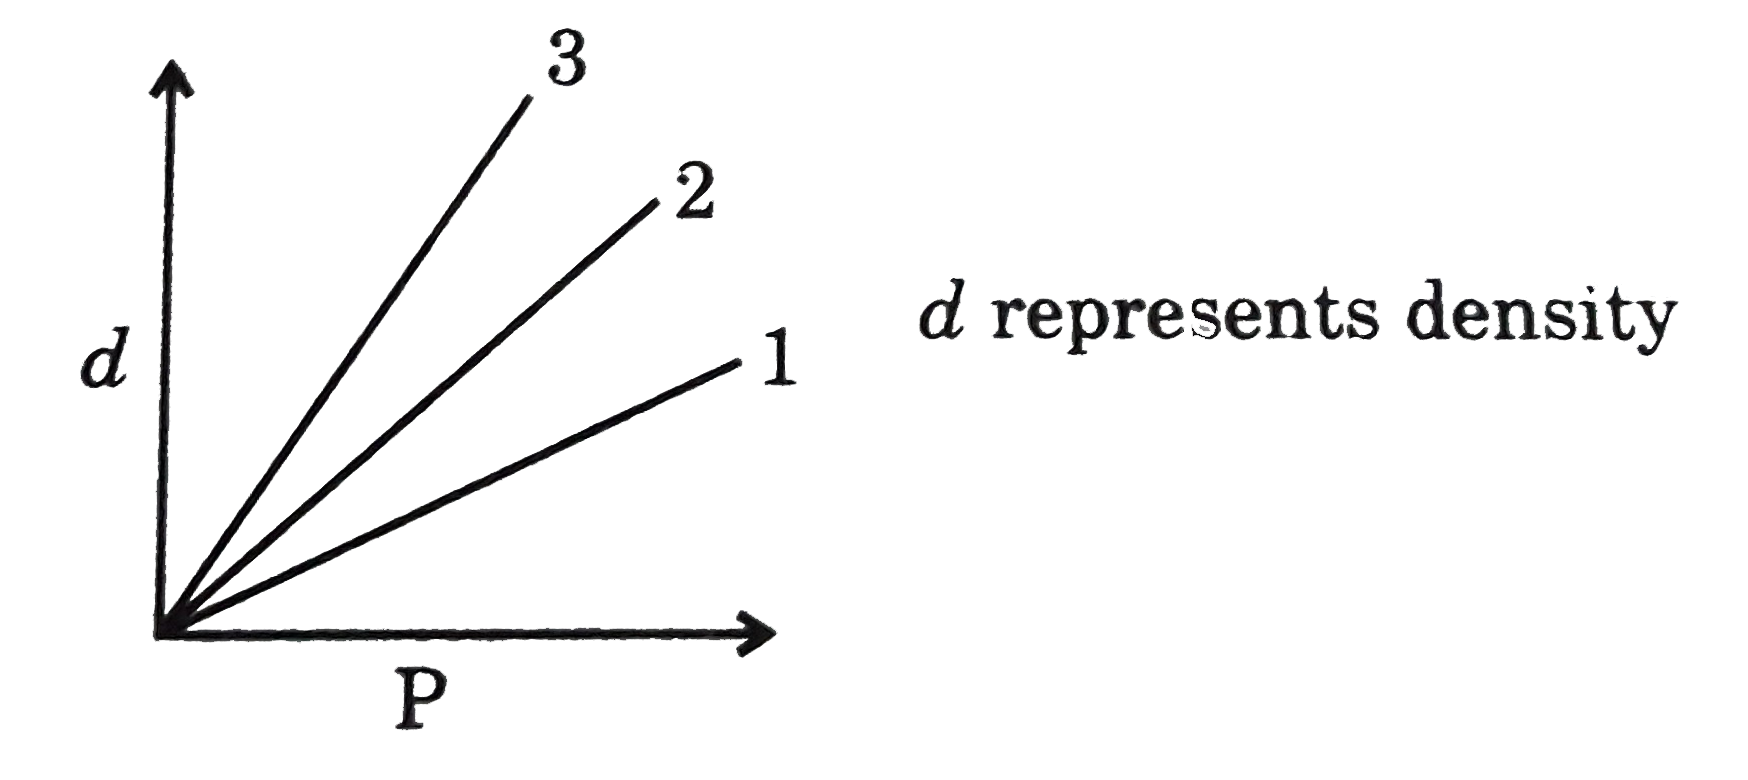
View SolutionFollowing graphs are obtained when different gases are subjected to change in pressure at constant temperature.
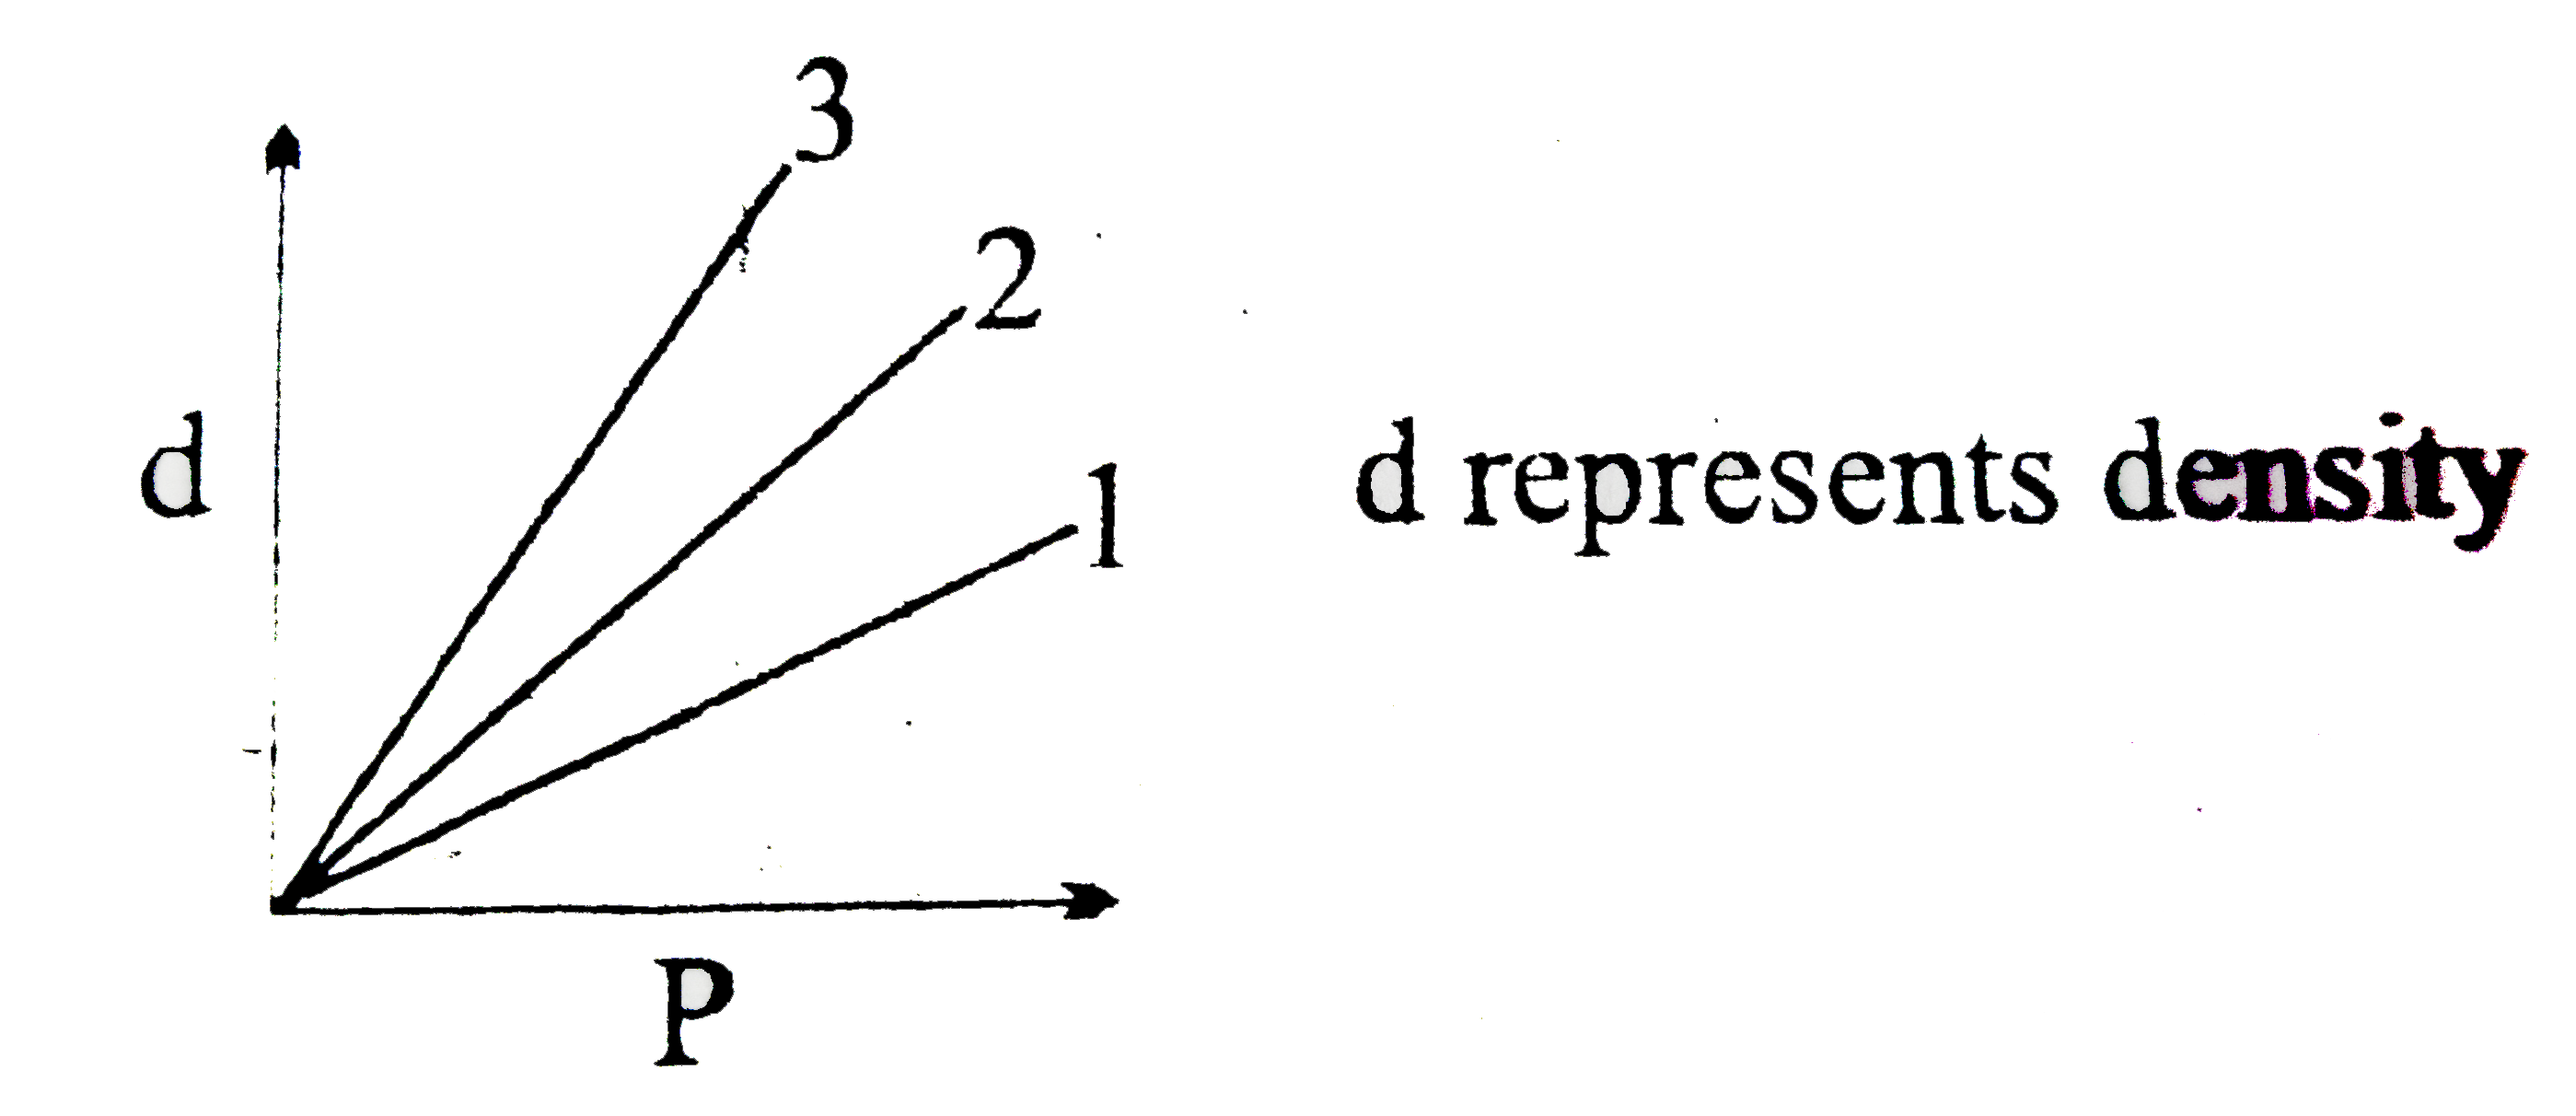
Identify the option which has correctly matched gas with the graph.
View Solution
Knowledge Check
Following graph will be true when
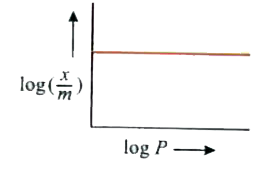 AP=0BP-1C1n=0D1n=∞
For a first order reaction: A3→3A, Following graph is observed when concentration vs. time graph is plotted. Identify the option which is correct.
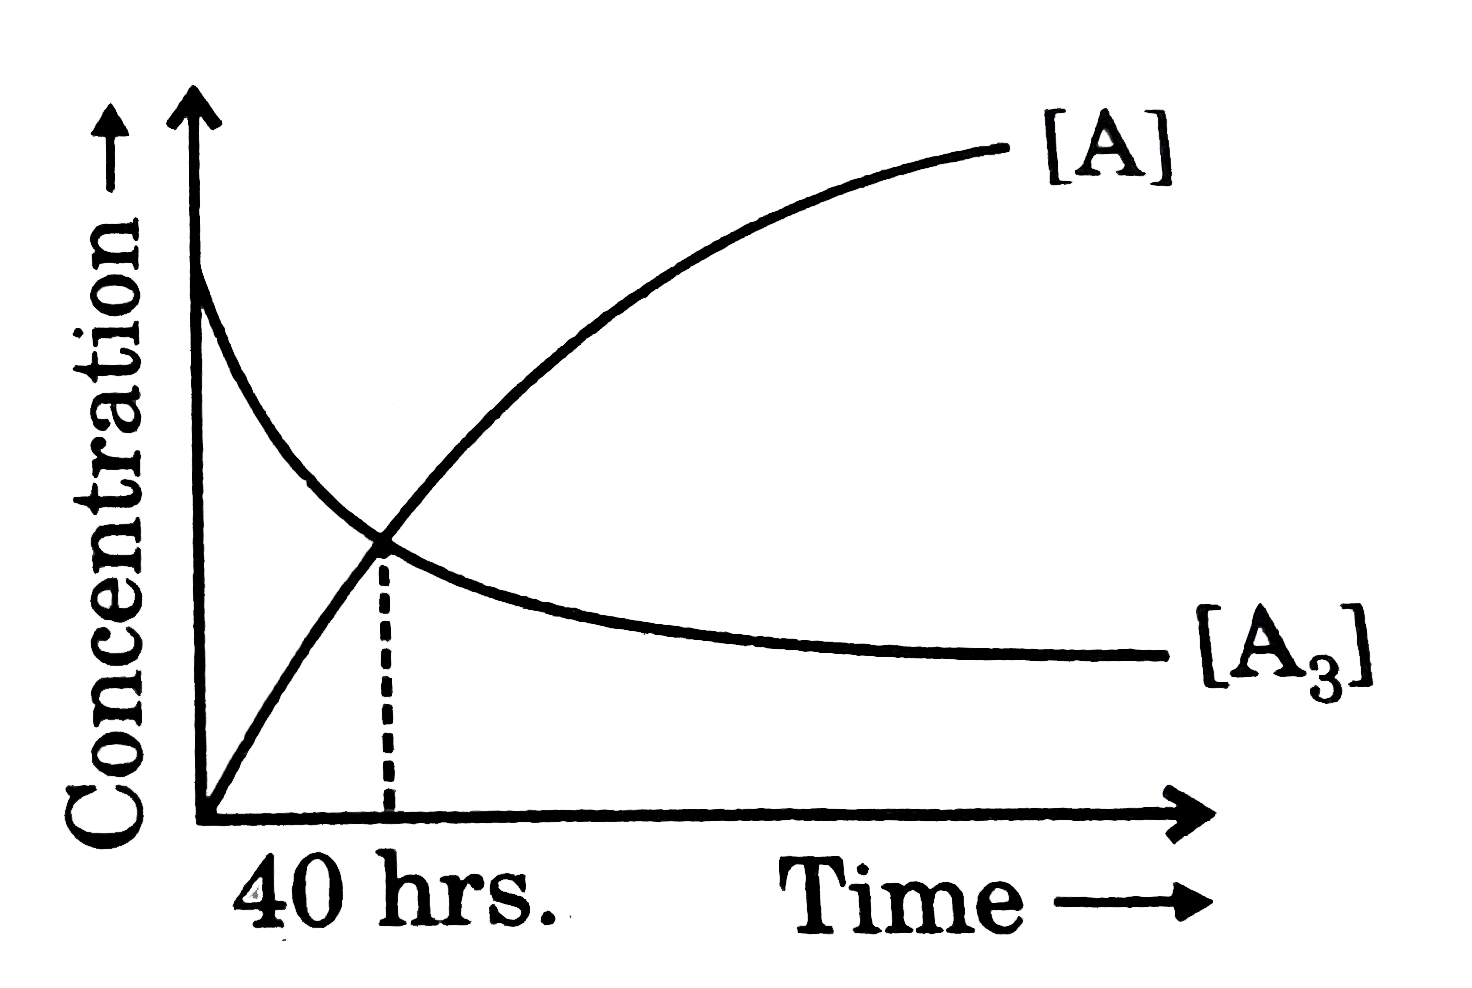 AHalf life of the reaction will be 20 hrsBThe coordinates of the point of interaction will remain same even if initial concentration is changed.CConcentration of A will be 3 times that of A3 in 20 min.DIf the reaction occurs in a rigid container at constant temperature pressure will decrease.
p∧q is true when :
Ap and q are both trueBp and q are both falseCp is true and q is falseDp is false and q is true
Which of the following graphs is true for the motion of a satellite revolving round the Earth. ('T" is the time period of a satellite and 'r' is the distance of the satellite from the Earth).
View SolutionFor the two reactions I:→BIII:→B,II:C→D following graph is obtained.
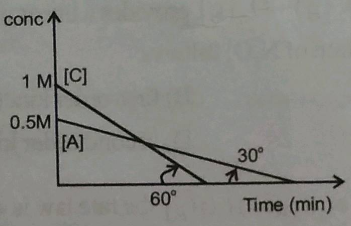
Which of the following is true:
View SolutionWhich of the following is true, when the cells are connected in series?
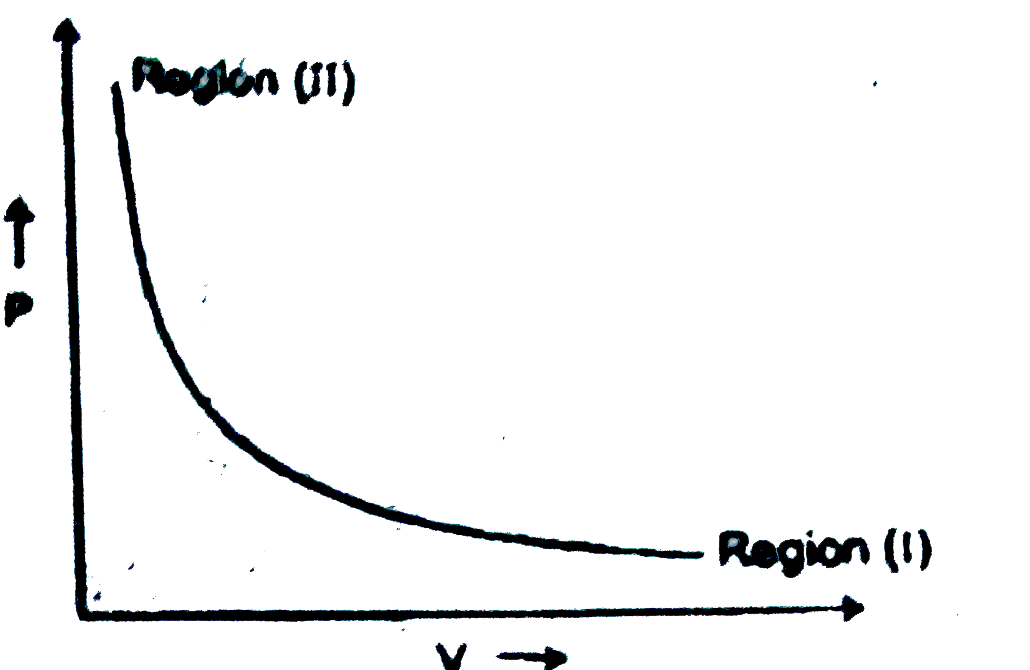
View SolutionFollowing graph represents a pressure (P) volume (V) relationship at a fixed temperature (T) for n moles of a real gas. The graph has two regions marked (I) and (II). Which of the following options is true.
View Solutionwhich of the following will give a true solution when dissolved in water ?
View Solution
