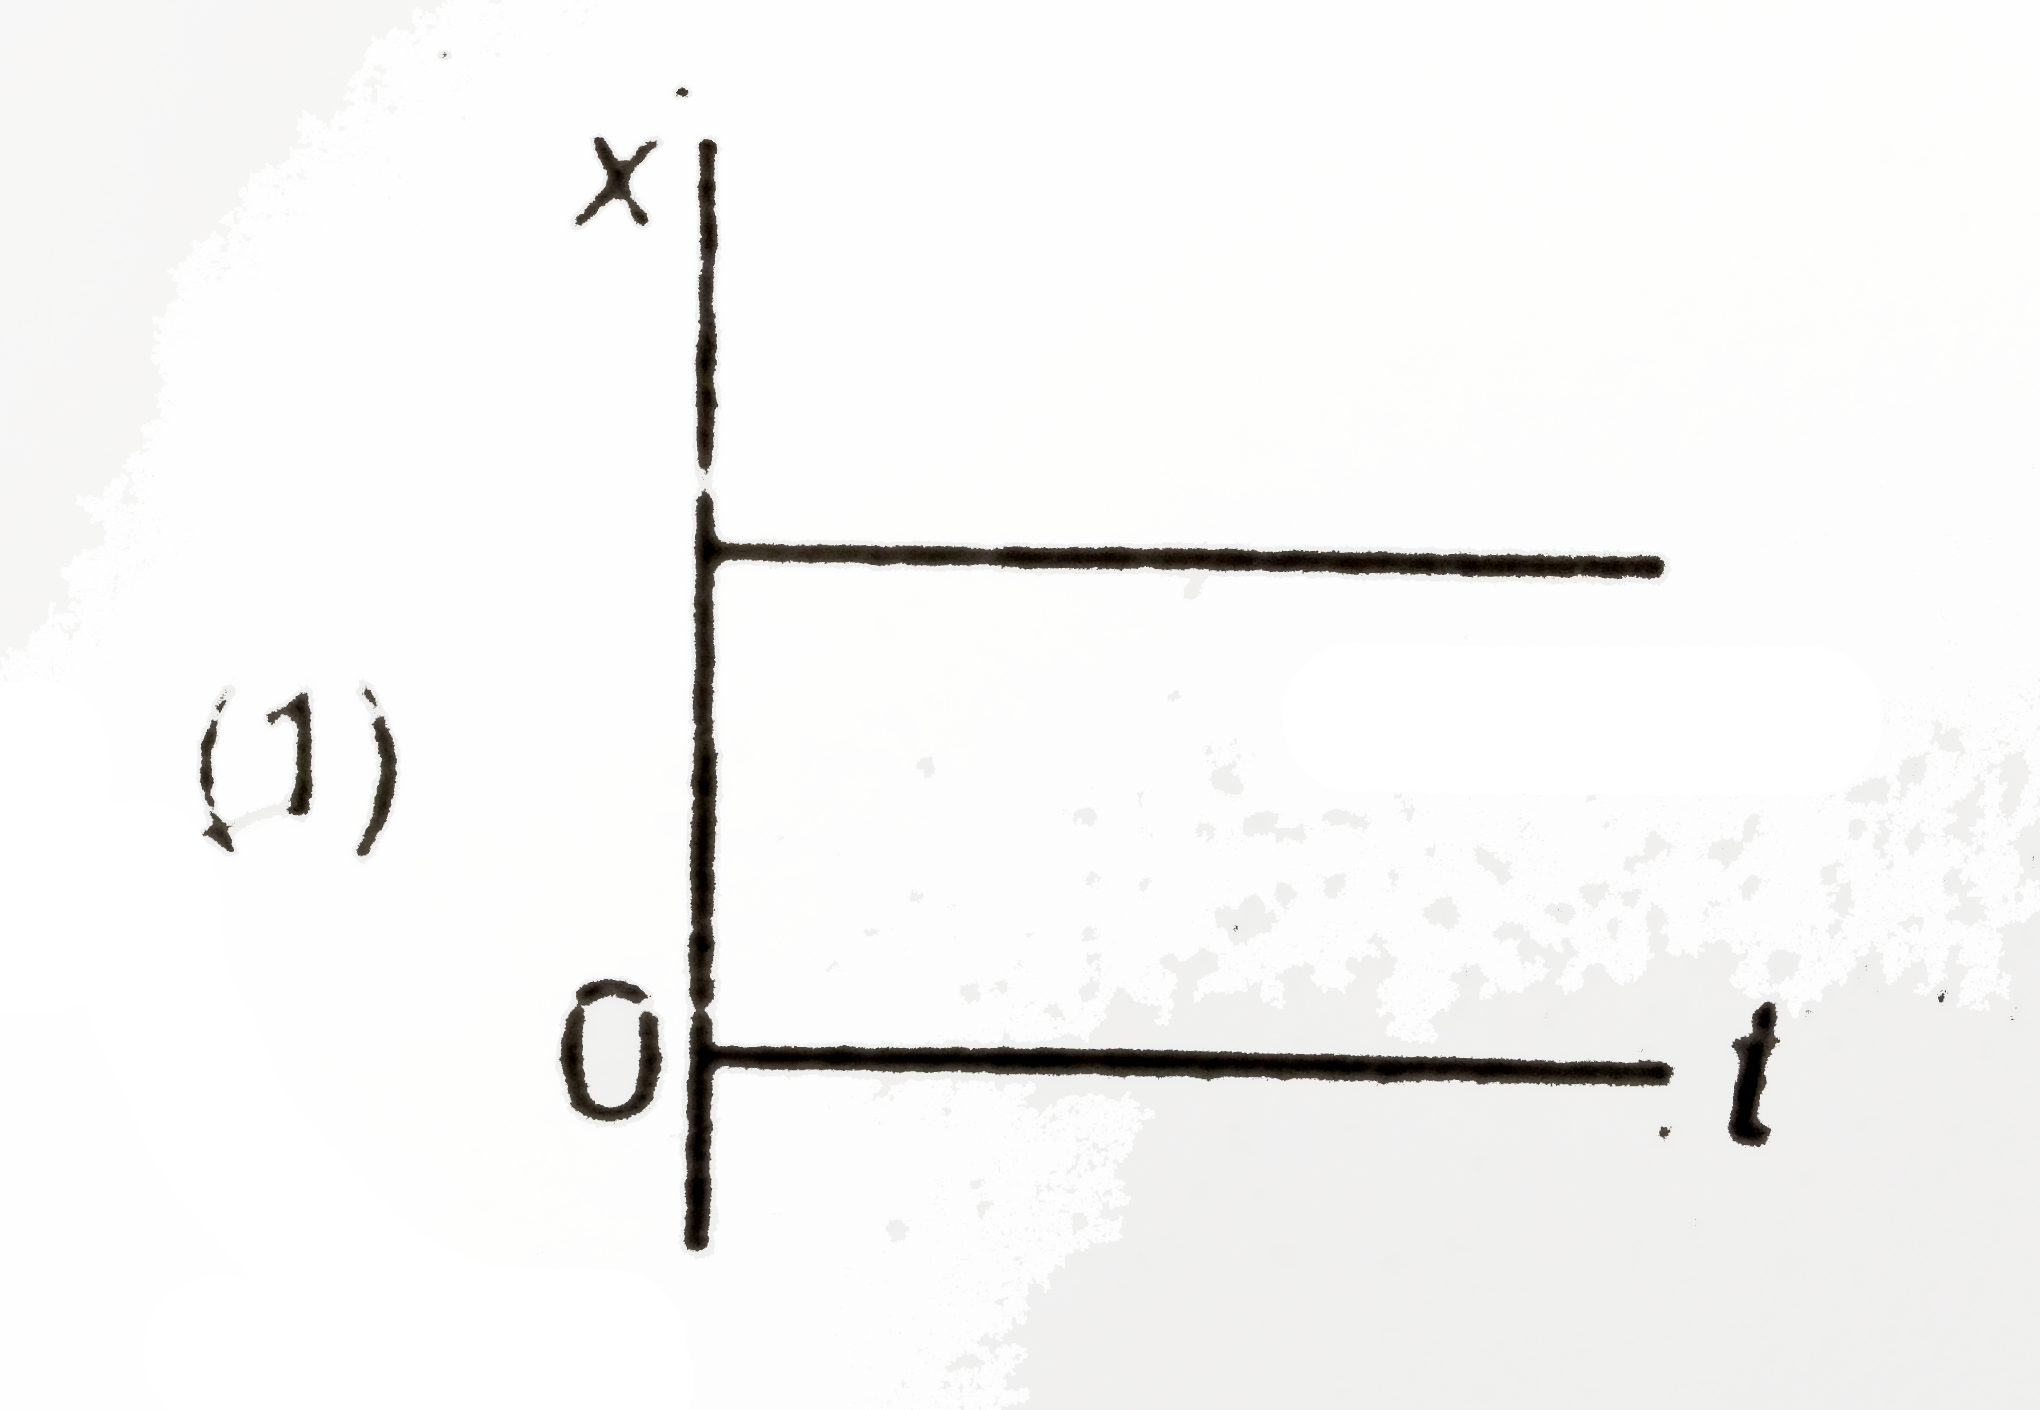
Which graph represents an objects at rest ?
The correct Answer is:A
To determine which graph represents an object at rest, we need to analyze the characteristics of each graph in relation to the definition of rest in physics. An object is said to be at rest if its velocity is zero. Let's break down the solution step by step.
1. Understanding the Concept of Rest:
- An object is at rest when its velocity is zero. Mathematically, velocity (v) can be expressed as:
v=x2−x1t2−t1
- Here, x2 and x1 are the positions of the object at two different times t2 and t1.
2. Analyzing the Graphs:
- We are given four graphs to analyze. We will evaluate each one to see if it represents an object at rest (i.e., where velocity v=0).
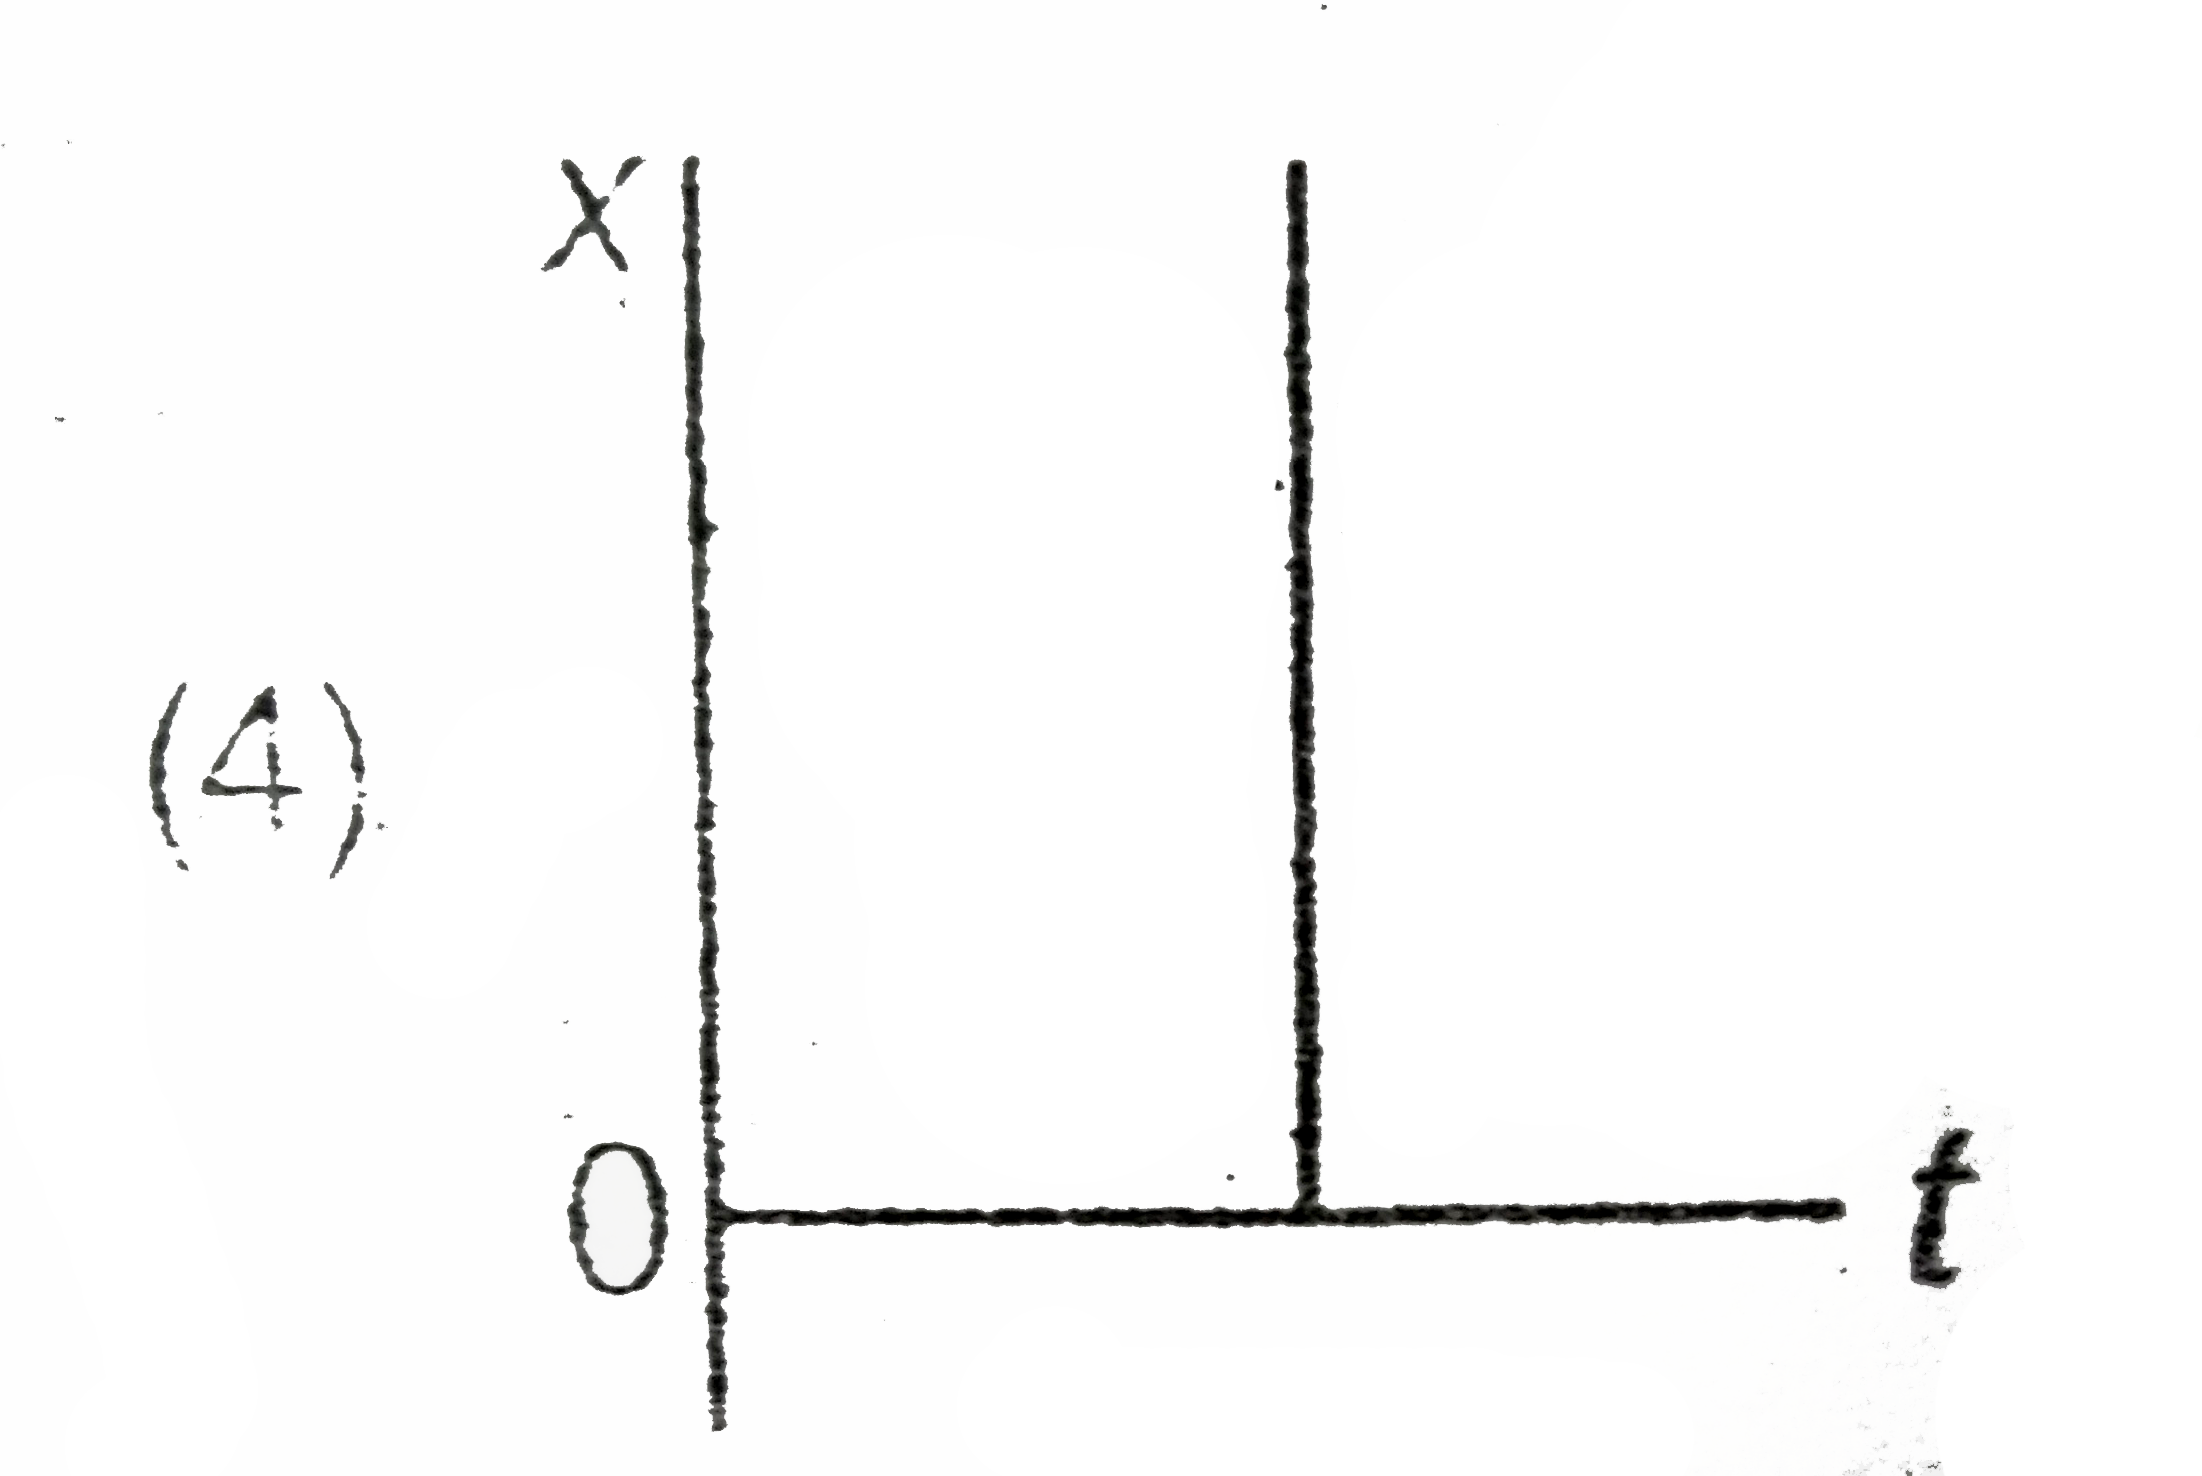
3. Evaluating the Fourth Graph:
- Assume points on the graph represent x1 and x2 at times t1 and t2.
- If the graph shows a vertical line (constant position), then:
x2−x1=0andt2−t1>0
- Thus, v=0t2−t1=0. This graph represents an object at rest.
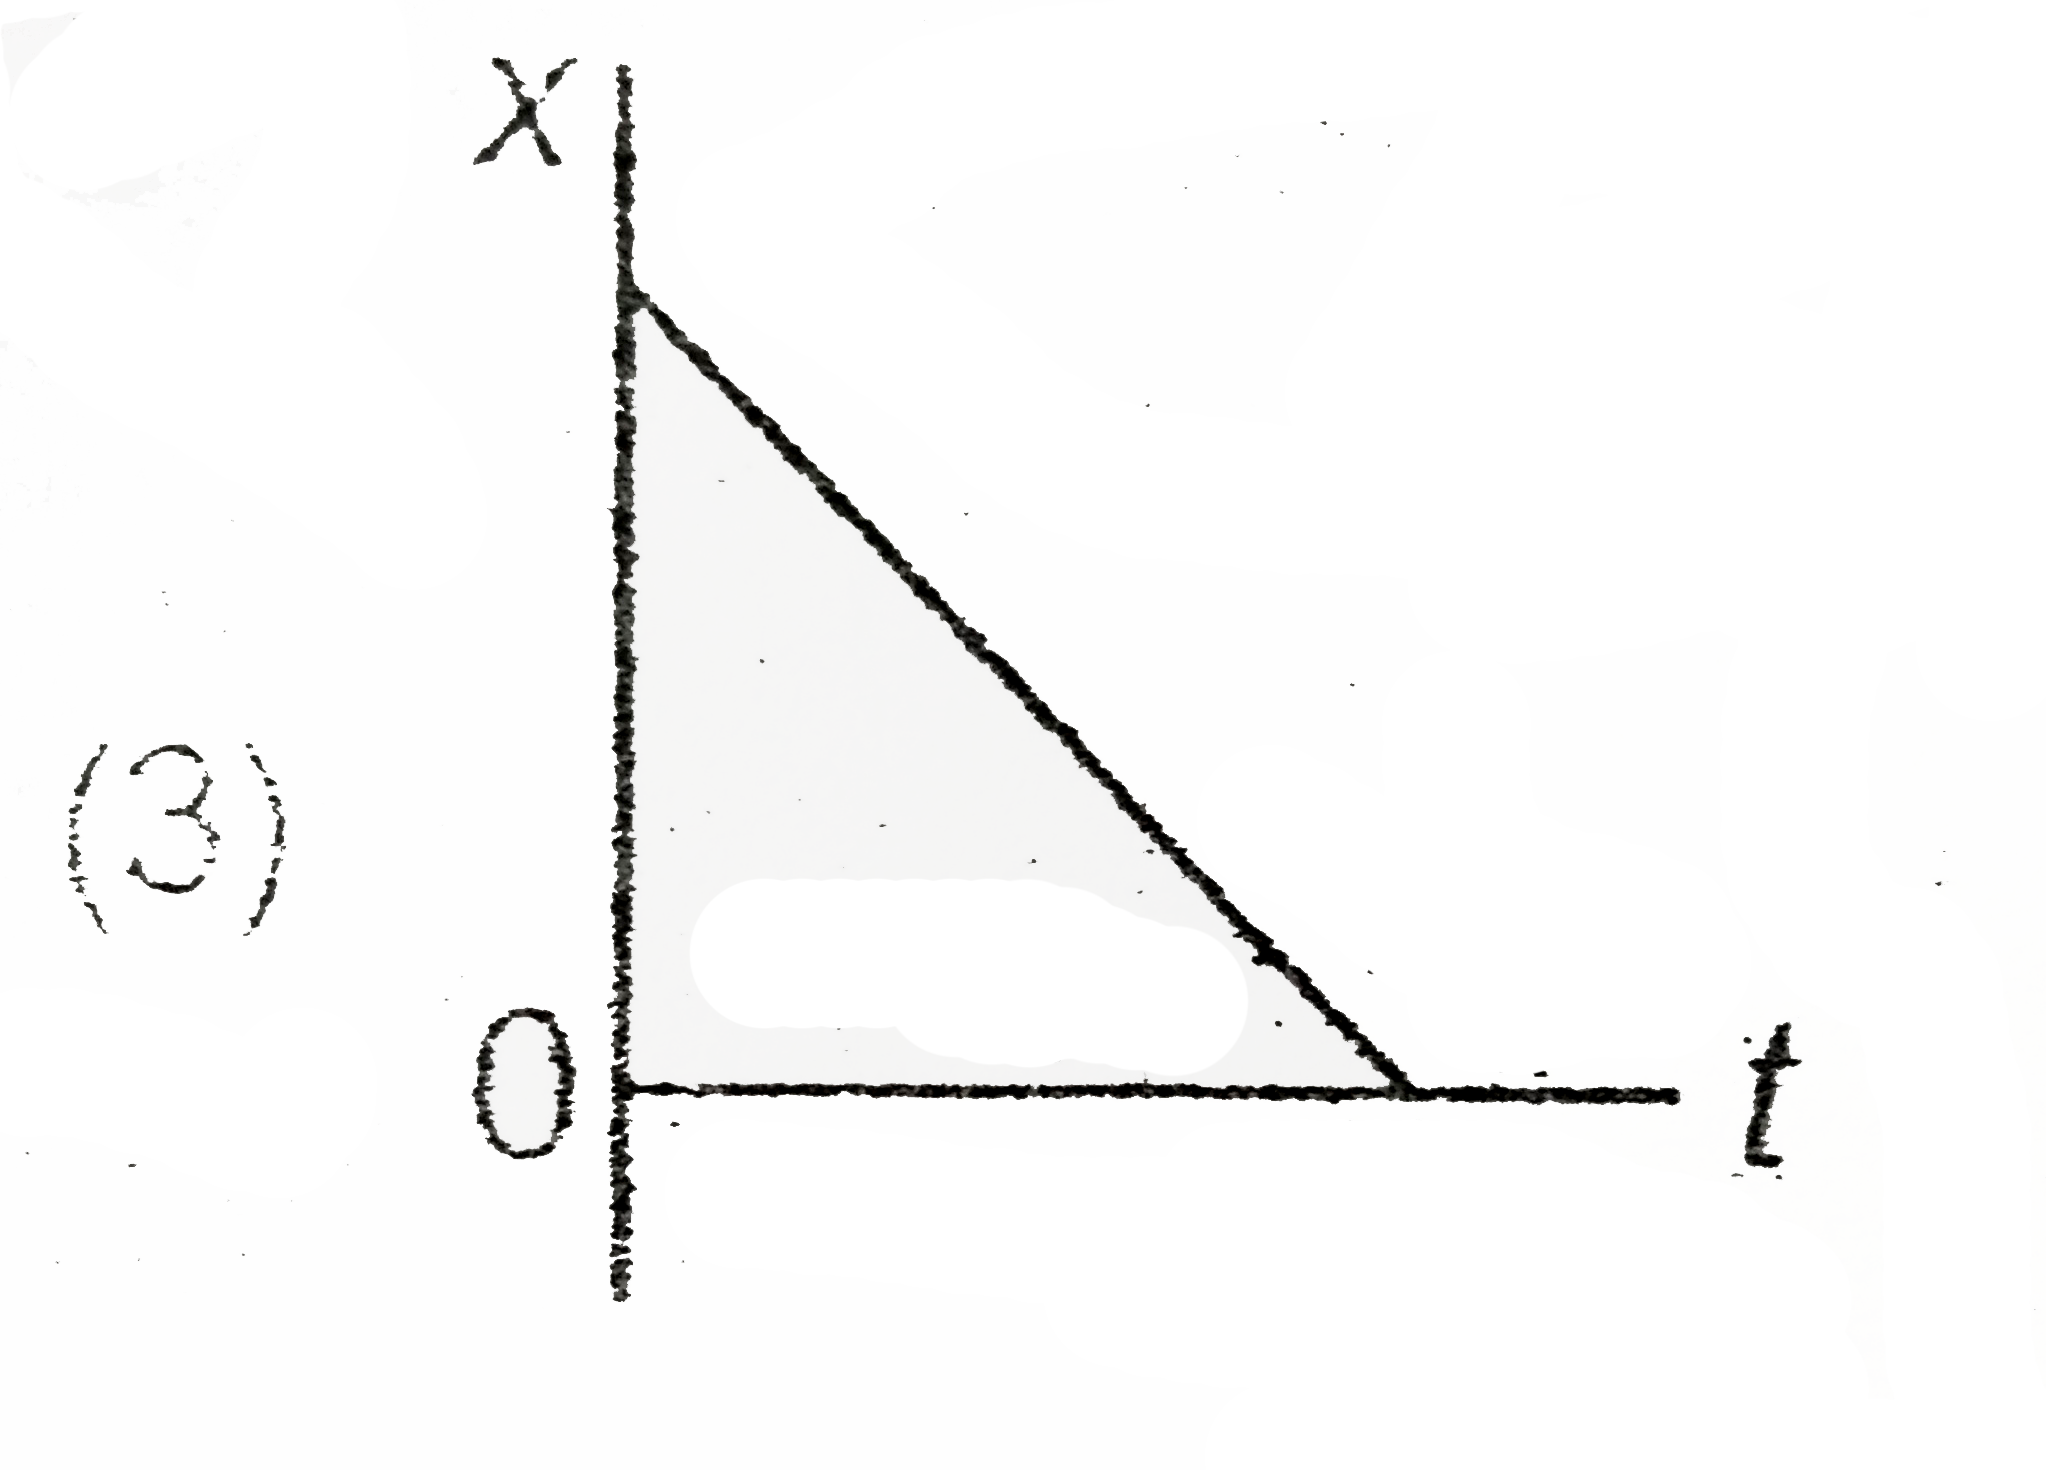
4. Evaluating the Third Graph:
- If the graph shows a downward slope, then:
x2−x1<0andt2−t1>0
- Here, v<0, indicating the object is in motion, not at rest.
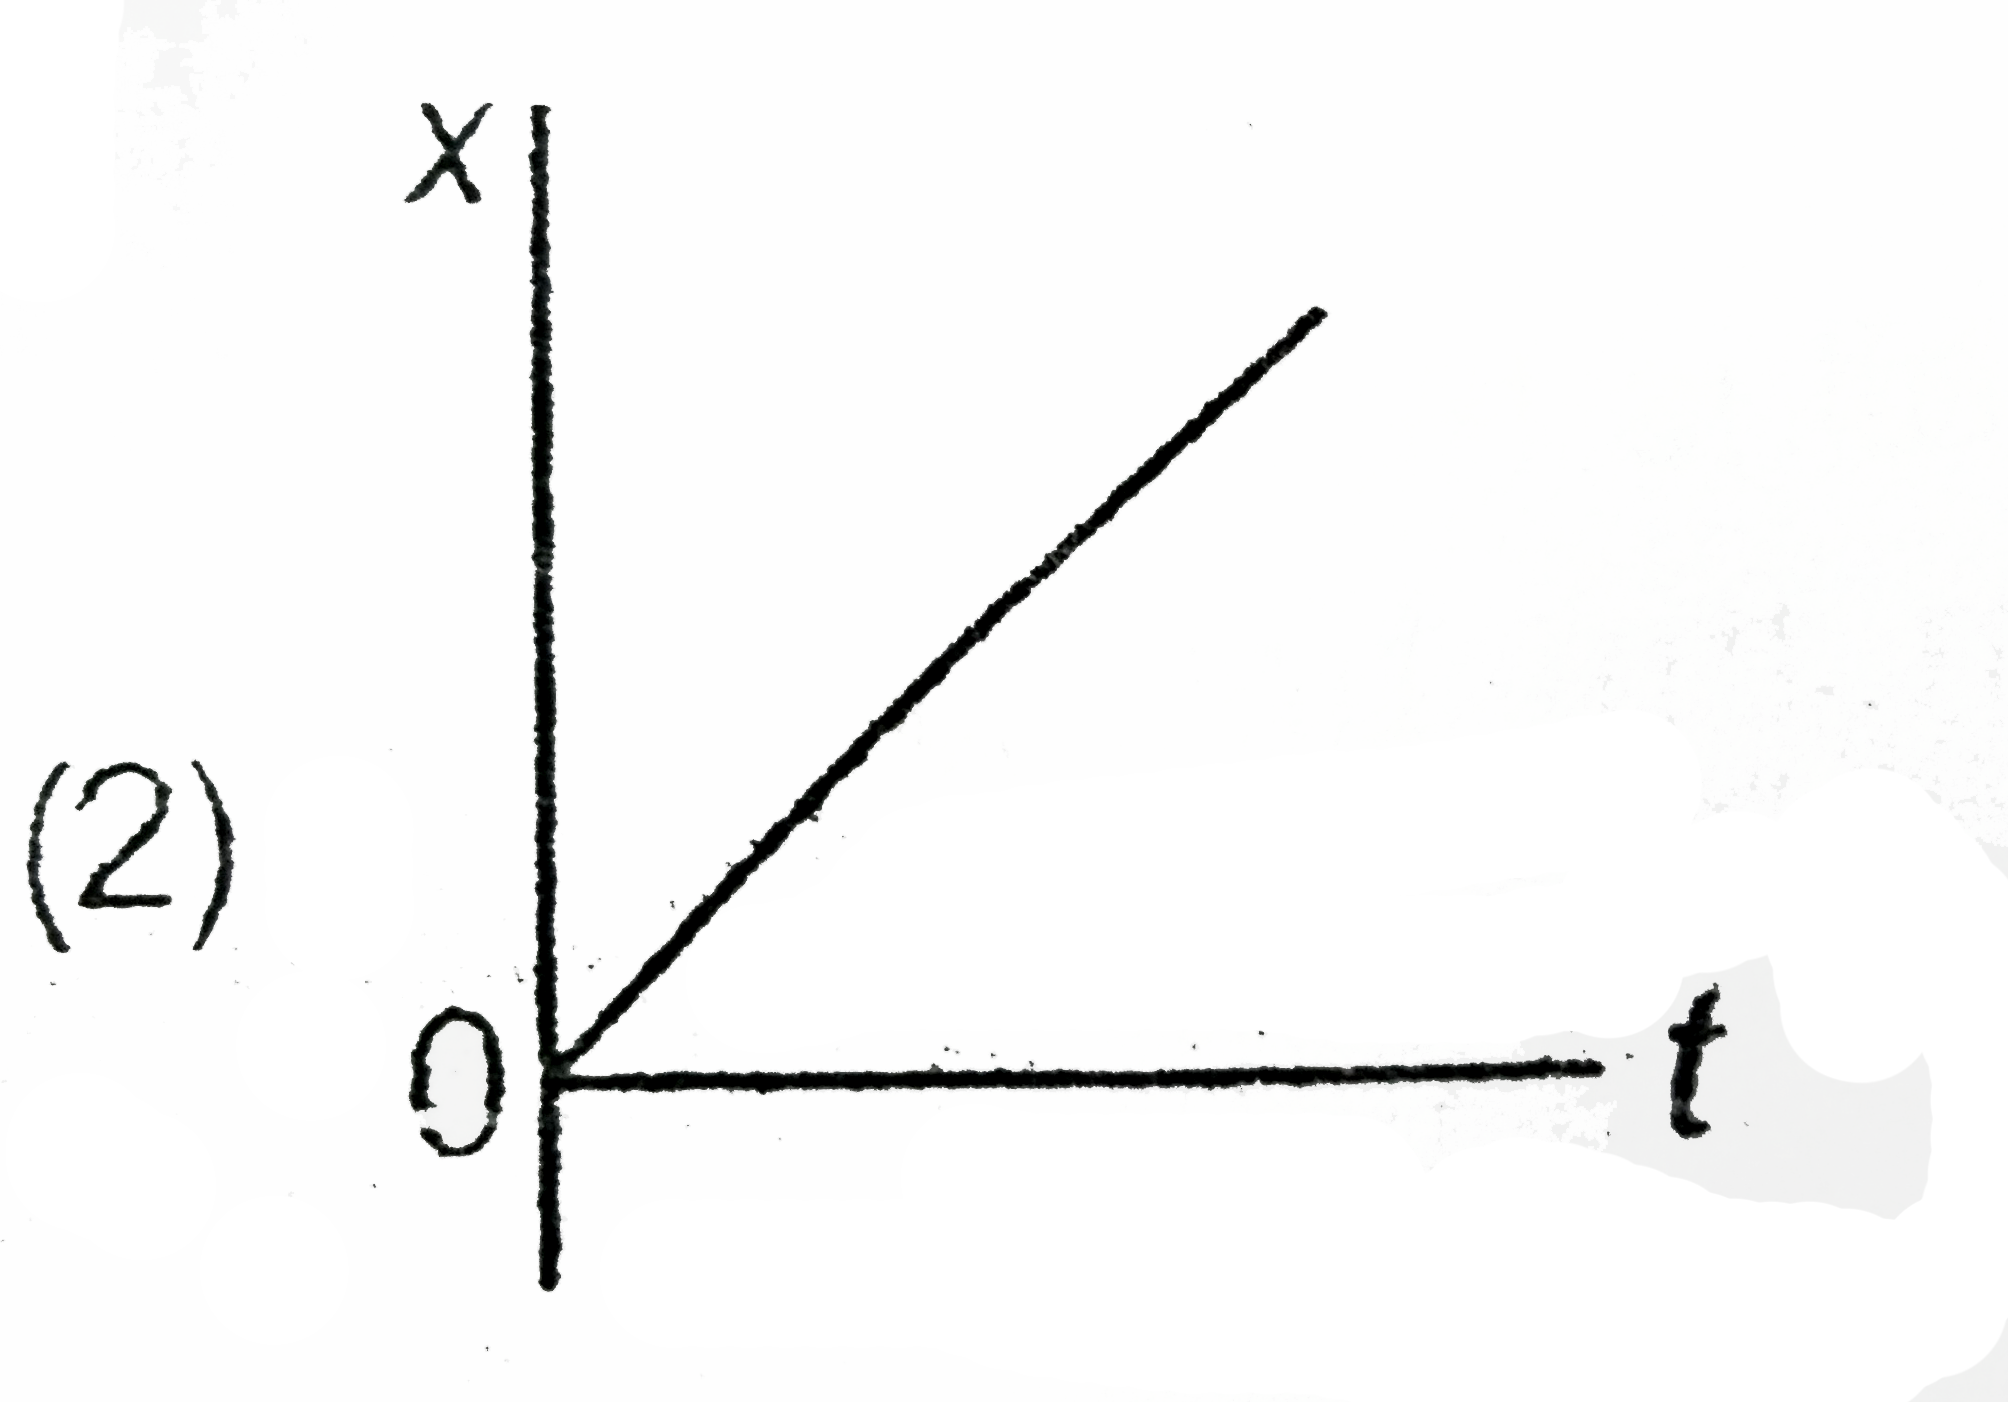
5. Evaluating the Second Graph:
- If the graph shows an upward slope, then:
x2−x1>0andt2−t1>0
- Here, v>0, indicating the object is moving forward, not at rest.
6. Evaluating the First Graph:
- If the graph is a horizontal line:
x2−x1=0andt2−t1>0
- Thus, v=0t2−t1=0. This graph also represents an object at rest.
7. Conclusion:
- The first graph represents an object at rest as it shows a constant position over time, resulting in zero velocity.
Final Answer:
The graph that represents an object at rest is the first graph.
- An object is at rest when its velocity is zero. Mathematically, velocity (v) can be expressed as:
v=x2−x1t2−t1
- Here, x2 and x1 are the positions of the object at two different times t2 and t1.
- We are given four graphs to analyze. We will evaluate each one to see if it represents an object at rest (i.e., where velocity v=0).
- Assume points on the graph represent x1 and x2 at times t1 and t2.
- If the graph shows a vertical line (constant position), then:
x2−x1=0andt2−t1>0
- Thus, v=0t2−t1=0. This graph represents an object at rest.
- If the graph shows a downward slope, then:
x2−x1<0andt2−t1>0
- Here, v<0, indicating the object is in motion, not at rest.
- If the graph shows an upward slope, then:
x2−x1>0andt2−t1>0
- Here, v>0, indicating the object is moving forward, not at rest.
- If the graph is a horizontal line:
x2−x1=0andt2−t1>0
- Thus, v=0t2−t1=0. This graph also represents an object at rest.
- The first graph represents an object at rest as it shows a constant position over time, resulting in zero velocity.
The graph that represents an object at rest is the first graph.
Topper's Solved these Questions
- MOTION IN STRAIGHT LINEBook:AAKASH INSTITUTE ENGLISHChapter:MOTION IN STRAIGHT LINEExercise:Assignment (SECTION - C)
Explore 7 Videos
- MOTION IN STRAIGHT LINEBook:AAKASH INSTITUTE ENGLISHChapter:MOTION IN STRAIGHT LINEExercise:Assignment (SECTION - D)
Explore 24 Videos
- MOTION IN STRAIGHT LINEBook:AAKASH INSTITUTE ENGLISHChapter:MOTION IN STRAIGHT LINEExercise:Assignment (SECTION - A)
Explore 50 Videos
- MOTION IN A STRAIGHT LINEBook:AAKASH INSTITUTE ENGLISHChapter:MOTION IN A STRAIGHT LINEExercise:ASSIGNMENT (SECTION - D)
Explore 15 Videos
- MOVING CHARGE AND MAGNESIUMBook:AAKASH INSTITUTE ENGLISHChapter:MOVING CHARGE AND MAGNESIUMExercise:SECTION D
Explore 16 Videos
Similar Questions
Knowledge Check
Which of the following graph represents correct graph for SN1 reaction :
A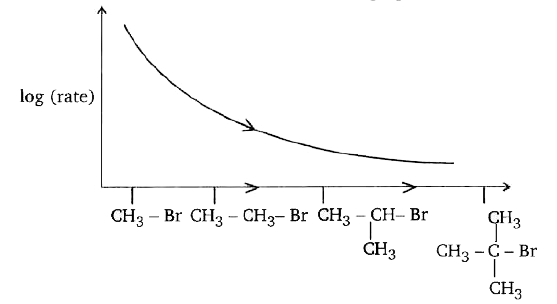 B
B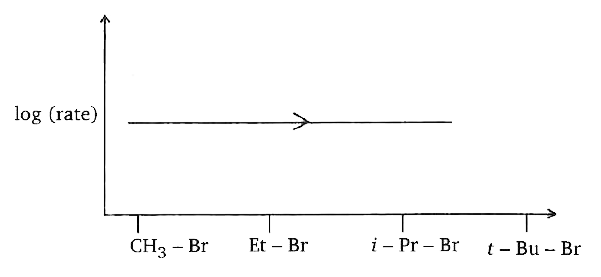 C
C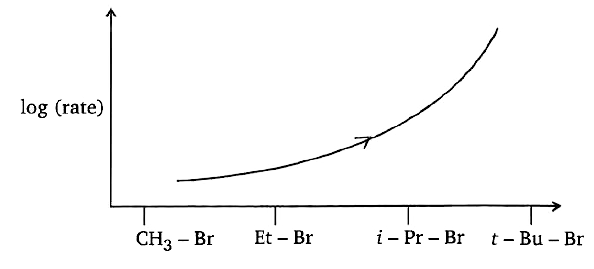 D
D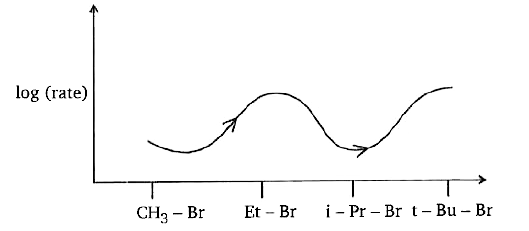
Which of the following graphs represents exothermic reaction ?
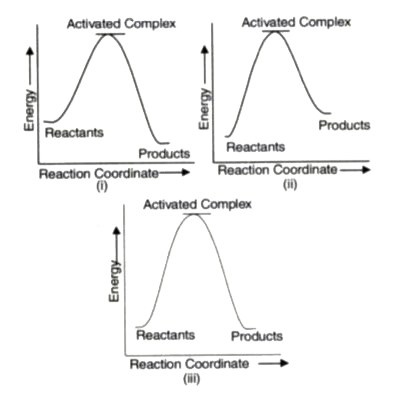 A(i) onlyB(ii) onlyC(iii) onlyD(i) and (ii)
Which graph corresponds to an object moving with a constant negative acceleration and a positive velocity ?
View SolutionWhich graph corresponds to an object moving with a constant negative acceleration and a positive velocity ?
View SolutionWhich of the following graph represents Boyle's law ?
View SolutionGraph represents motion of an object along X-axis for 80 s :-
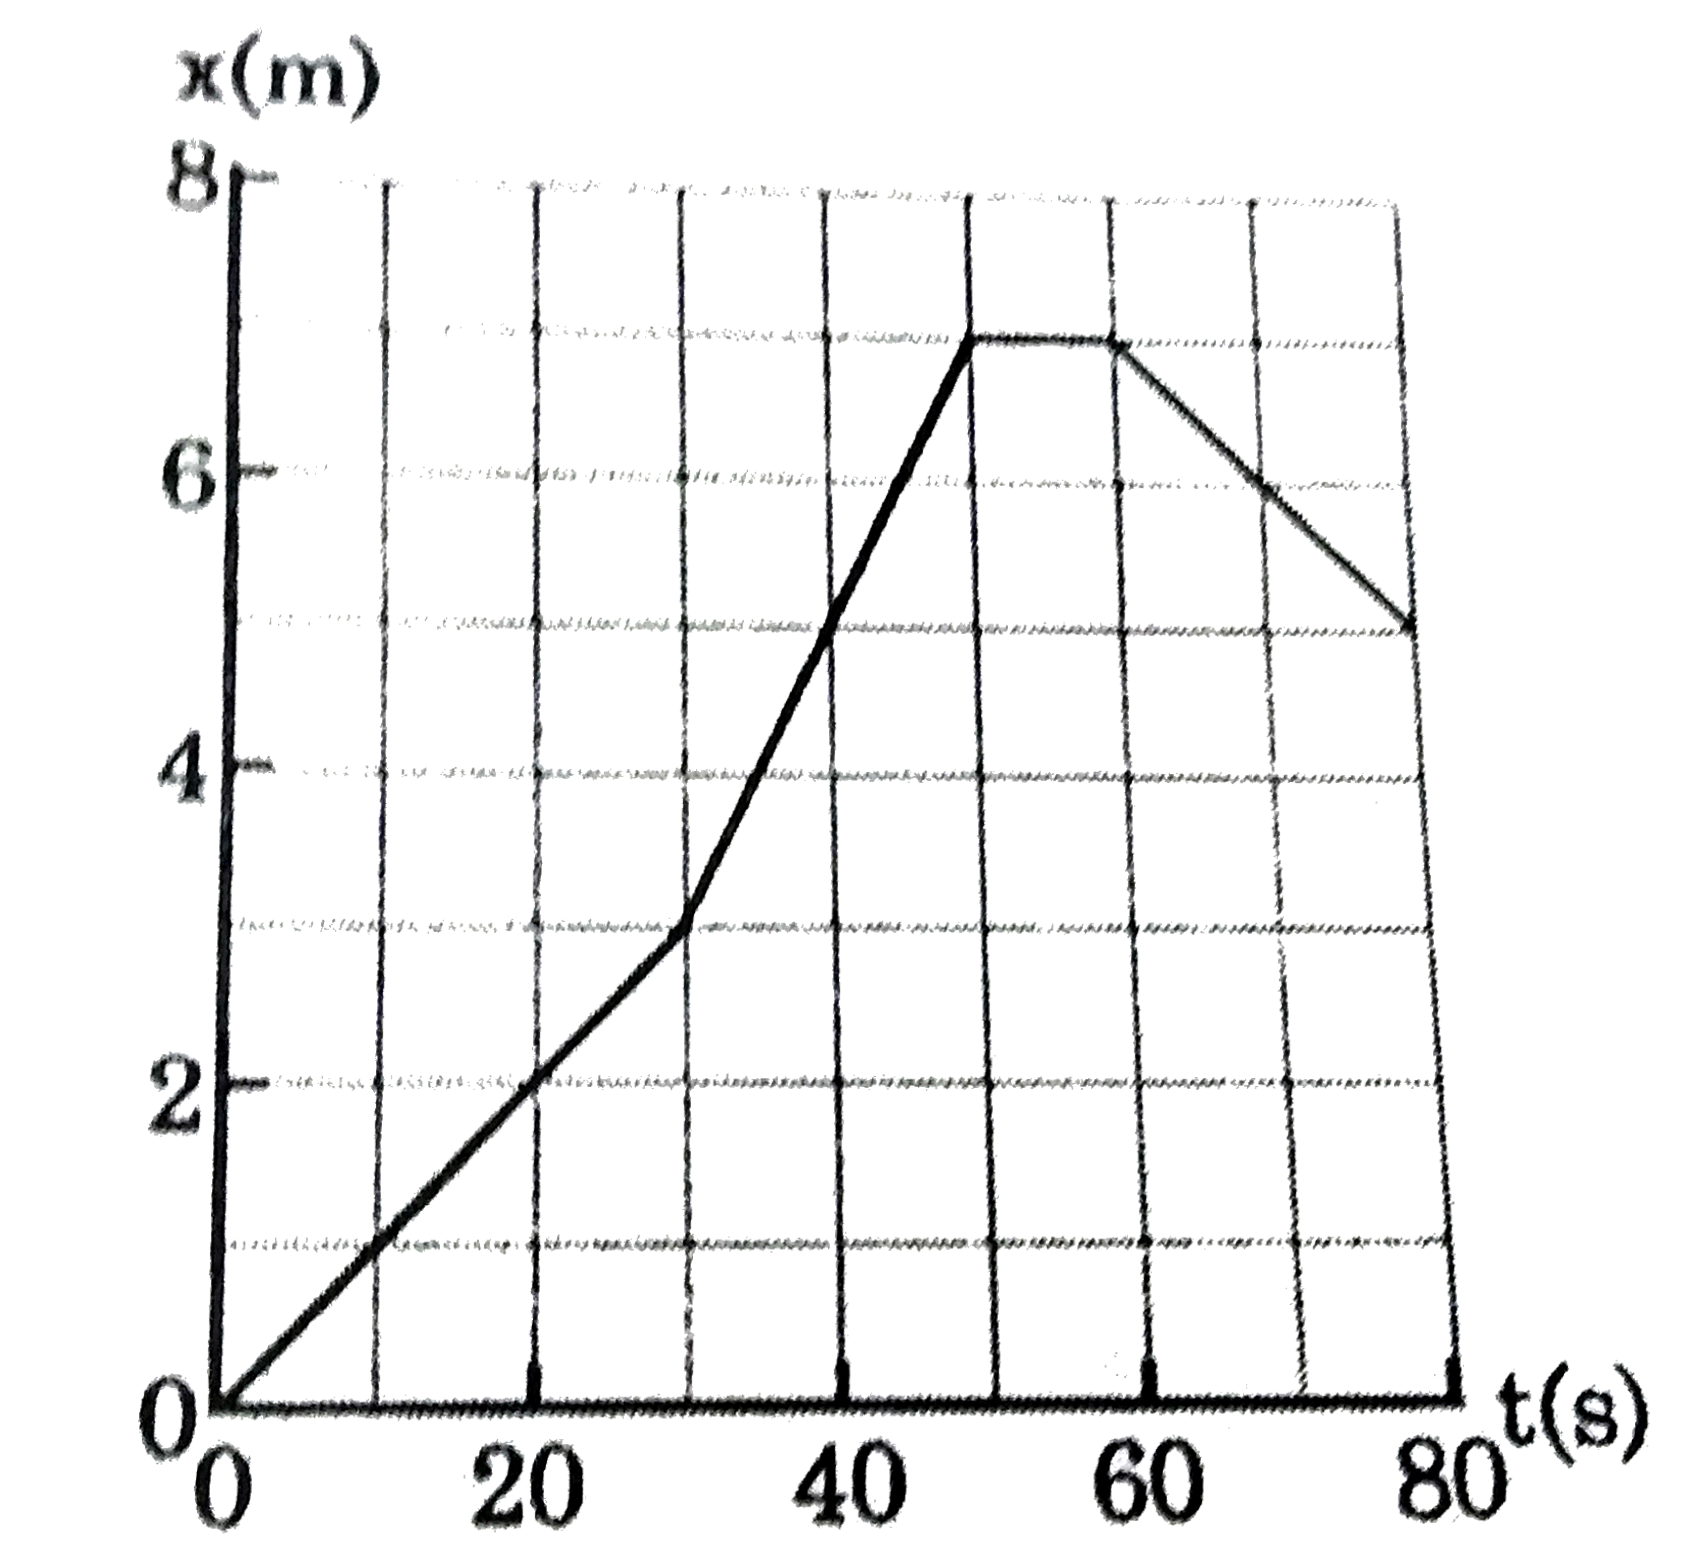
View SolutionWhich of the following graph represents relation between the image position (v) and object position (u) from the concave lens.
View SolutionWhich of the following graph represents exothermic reaction ?
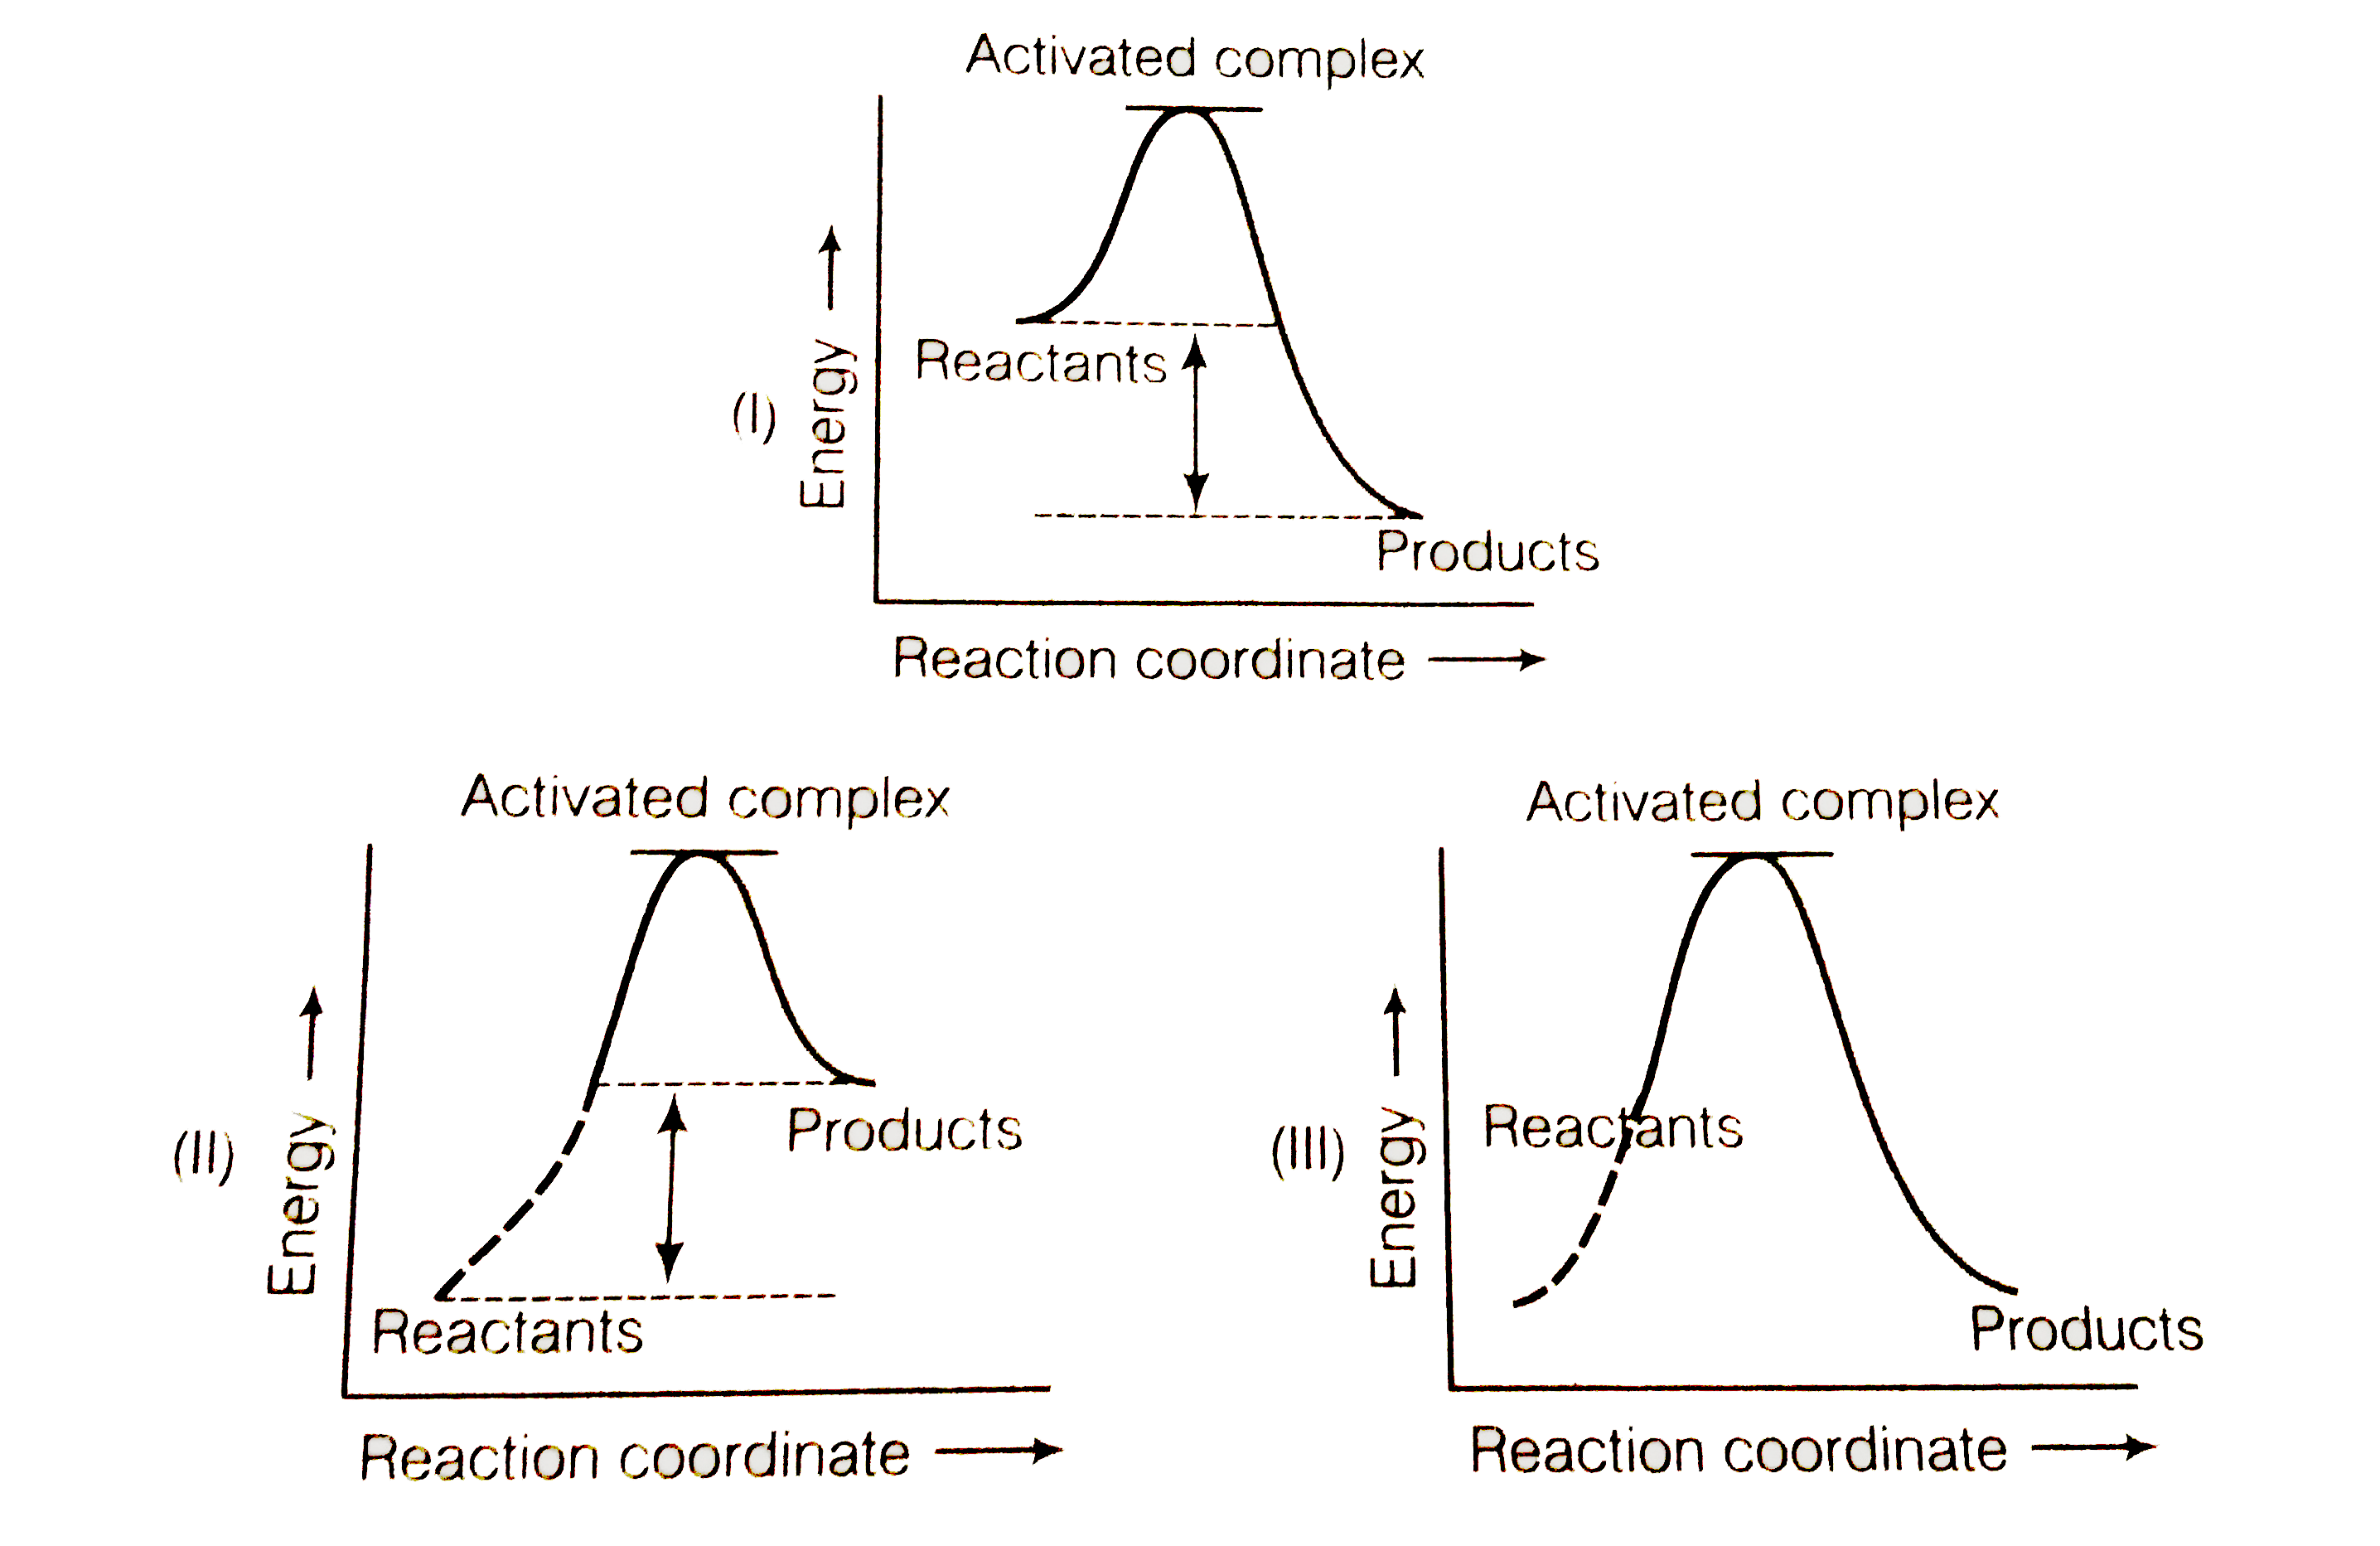
View Solution
