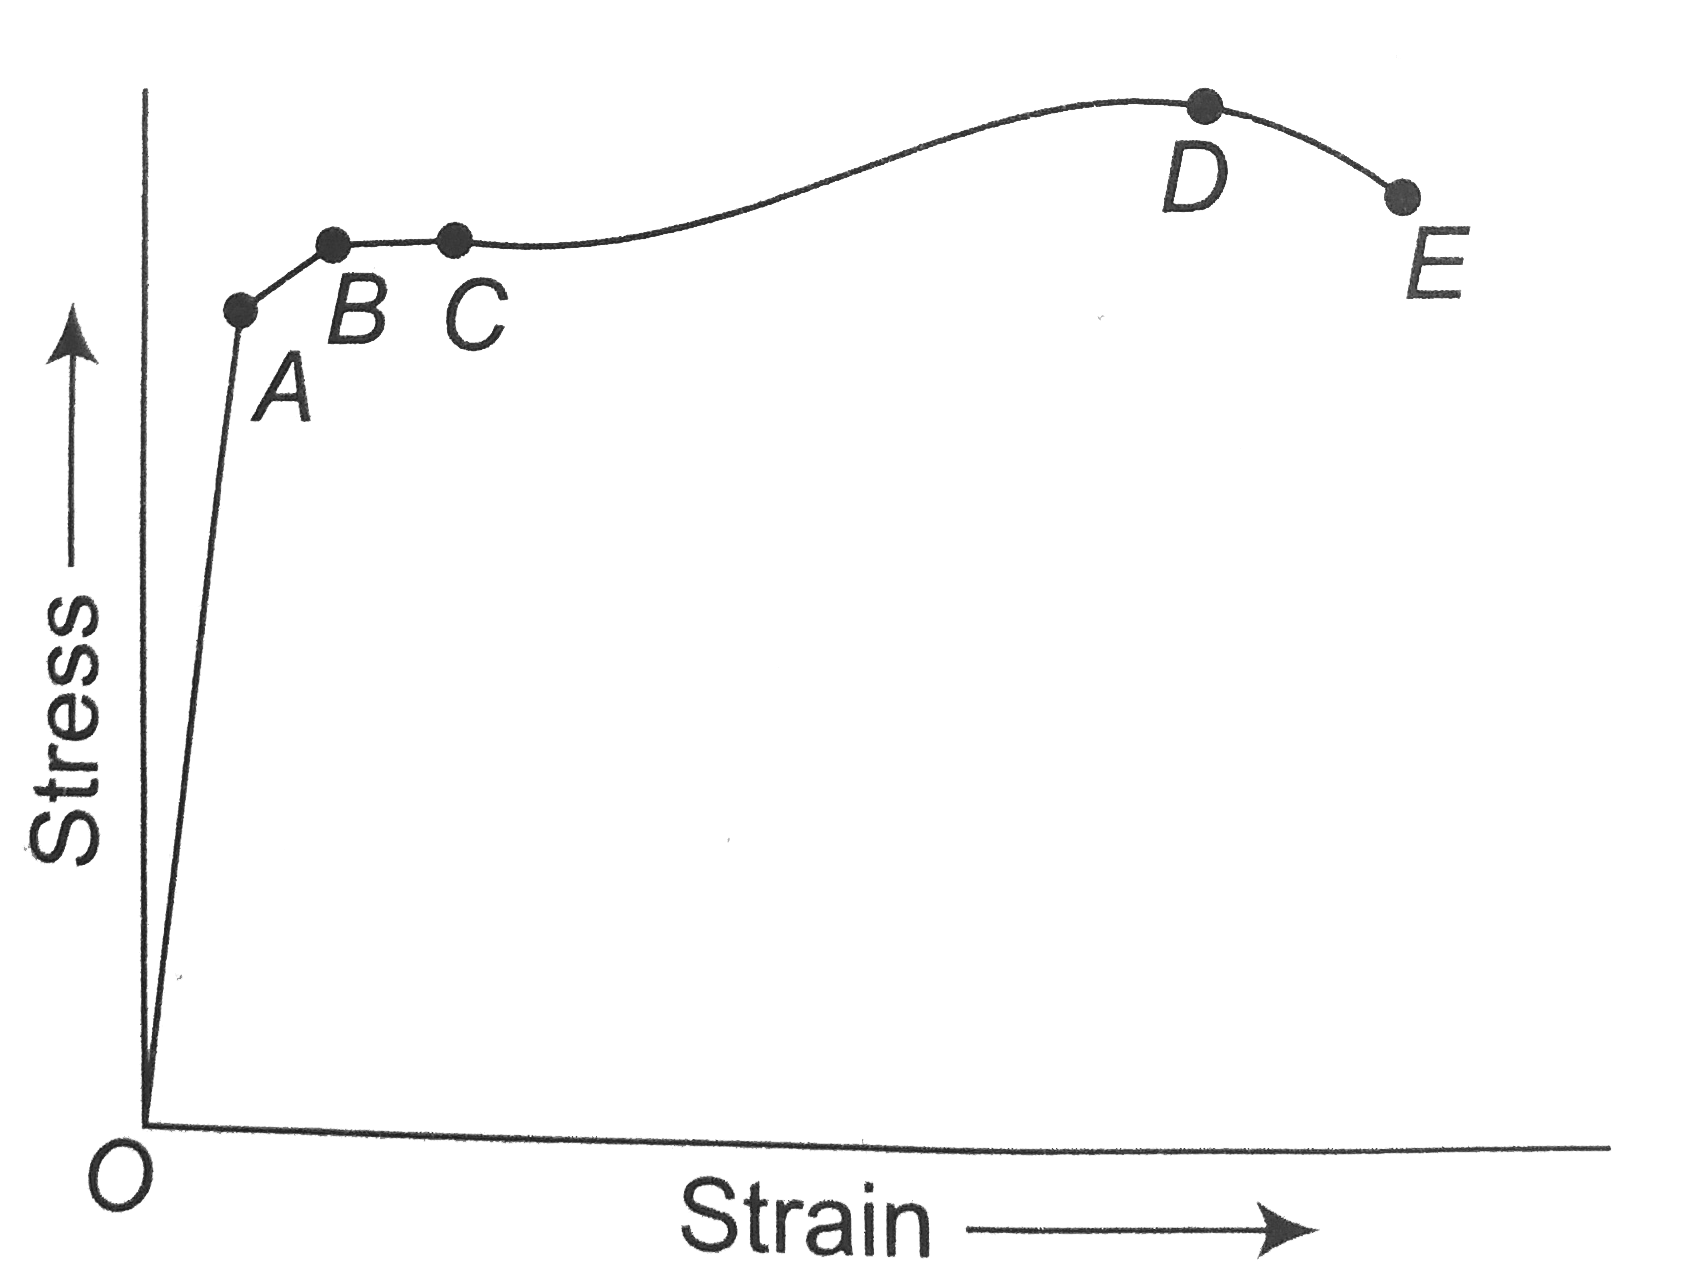
The stress strain graph for a metal wire is as shown in the figure. In the graph, the region in which Hooke's law is obeyed, the ultimate strength and fracture are represented by
OA, C, D
OB, D, E
OA, D, E
OB, C, D
The correct Answer is:C
In the region OA, the graph is linear showing that stress is proportional to the strain. Thus, in this region Hooke's law is obeyed.
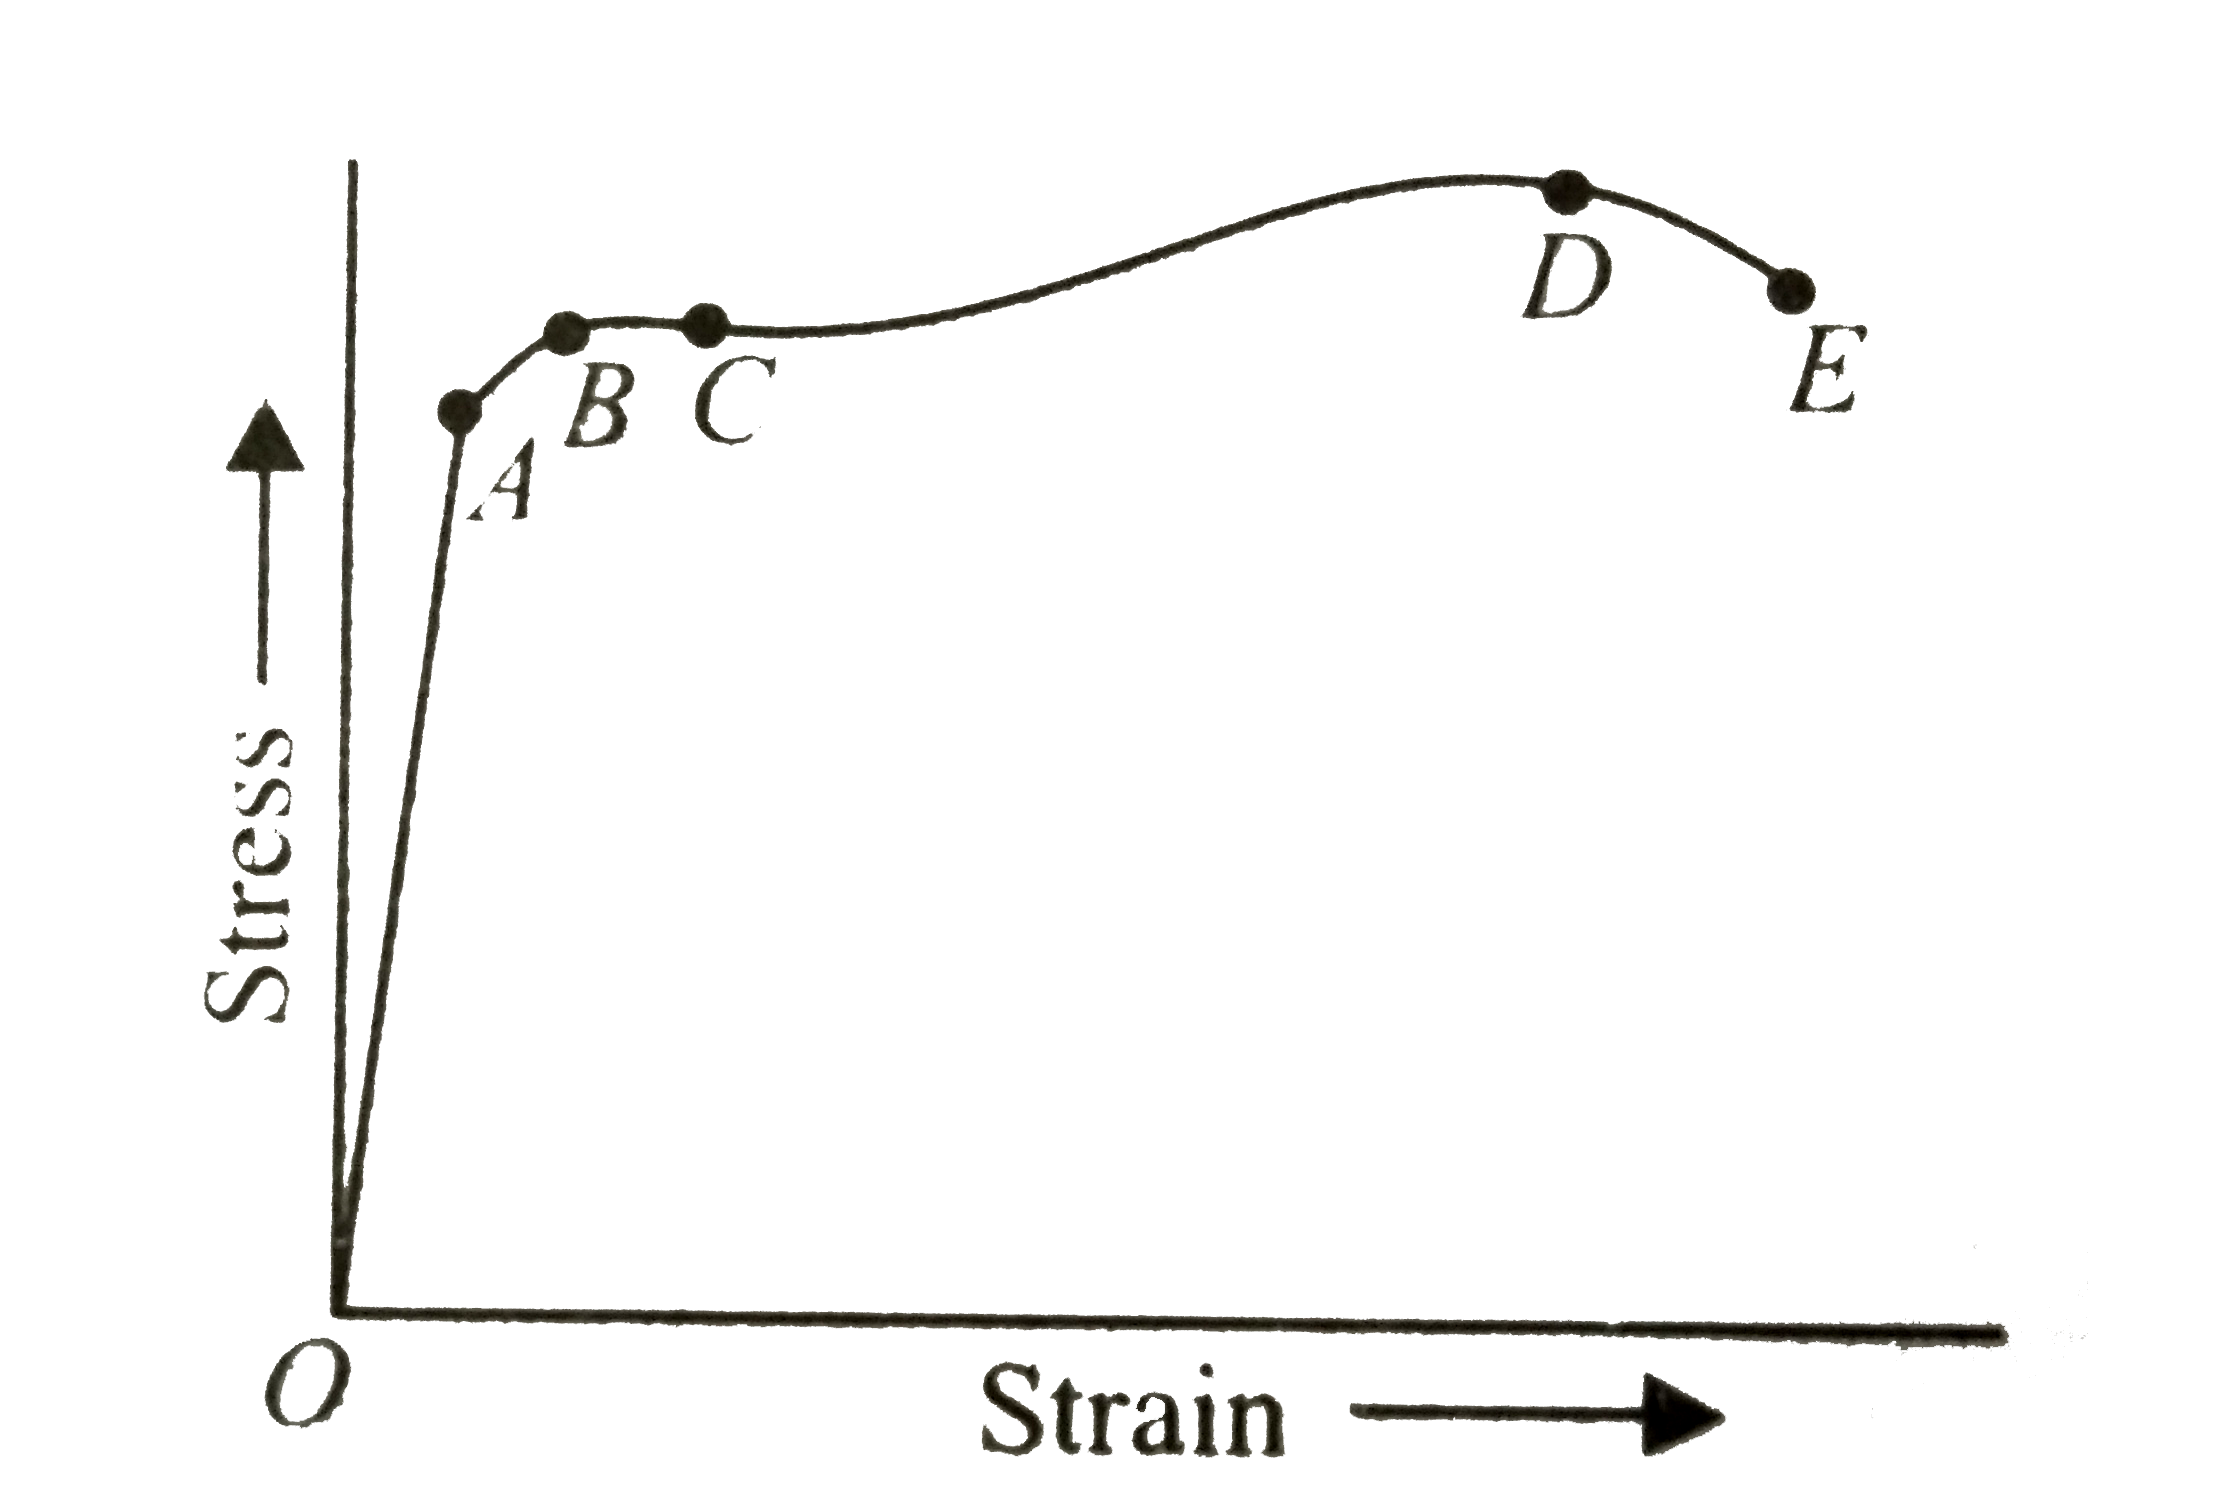
The point D on the graph is known as ultimate tensile strenght.
The point E on the graph is known as fracture point.
Topper's Solved these Questions
- BOOK - NCERT FINGERTIPSCHAPTER - MECHANICAL PROPERTIES OF SOLIDSEXERCISE - Elastic Moduli69videos
MECHANICAL PROPERTIES OF SOLIDS
- BOOK - NCERT FINGERTIPSCHAPTER - MECHANICAL PROPERTIES OF SOLIDSEXERCISE - Applications Of Elastic Behaviour Of Materials8videos
MECHANICAL PROPERTIES OF SOLIDS
- BOOK - NCERT FINGERTIPSCHAPTER - MECHANICAL PROPERTIES OF SOLIDSEXERCISE - Hooke'S Law3videos
MECHANICAL PROPERTIES OF SOLIDS
- BOOK - NCERT FINGERTIPSCHAPTER - MECHANICAL PROPERTIES OF FLUIDSEXERCISE - Assertion And Reason15videos
MECHANICAL PROPERTIES OF FLUIDS
- BOOK - NCERT FINGERTIPSCHAPTER - MOTION IN A PLANE EXERCISE - Assertion And Reason15videos
MOTION IN A PLANE
Similar Questions
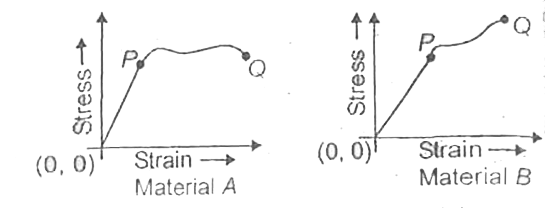
The stress-strain graphs for two materials A and are shown in figure. The graphs are drawn to the same scale. Select the correct statement
 View Solution
The stress strain graph for a metal wire is shown in the fig. Upto the point E, the wire returns to its original state O along the curve EPO, when it is gradually unloaded. Point B corresponds to the fracture of the wire. (a) Upto what point on the curve is Hooke's law obeyed? (this point some times called proportional limits).
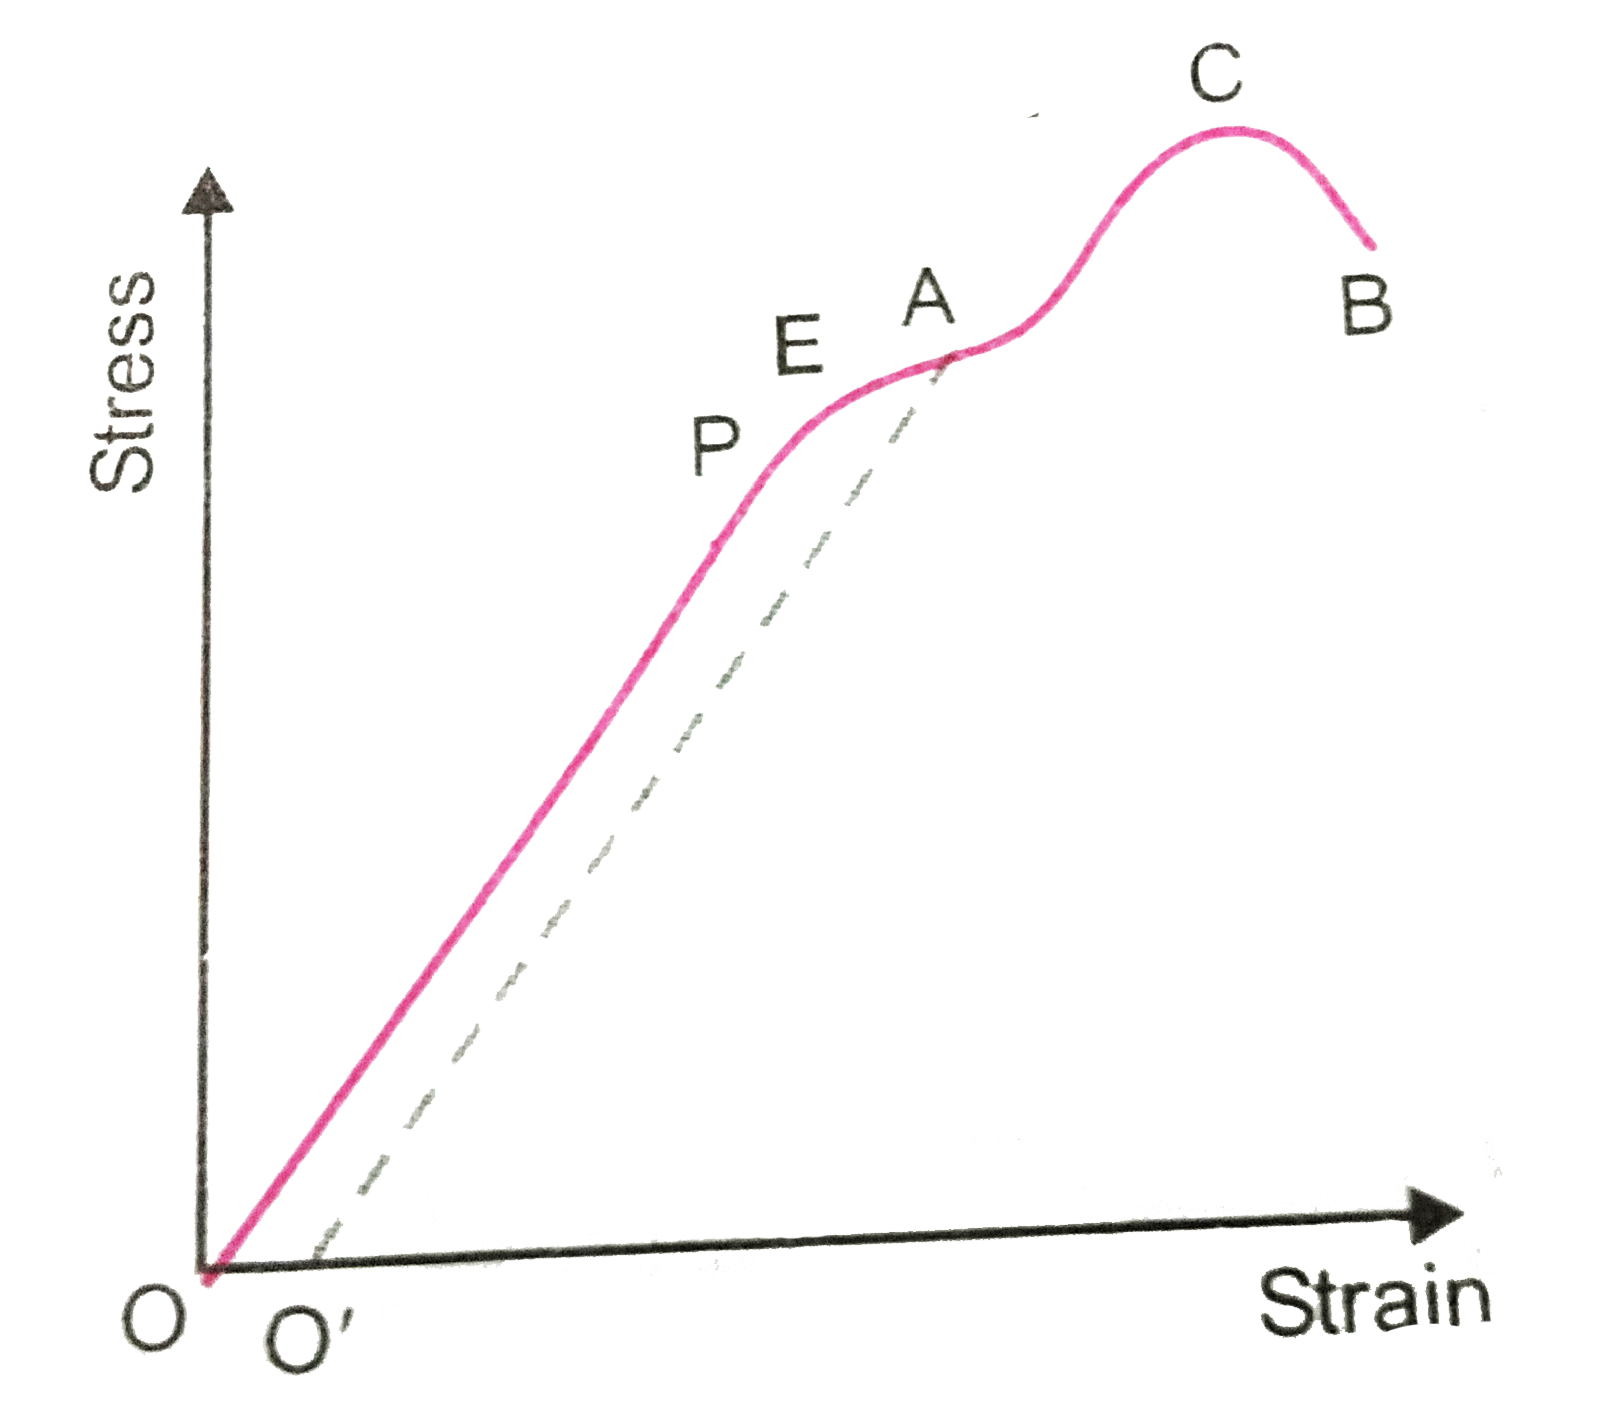
(b) Which point on the curve corresponding to elastic limet or yield point of the wire?
(c ) Indicate teh elastice and plastic regions of the stree-strain graph.
(d) Describe what happens when the wire is loaded upto a stress corresponding to the point A on the graph and then unloaded gradulally. In particular explain the dotted curve.
(e) Wht is peculiar about the protion of the stree- strain graph from C to B? Upto what stress can the wire be subjected with out causing fracture?View Solution
Knowledge Check
- Question 1 - Select One or More
The stress- strain graphs for materials A and B are as shown. Choose the correct alternative
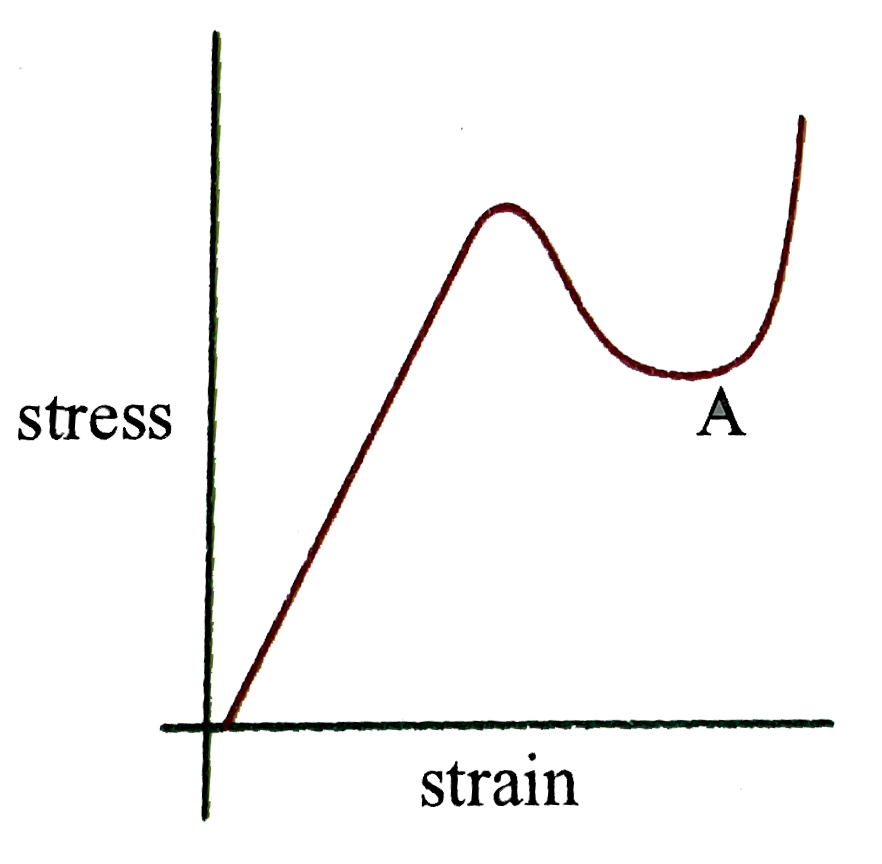
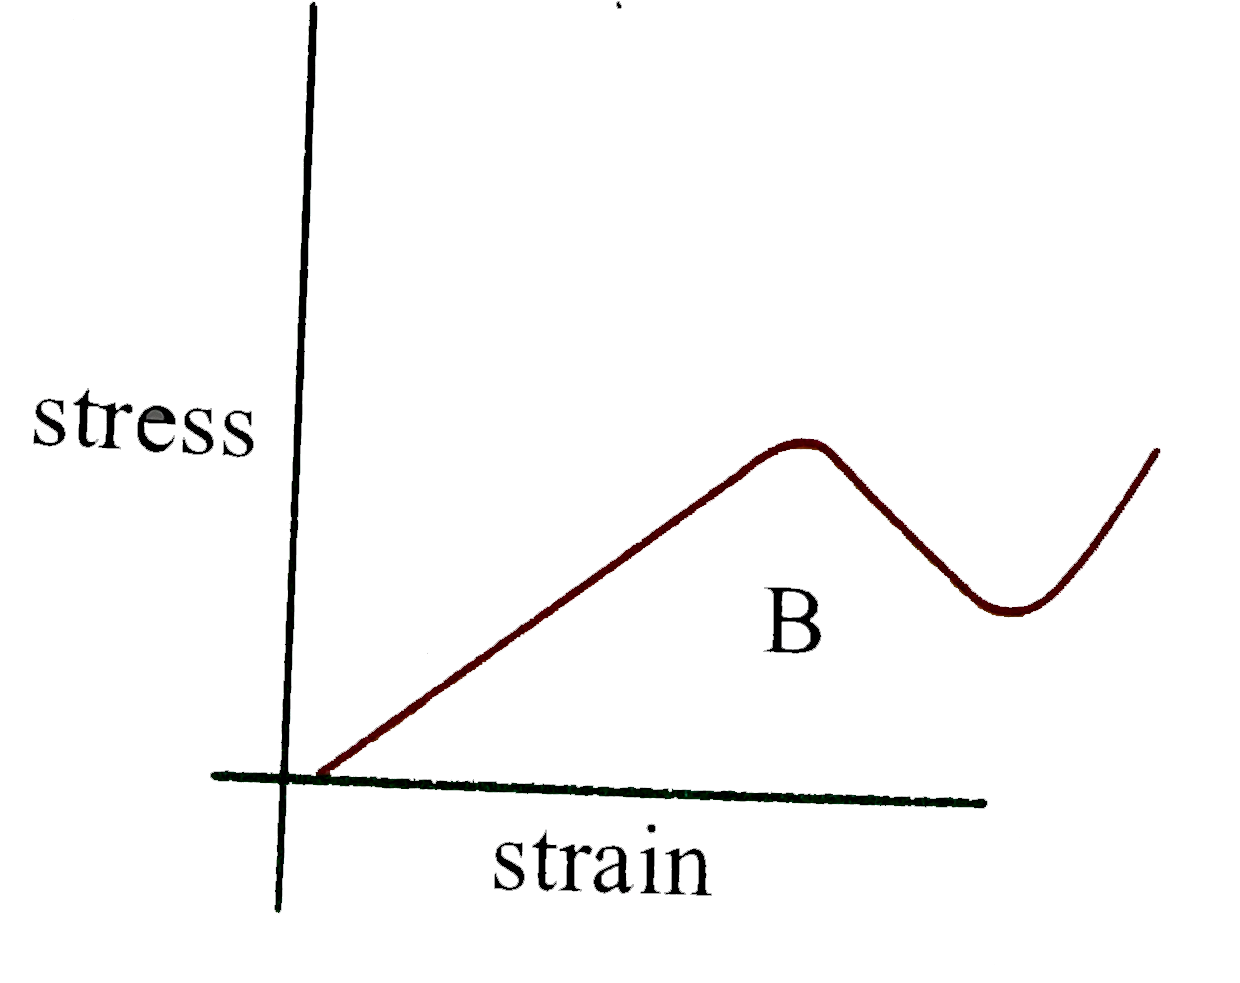 Amaterial A is stronger than material BBmaterial B is stronger than material ACYoung's modulus of A is greater than that of BDYoung's modulus of B is greater than that of A
 - Question 2 - Select One or More
The stress-strain graphs for two materials are shown in Fig. 7(EP).3 (assume scale).
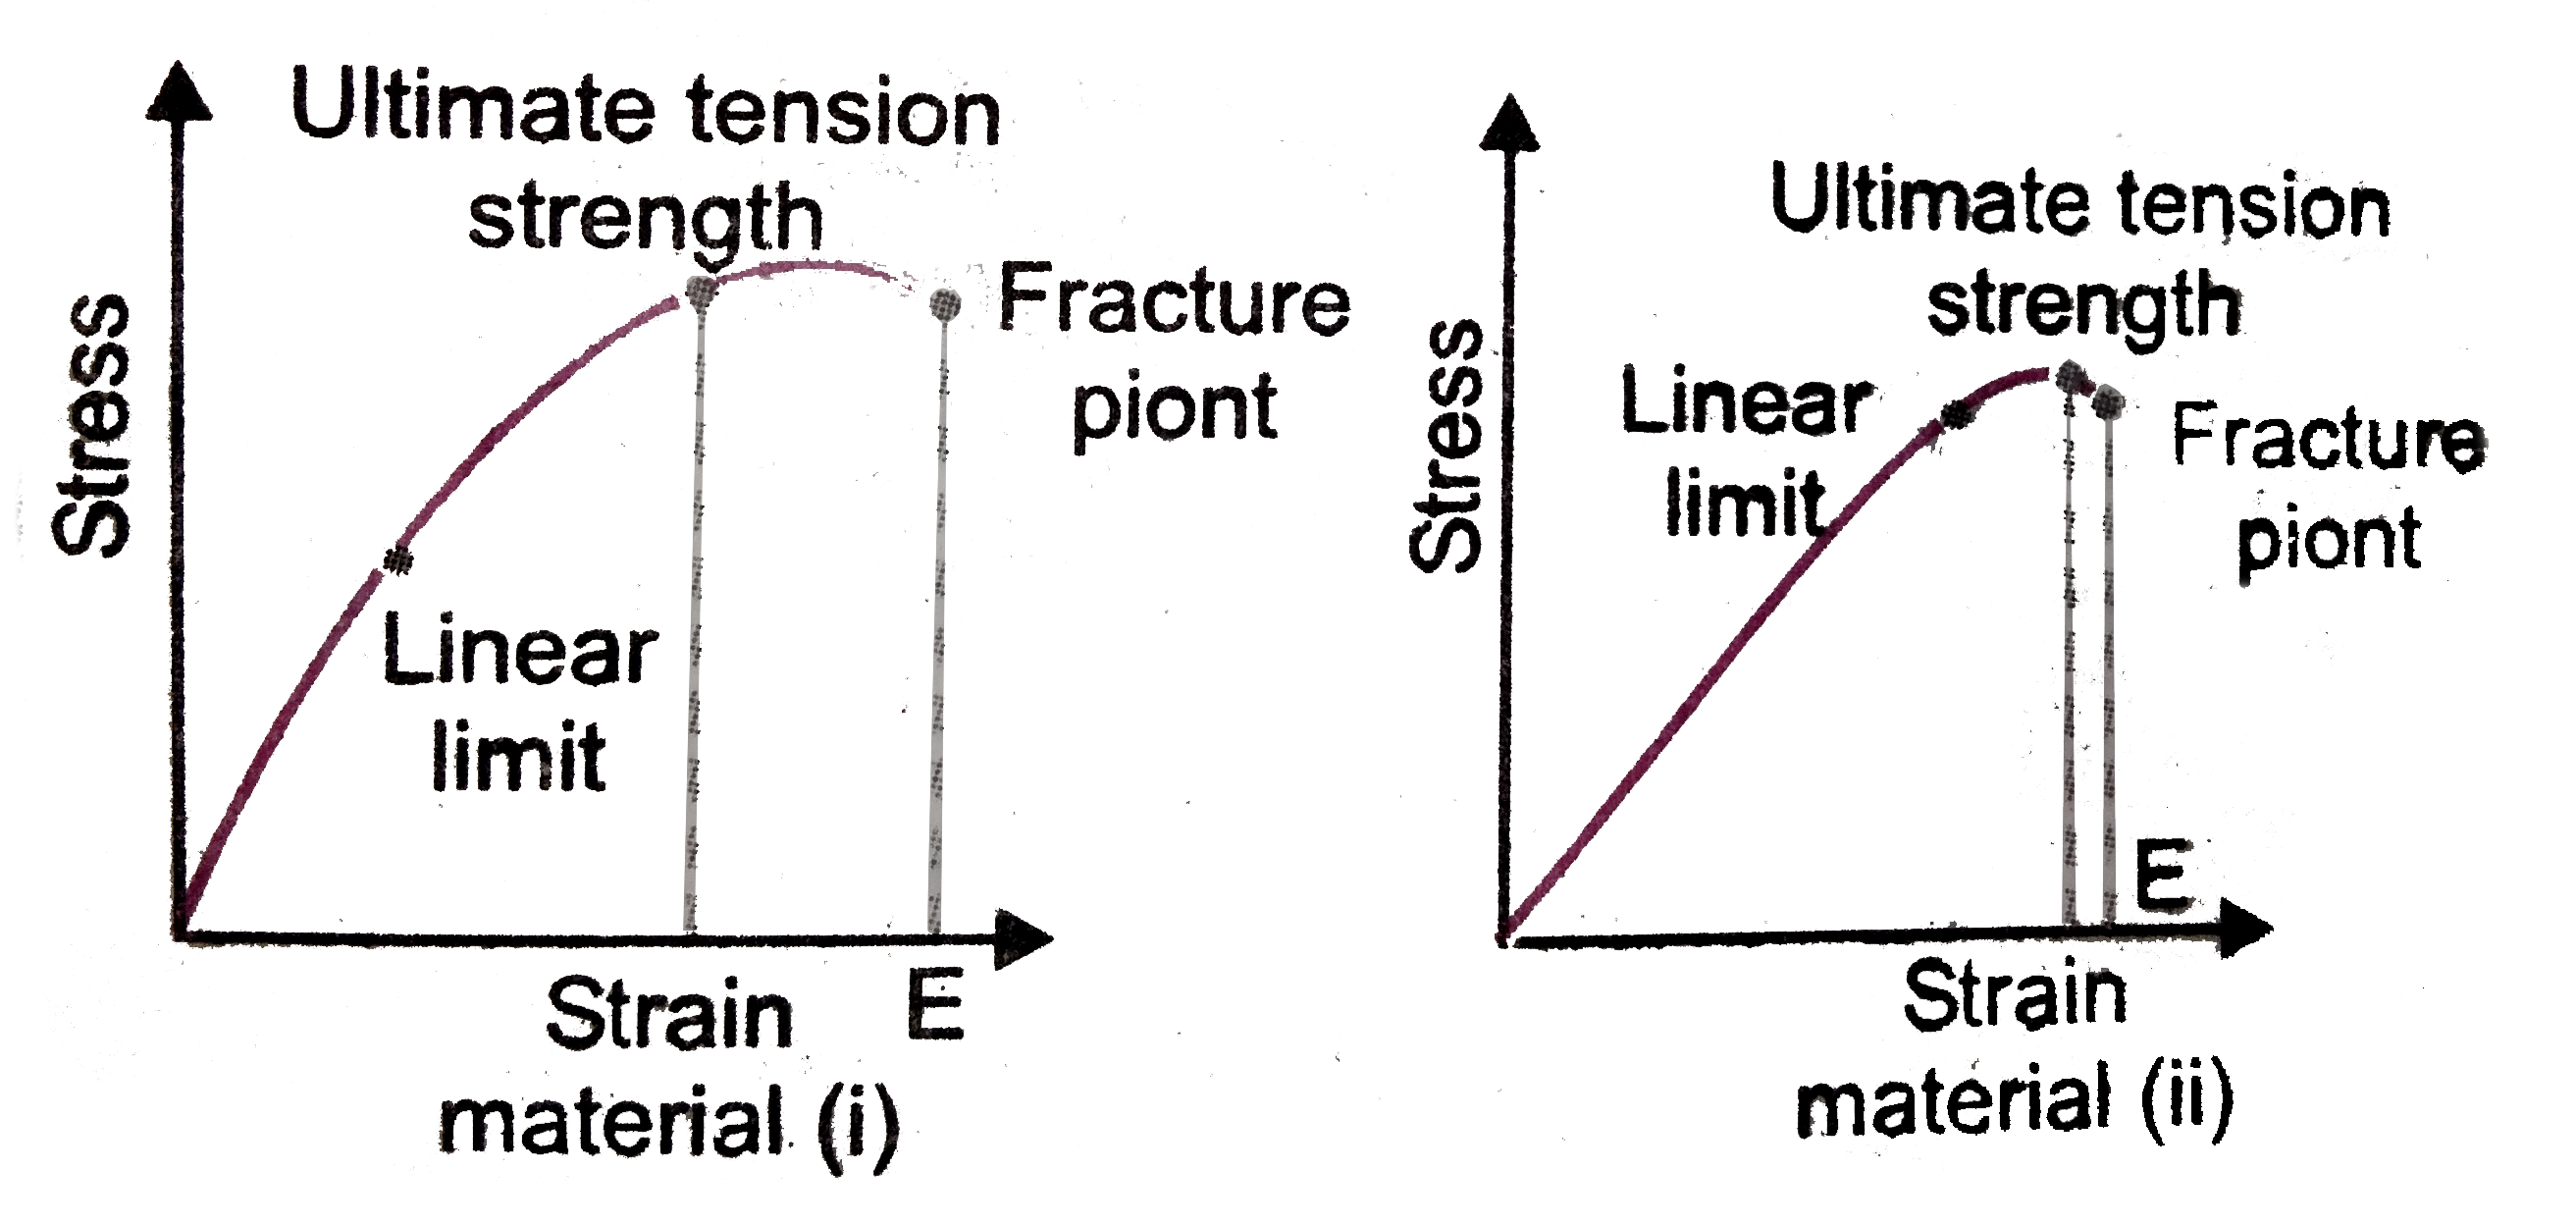 AMaterial (ii) is more elastic than material (i) and hence material (ii) is more brittle.BMaterial (i) and (ii) have the same elasticity and the same brittleness.CMaterial (ii) is elastic over a larger region of strain as compared to (i).DMaterial (ii) is more brittle than material (i).
 - Question 3 - Select One
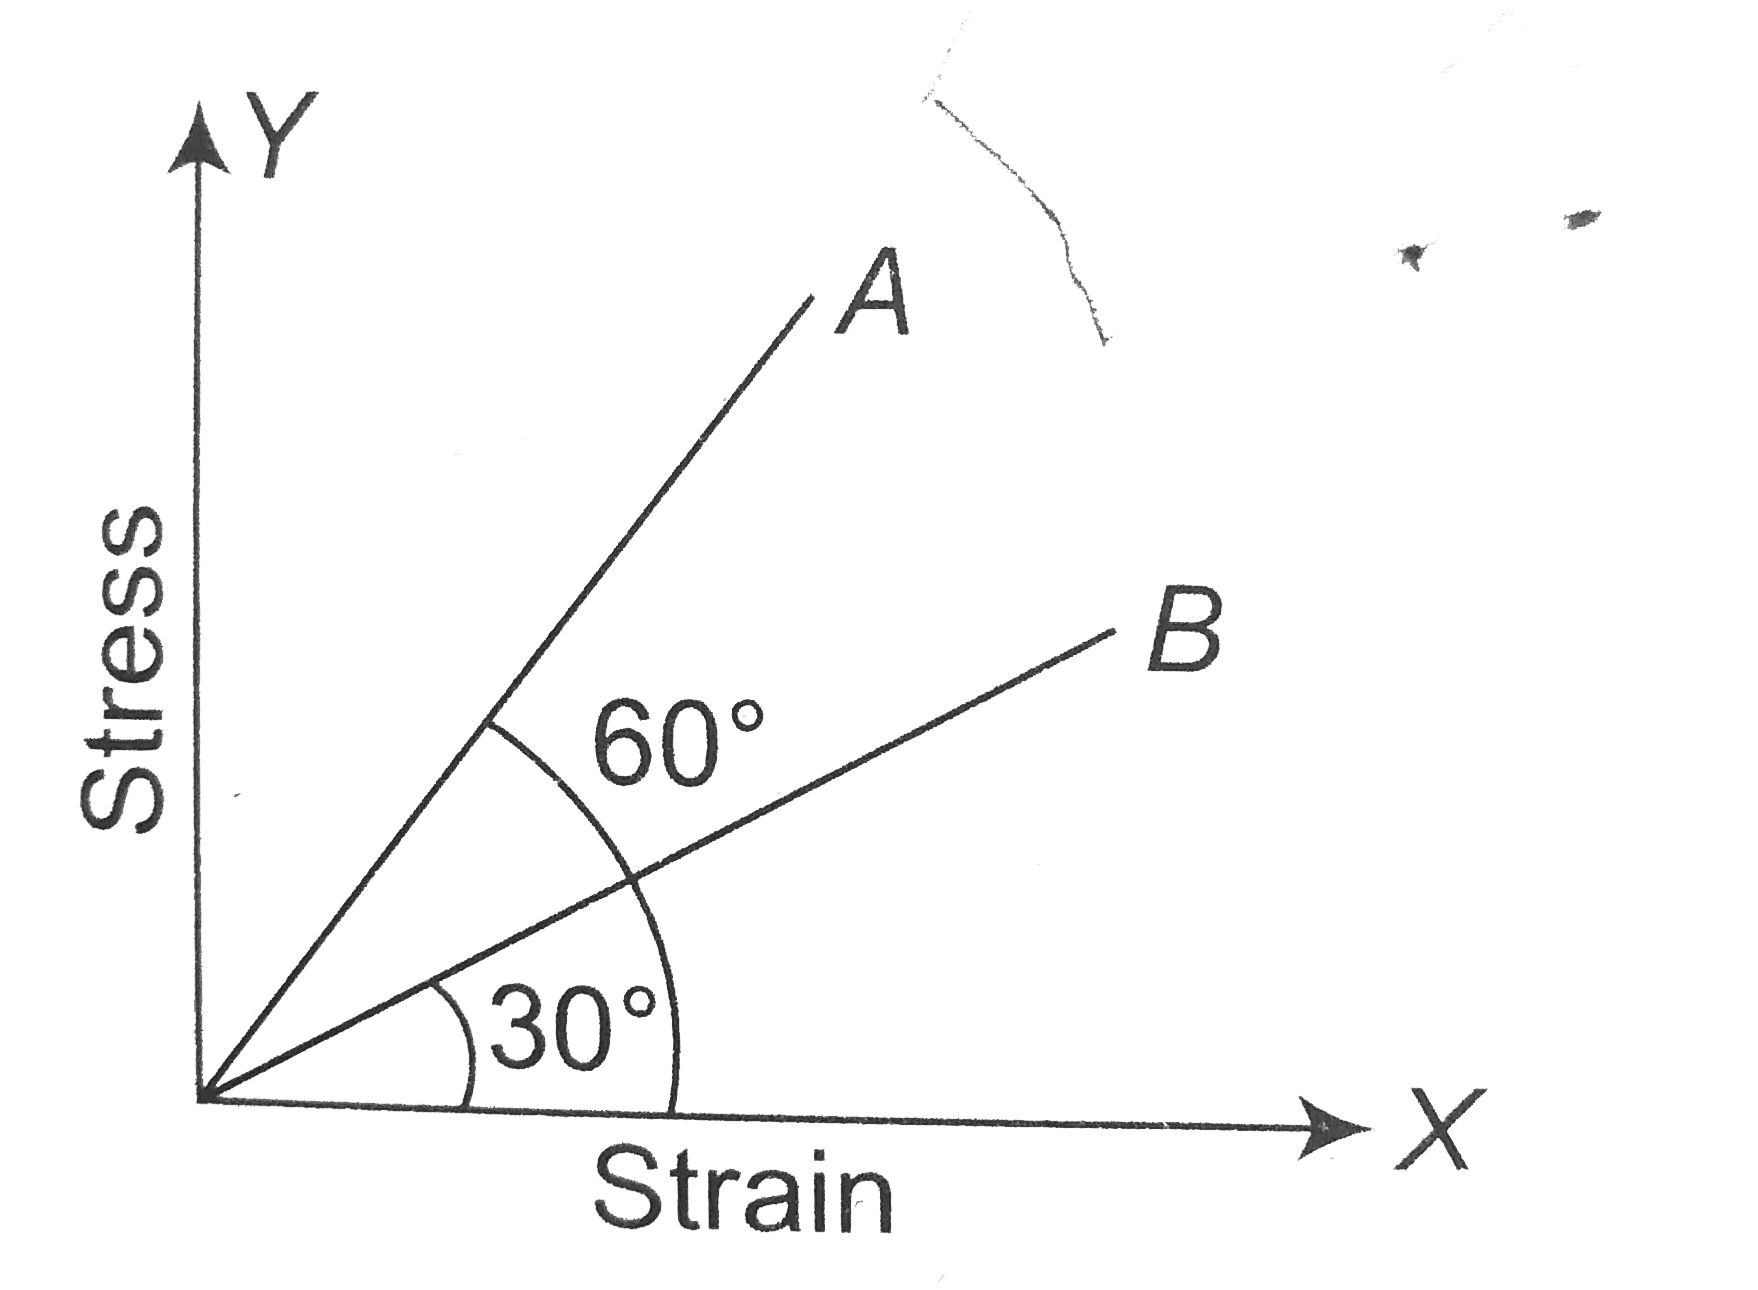
The stress versus strain graphs for wires of two materials A and B are as shown in the figure. If YA and YB are the Young's moduli of the materials thenAYB=2YABYA=YBCYB=3YADYA=3YB
The stress and strain graphs for two materials, A and B are shown here. Answer the following:
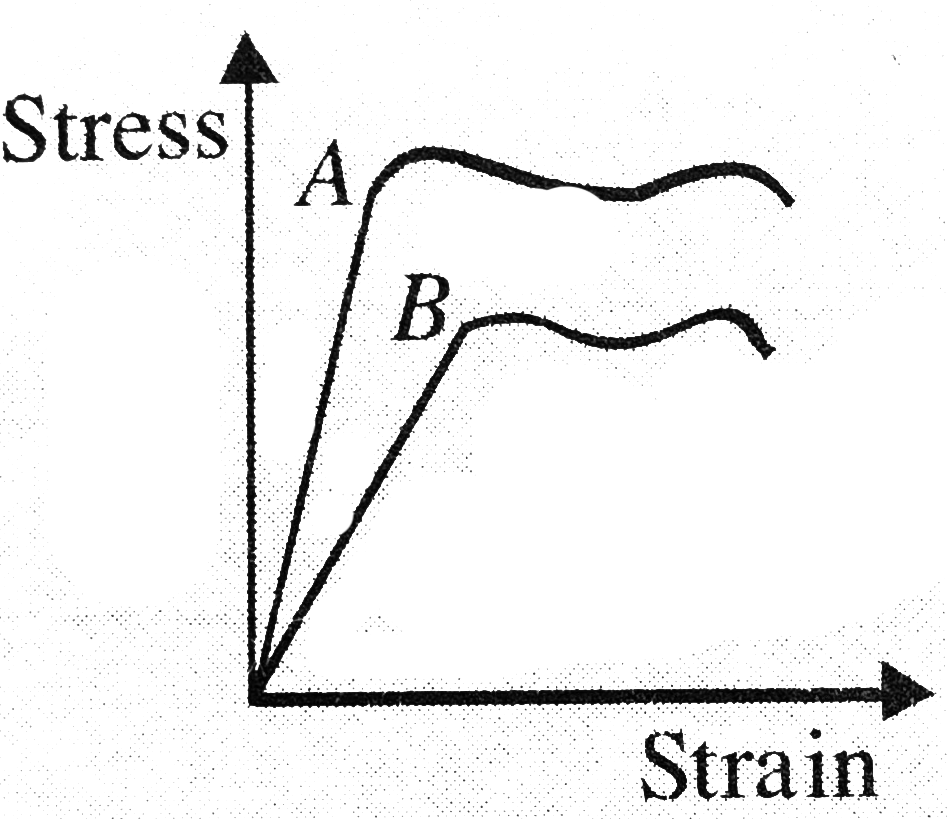 give reasonsView Solution
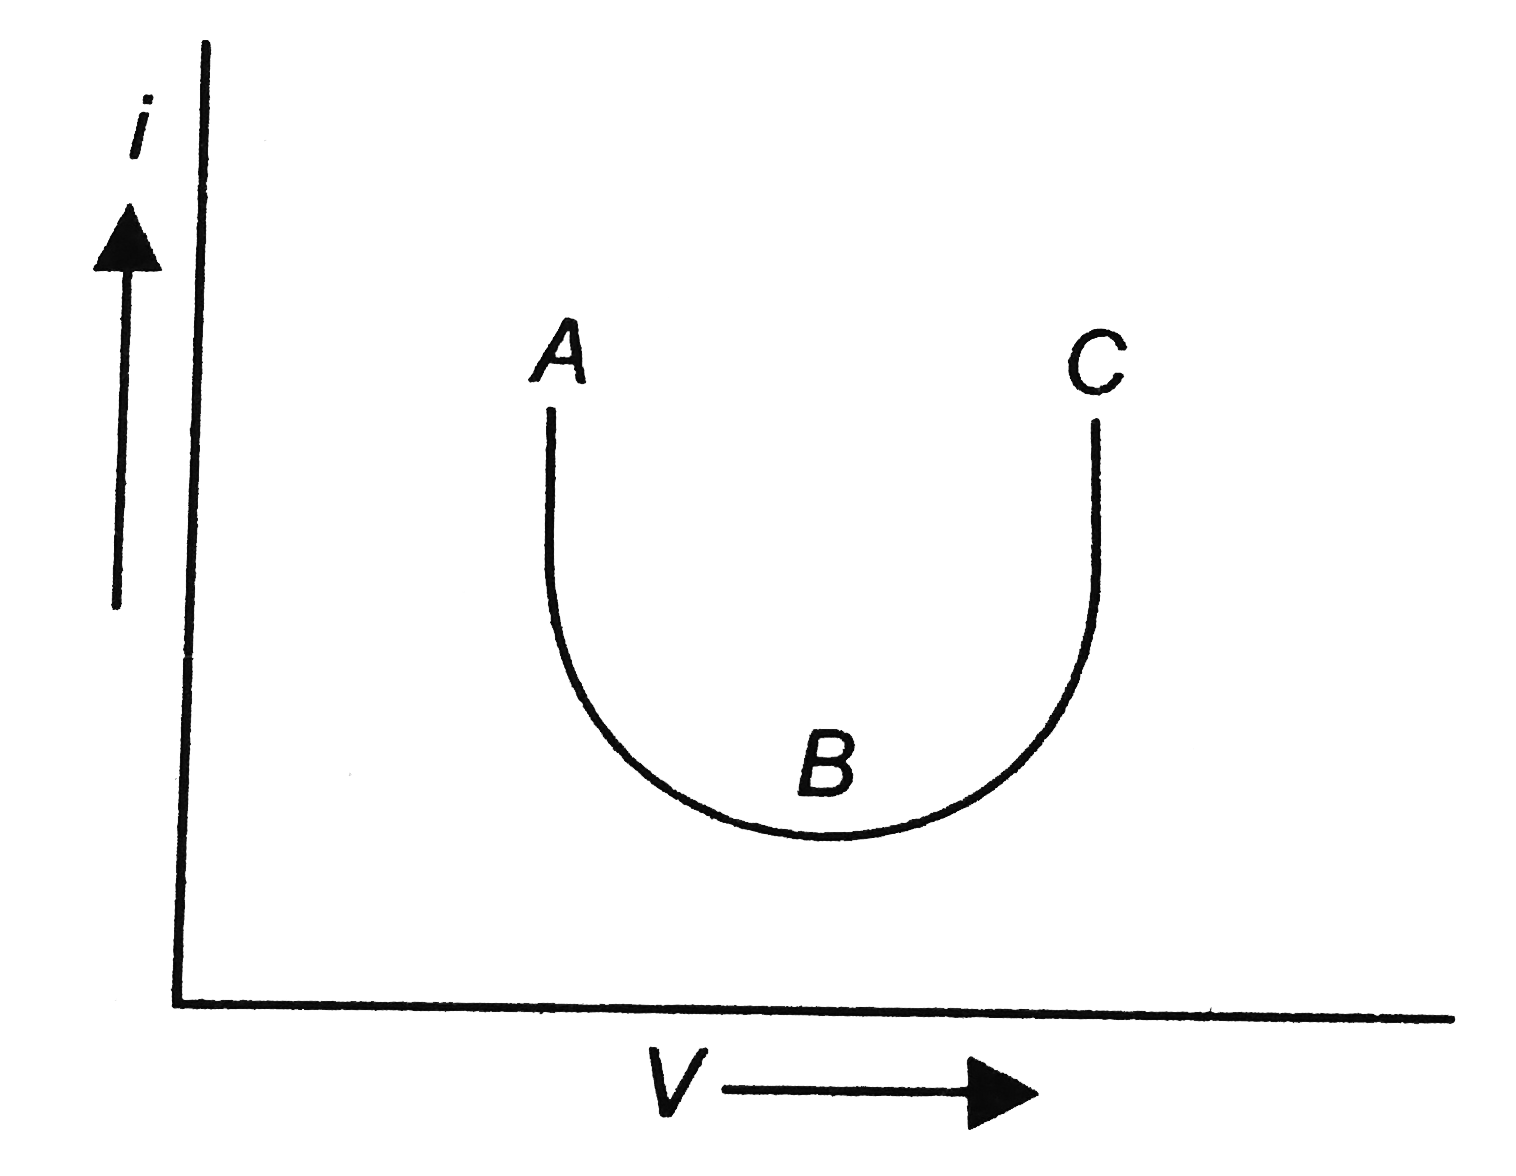
The current-voltage graph of a device is shown in figure. The resistance is negative in region.
 View Solution
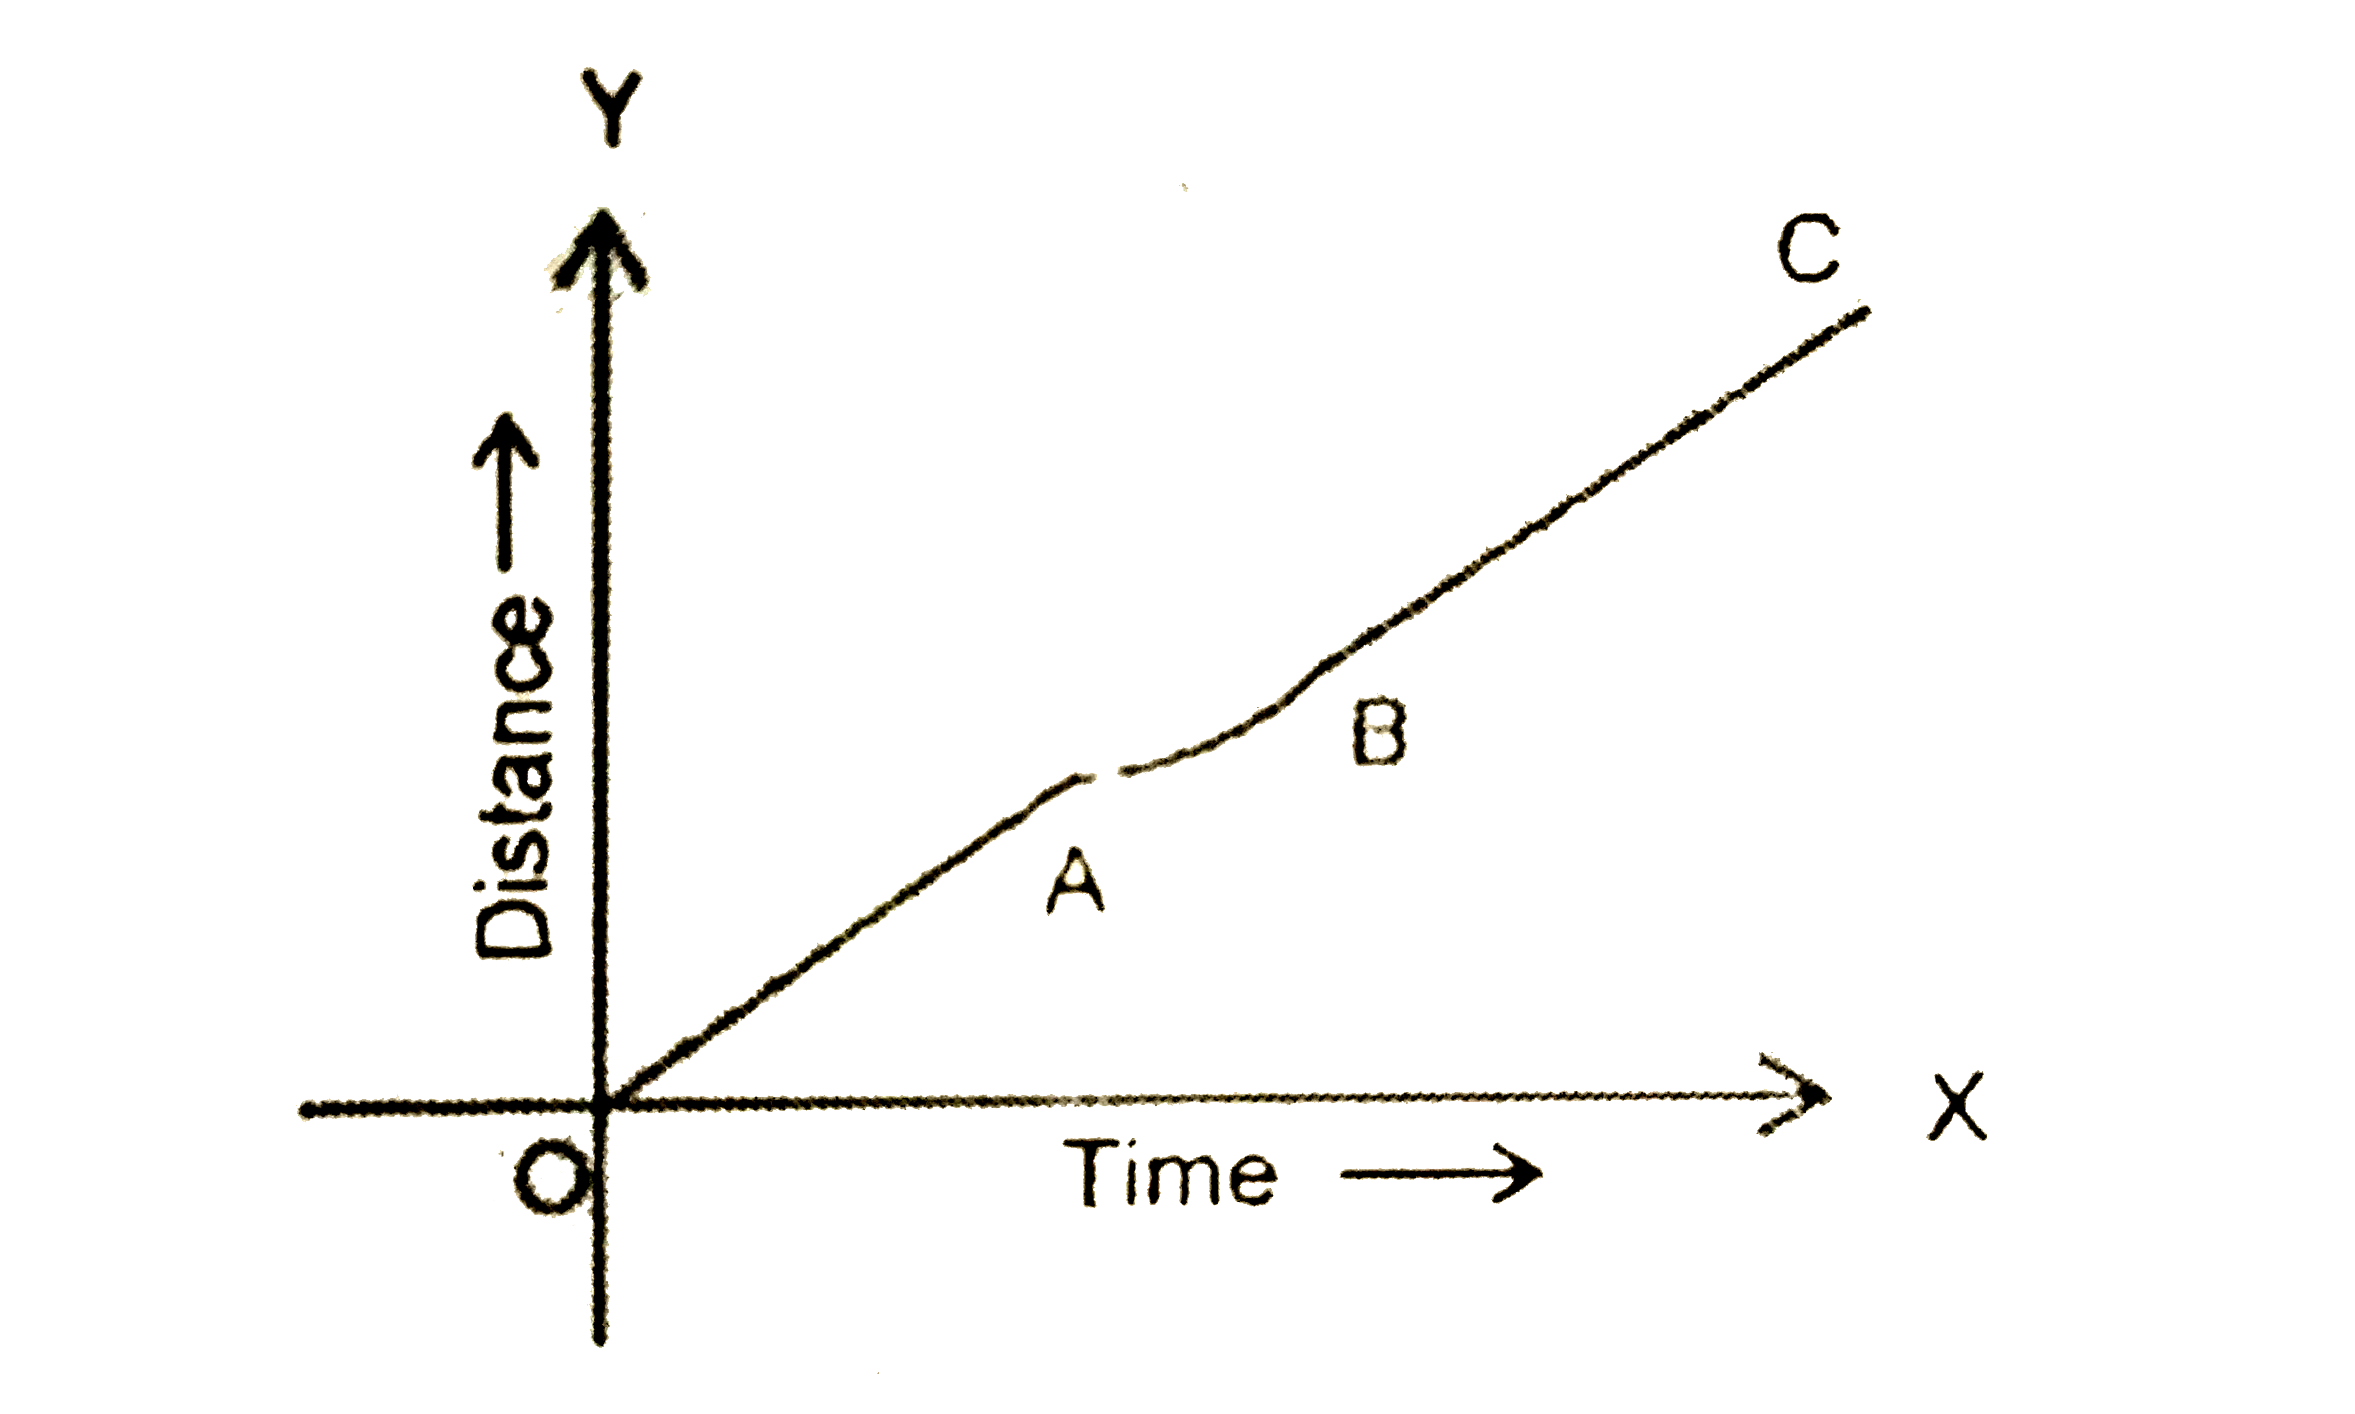
The distance- time graph of a body is as shown in the figure. The part of the graph that represent the unifrom speed of the body is
 View Solution
The graph between stress and strain represents the
View SolutionThe distance- time graph of a body is as shown in the figure. The part of the graph that represent the unifrom speed of the body is
 View Solution

