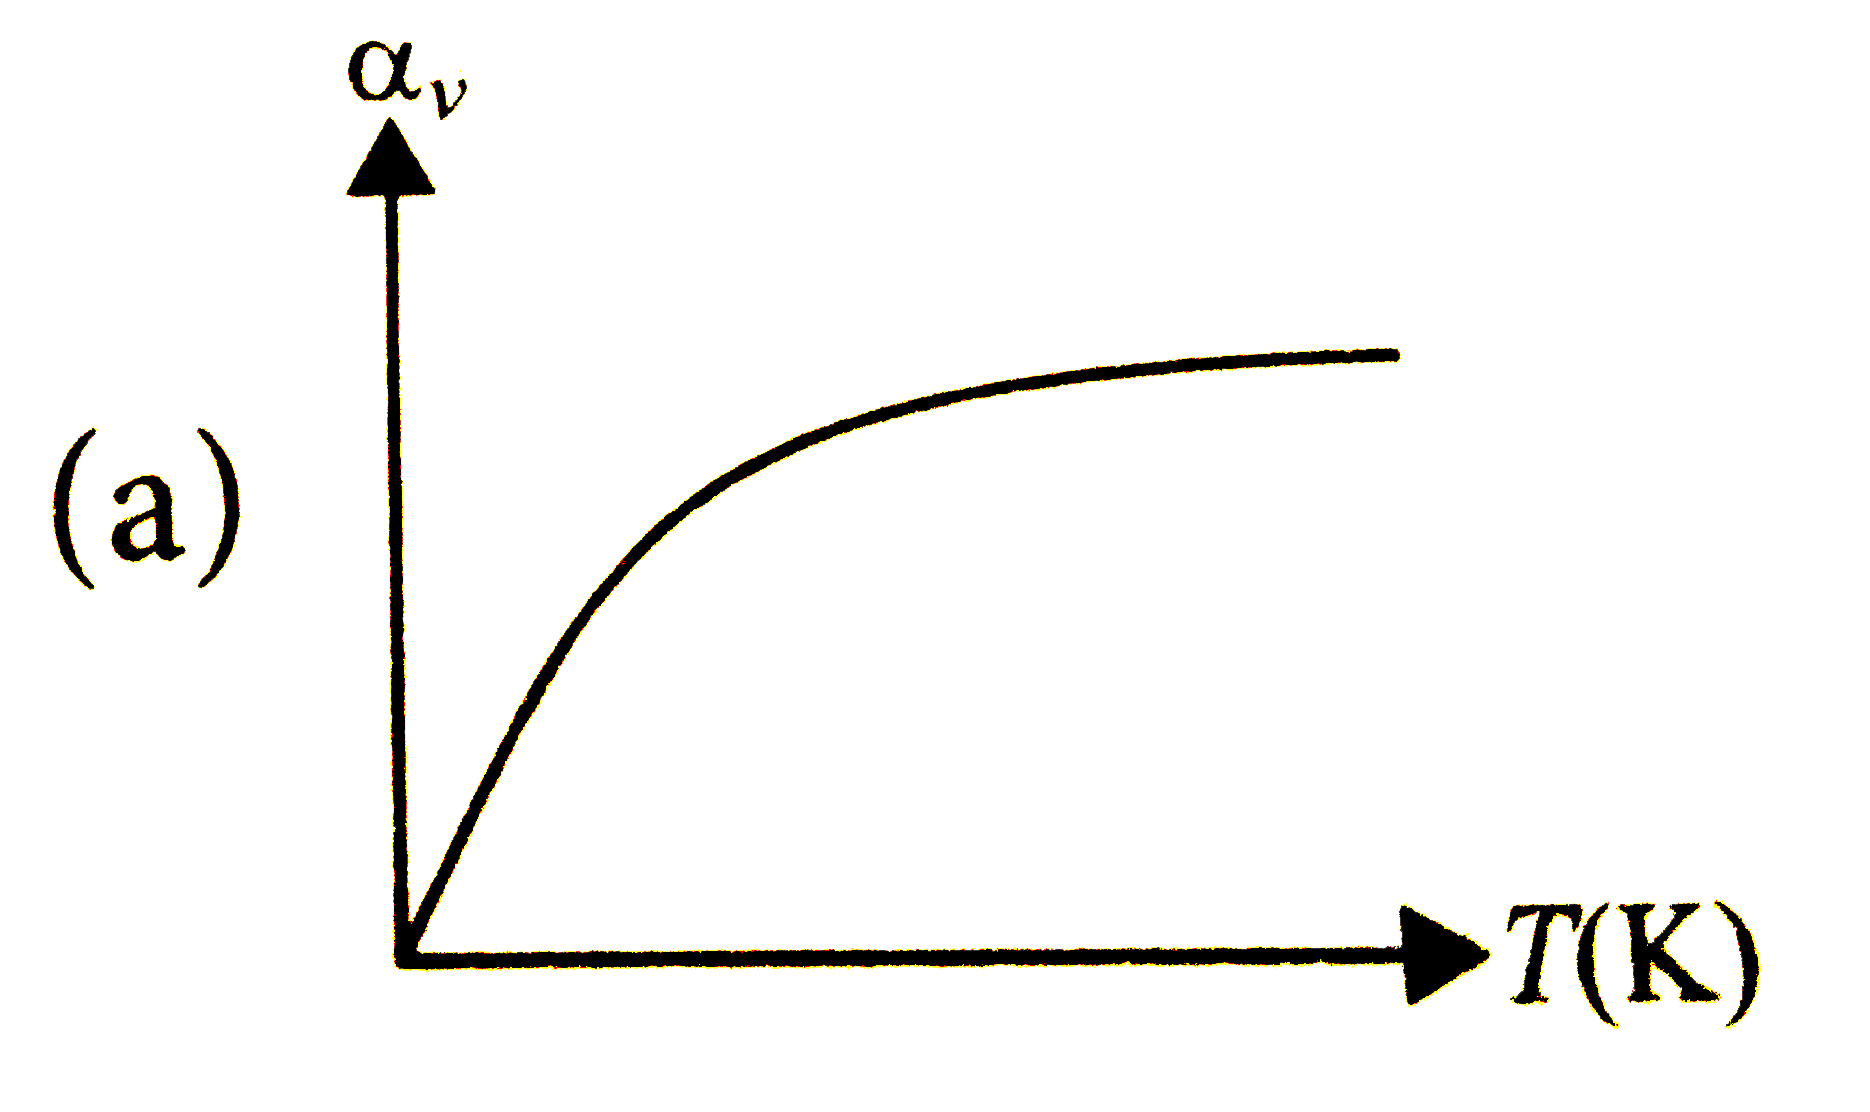
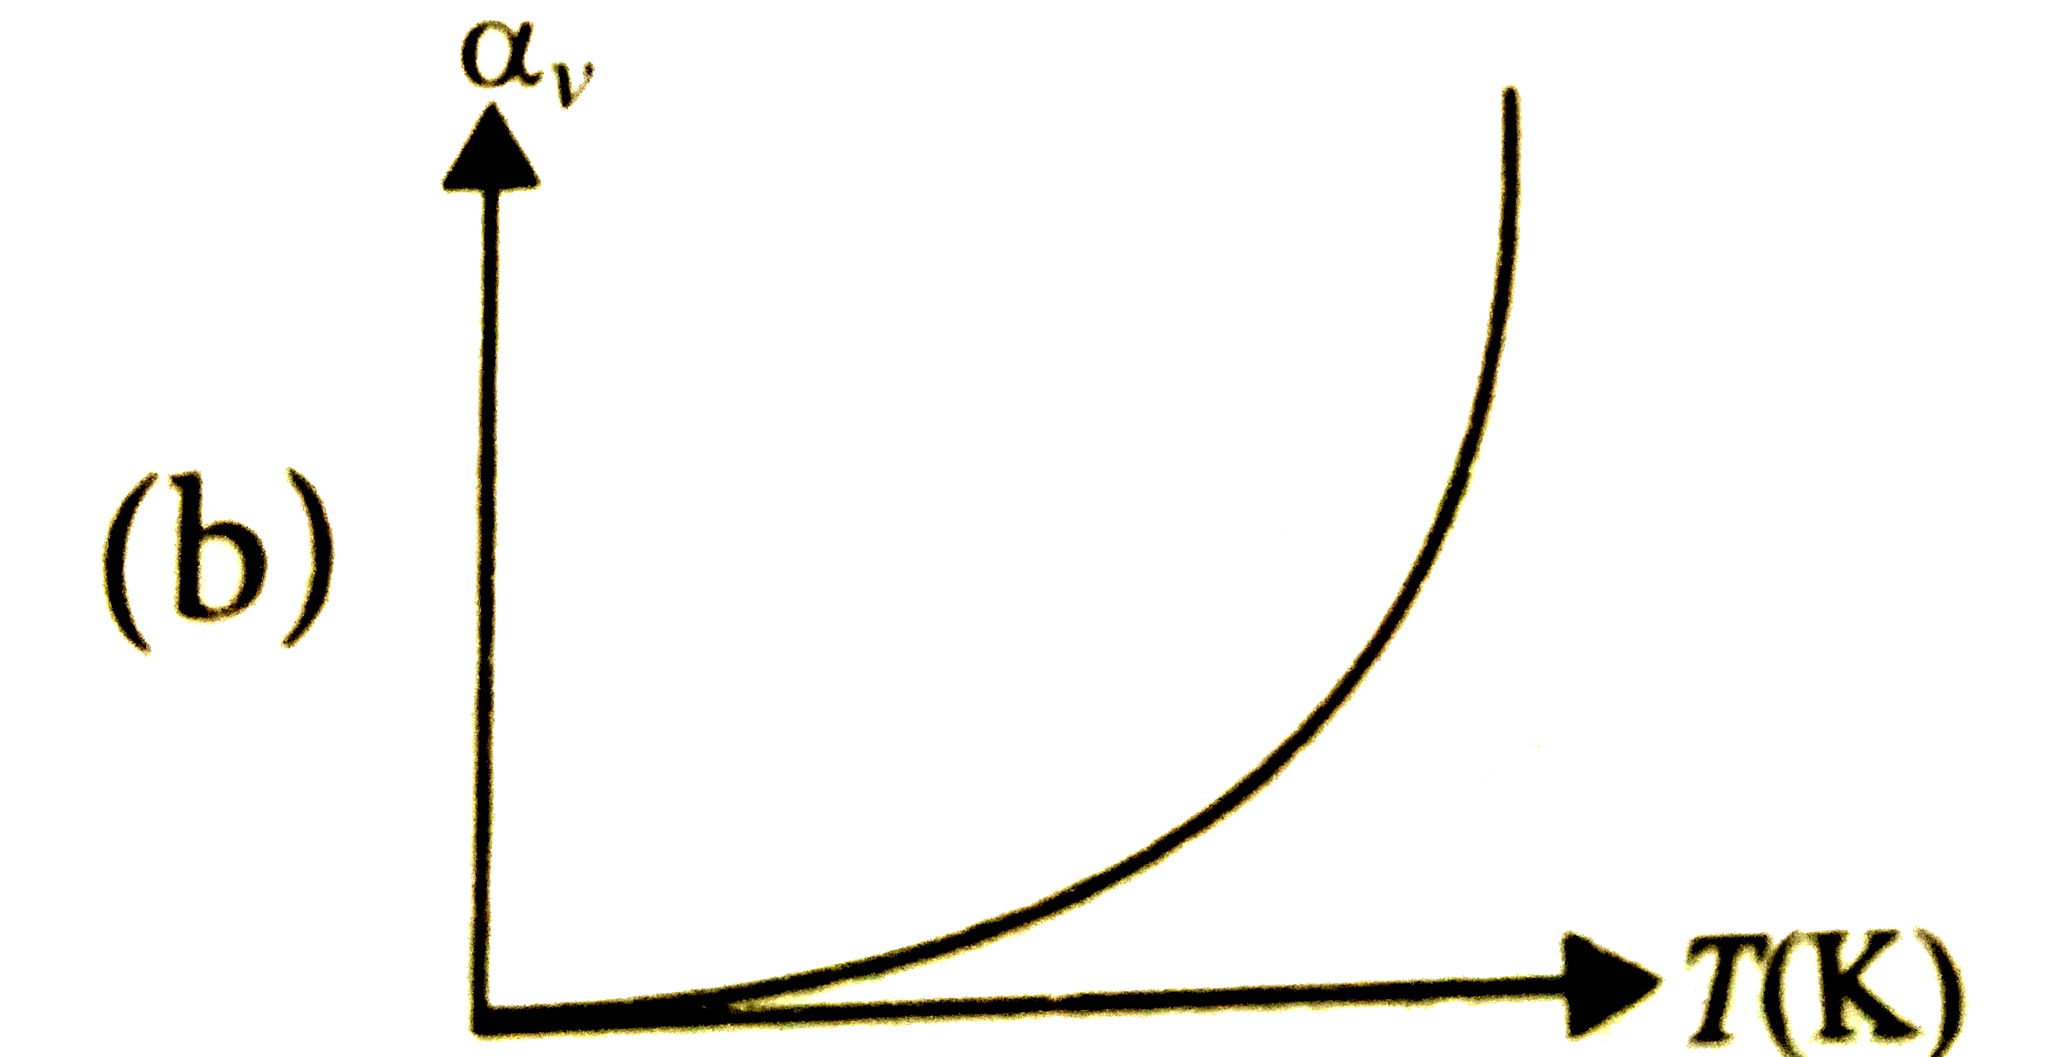
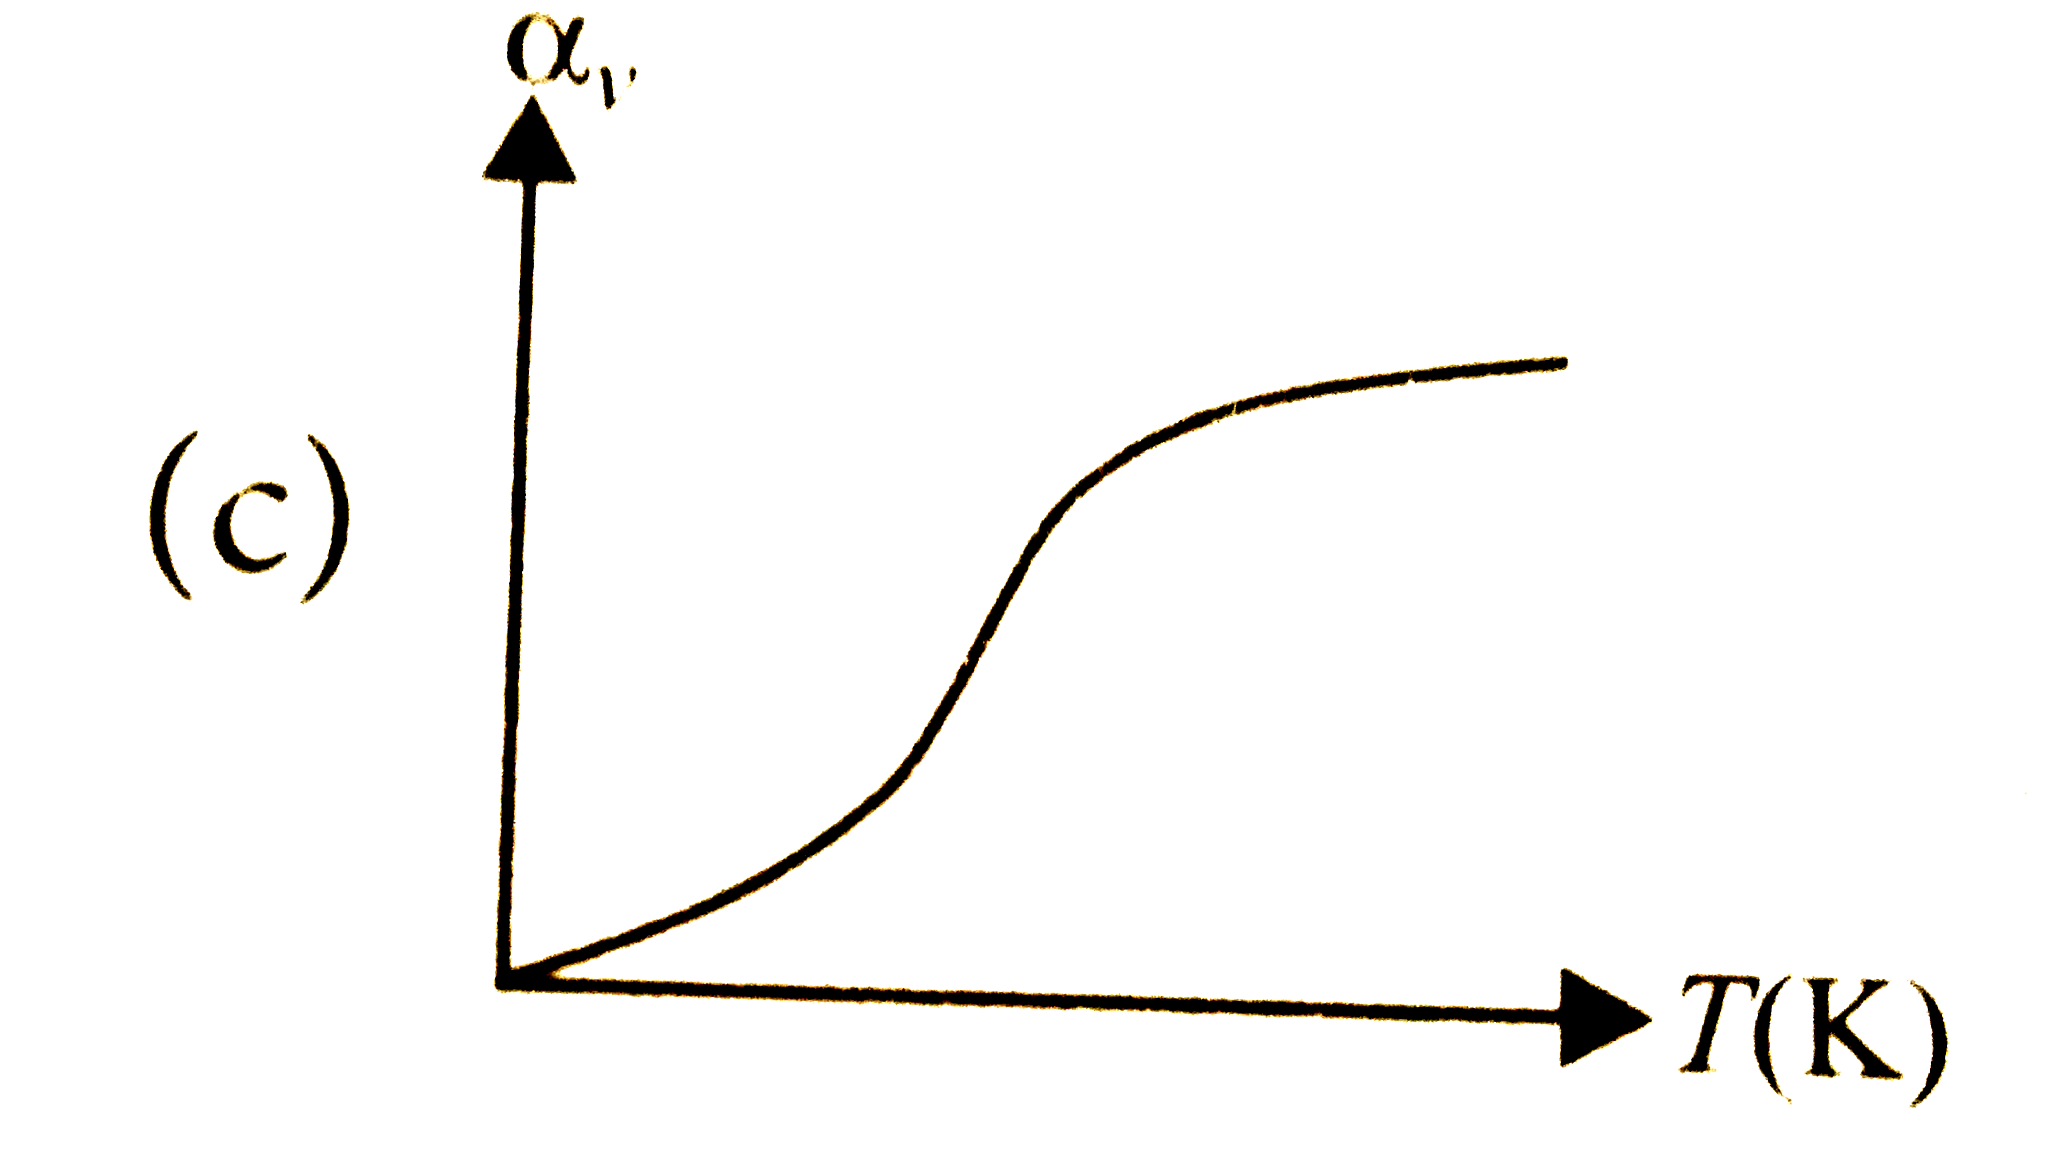
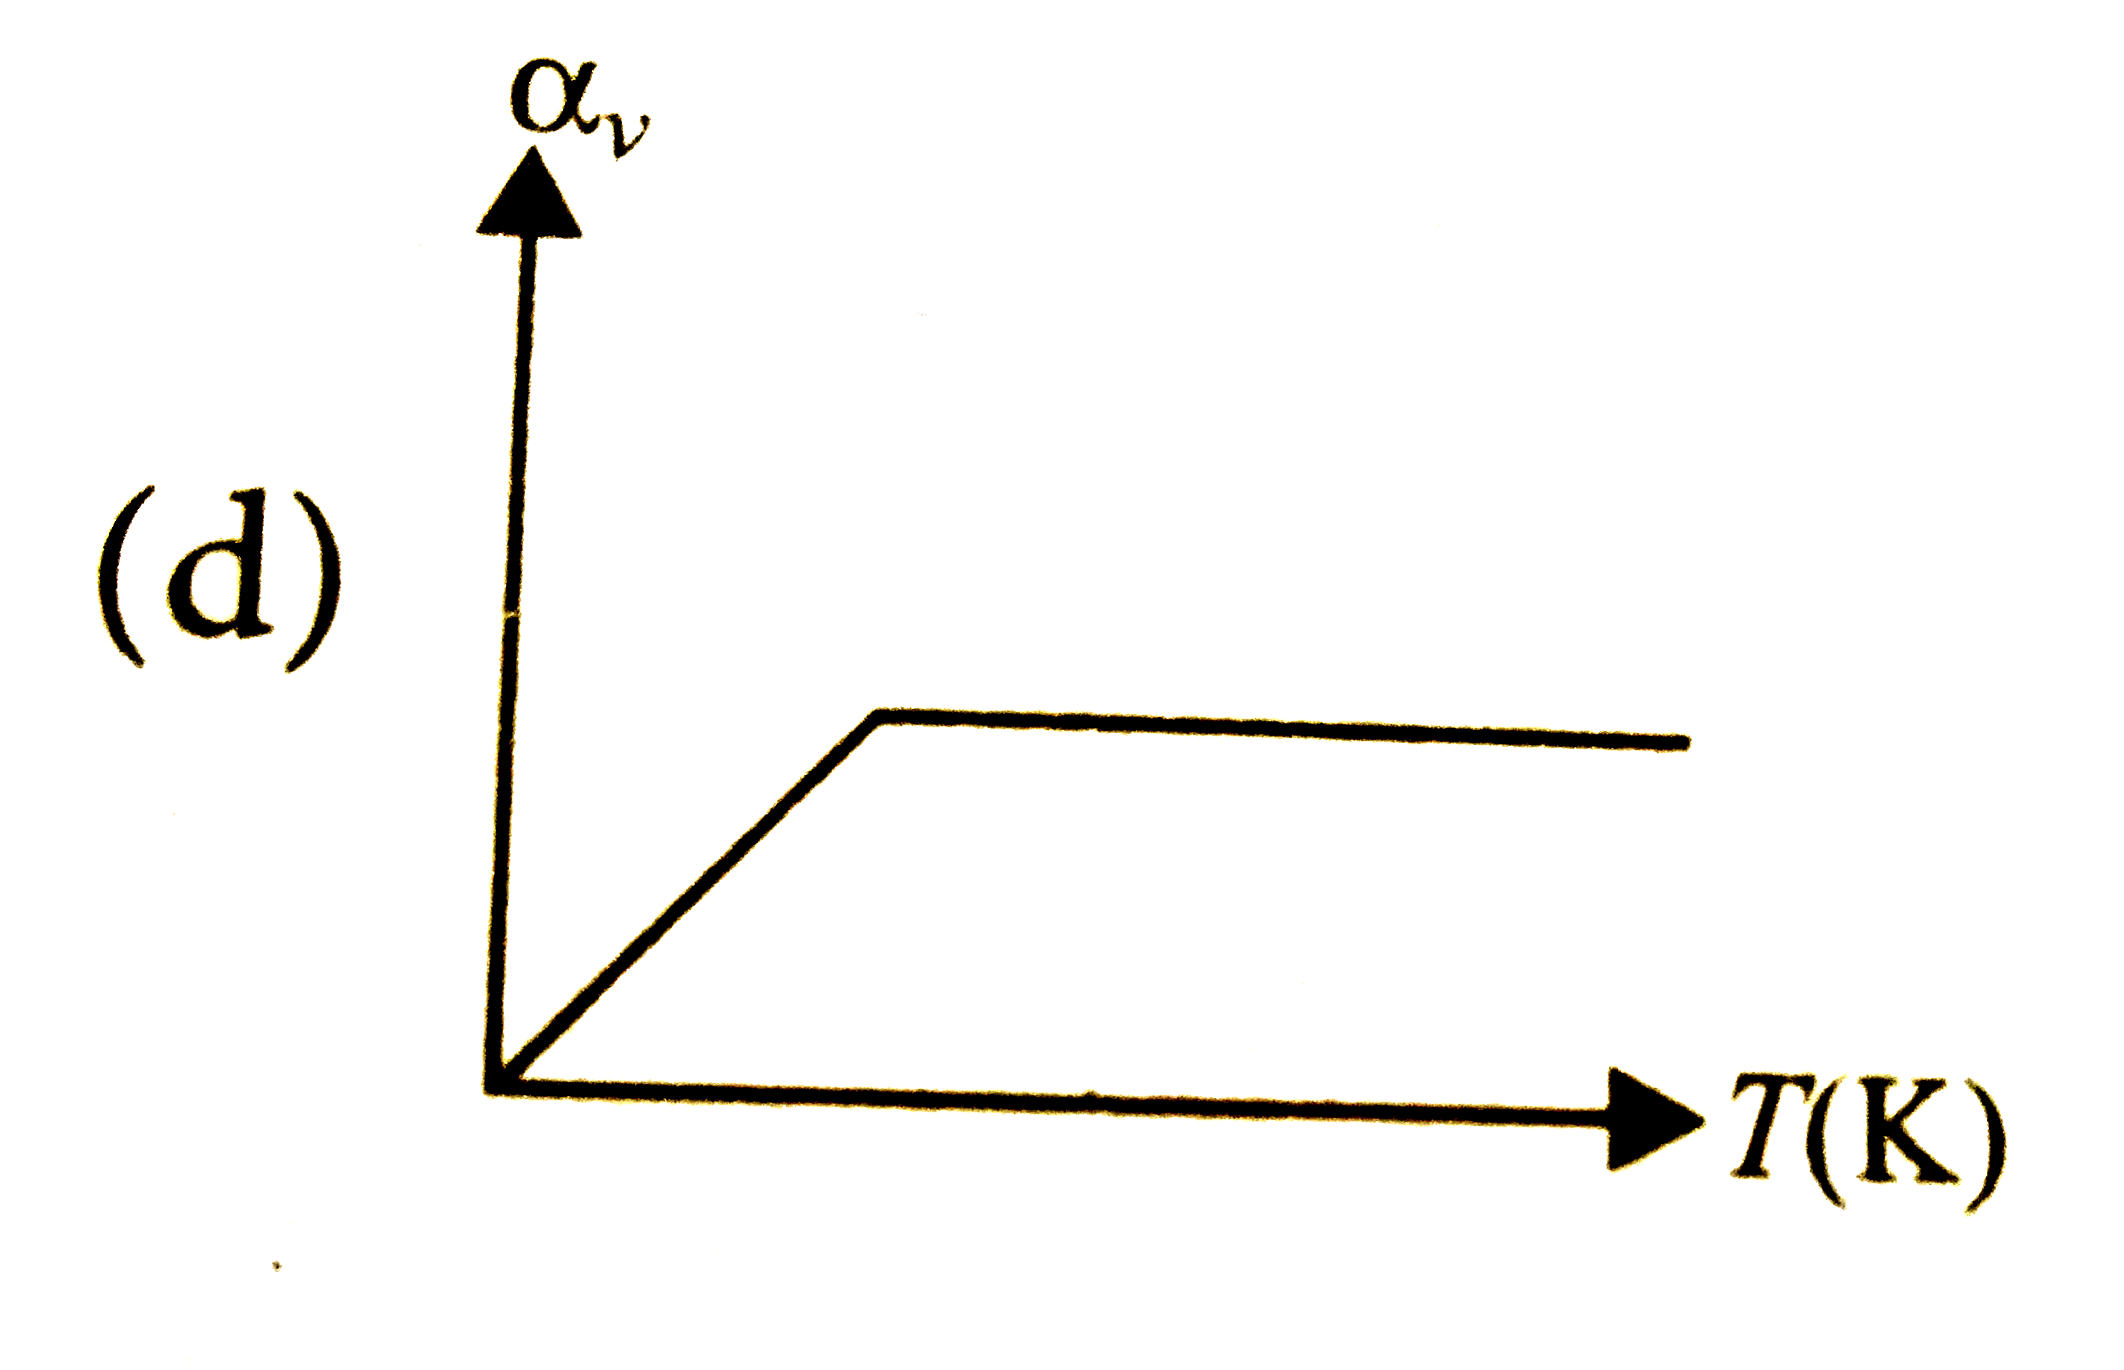
Which of the following graphs correctly shows variation of coefficient of volume expansion of copper as a function of temperature ?


The correct Answer is:C
To determine which graph correctly shows the variation of the coefficient of volume expansion of copper as a function of temperature, we can follow these steps:
Step 1: Understand the Concept of Volume Expansion
The coefficient of volume expansion (β) describes how the volume of a material changes with temperature. For most materials, including copper, this coefficient can vary with temperature.
Step 2: Analyze the Behavior of Volume Expansion with Temperature
- At lower temperatures, the volume expansion of copper is generally linear. This means that as the temperature increases, the volume expands in a predictable, linear manner.
- As the temperature continues to rise, the behavior of volume expansion becomes non-linear. This means that the rate of expansion increases at higher temperatures.
- After reaching a certain temperature, the coefficient of volume expansion may become constant, indicating that further increases in temperature do not significantly affect the volume expansion.
Step 3: Examine the Given Graphs
We need to look for a graph that:
- Starts with a linear increase in the coefficient of volume expansion at lower temperatures.
- Transitions to a non-linear increase as the temperature rises.
- Levels off and becomes constant after reaching a certain temperature.
Step 4: Identify the Correct Graph
Based on the characteristics described:
- The correct graph should show an initial linear increase followed by a non-linear increase, and then a plateau indicating a constant value after a certain temperature.
From the options provided, we find that Option C meets these criteria:
- Initially linear increase.
- Followed by a non-linear increase.
- Finally, a constant value after a specific temperature.
Conclusion
The correct option that represents the variation of the coefficient of volume expansion of copper as a function of temperature is Option C.
---
The coefficient of volume expansion (β) describes how the volume of a material changes with temperature. For most materials, including copper, this coefficient can vary with temperature.
- At lower temperatures, the volume expansion of copper is generally linear. This means that as the temperature increases, the volume expands in a predictable, linear manner.
- As the temperature continues to rise, the behavior of volume expansion becomes non-linear. This means that the rate of expansion increases at higher temperatures.
- After reaching a certain temperature, the coefficient of volume expansion may become constant, indicating that further increases in temperature do not significantly affect the volume expansion.
We need to look for a graph that:
- Starts with a linear increase in the coefficient of volume expansion at lower temperatures.
- Transitions to a non-linear increase as the temperature rises.
- Levels off and becomes constant after reaching a certain temperature.
Based on the characteristics described:
- The correct graph should show an initial linear increase followed by a non-linear increase, and then a plateau indicating a constant value after a certain temperature.
- Initially linear increase.
- Followed by a non-linear increase.
- Finally, a constant value after a specific temperature.
The correct option that represents the variation of the coefficient of volume expansion of copper as a function of temperature is Option C.
Topper's Solved these Questions
- THERMAL PROPERTIES OF MATTERBOOK - NCERT FINGERTIPSCHAPTER - THERMAL PROPERTIES OF MATTEREXERCISE - Specific Heat Capacity
5 Videos
- THERMAL PROPERTIES OF MATTERBOOK - NCERT FINGERTIPSCHAPTER - THERMAL PROPERTIES OF MATTEREXERCISE - Calorimetry
4 Videos
- THERMAL PROPERTIES OF MATTERBOOK - NCERT FINGERTIPSCHAPTER - THERMAL PROPERTIES OF MATTEREXERCISE - Measurement Of Temperature
2 Videos
- SYSTEM OF PARTICLES AND ROTATIONAL MOTIONSBOOK - NCERT FINGERTIPSCHAPTER - SYSTEM OF PARTICLES AND ROTATIONAL MOTIONSEXERCISE - Assertion And Reason
15 Videos
- THERMODYNAMICSBOOK - NCERT FINGERTIPSCHAPTER - THERMODYNAMICSEXERCISE - Assertion And Reason
15 Videos
Similar Questions
Knowledge Check
the coefficient of volume expansion is
Atwice the coefficient of linear expansion.Btwice the coefficient of real expansion.Cthrice the coefficient of real expansion.Dthrice the coefficient of linear expansion.the coefficient of volume expansion is
Aequal to the coefficient of linear expansionBtwice the coefficien of linear expansionCequal to the sum of coefficient of linear and superficial expansions.DTwice the coefficient of areal expansion.Coefficient of volume expansion of a gas is:
A1273B2273C3273D4273
Show variation of resistivity of copper as a function of temperature in a graph.
View SolutionWhich of the following graph is correctly represented?
View SolutionThe value of coefficient of volume expansion of glycerin is 5×10⁴K−1 . The fractional change in temperature is :
View SolutionWhich of the following graphs shows variation between density of water and temperature?
View SolutionWhich of the following graphs correctly represents the variation of β=−(dV/dP)/V with P for an ideal gas at constant temperature?
View Solution
