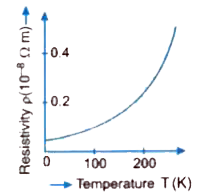
Show variation of resistivity of copper as a function of temperature in a graph.
Variation of resistivity of copper as a function of temperature is shown in Fig.
Topper's Solved these Questions
- CURRENT ELECTRICITY BOOK - U-LIKE SERIESCHAPTER - CURRENT ELECTRICITY EXERCISE - SHORT ANSWER QUESTIONS
42 Videos
- CURRENT ELECTRICITY BOOK - U-LIKE SERIESCHAPTER - CURRENT ELECTRICITY EXERCISE - LONG ANSWER QUESTIONS - I
47 Videos
- CURRENT ELECTRICITY BOOK - U-LIKE SERIESCHAPTER - CURRENT ELECTRICITY EXERCISE - ASSERTION-REASON TYPE QUESTIONS
5 Videos
- CBSE SAMPLE QUESTION PAPER 2019-20 (SOLVED)BOOK - U-LIKE SERIESCHAPTER - CBSE SAMPLE QUESTION PAPER 2019-20 (SOLVED)EXERCISE - SECTION D
6 Videos
- DUAL NATURE OF RADIATION AND MATTERBOOK - U-LIKE SERIESCHAPTER - DUAL NATURE OF RADIATION AND MATTEREXERCISE - SELF ASSESSMENT TEST SECTION-C (VERY SHORT ANSWER QUESTIONS)
3 Videos
Similar Questions
Knowledge Check
Which of the following graphs correctly shows variation of coefficient of volume expansion of copper as a function of temperature ?
A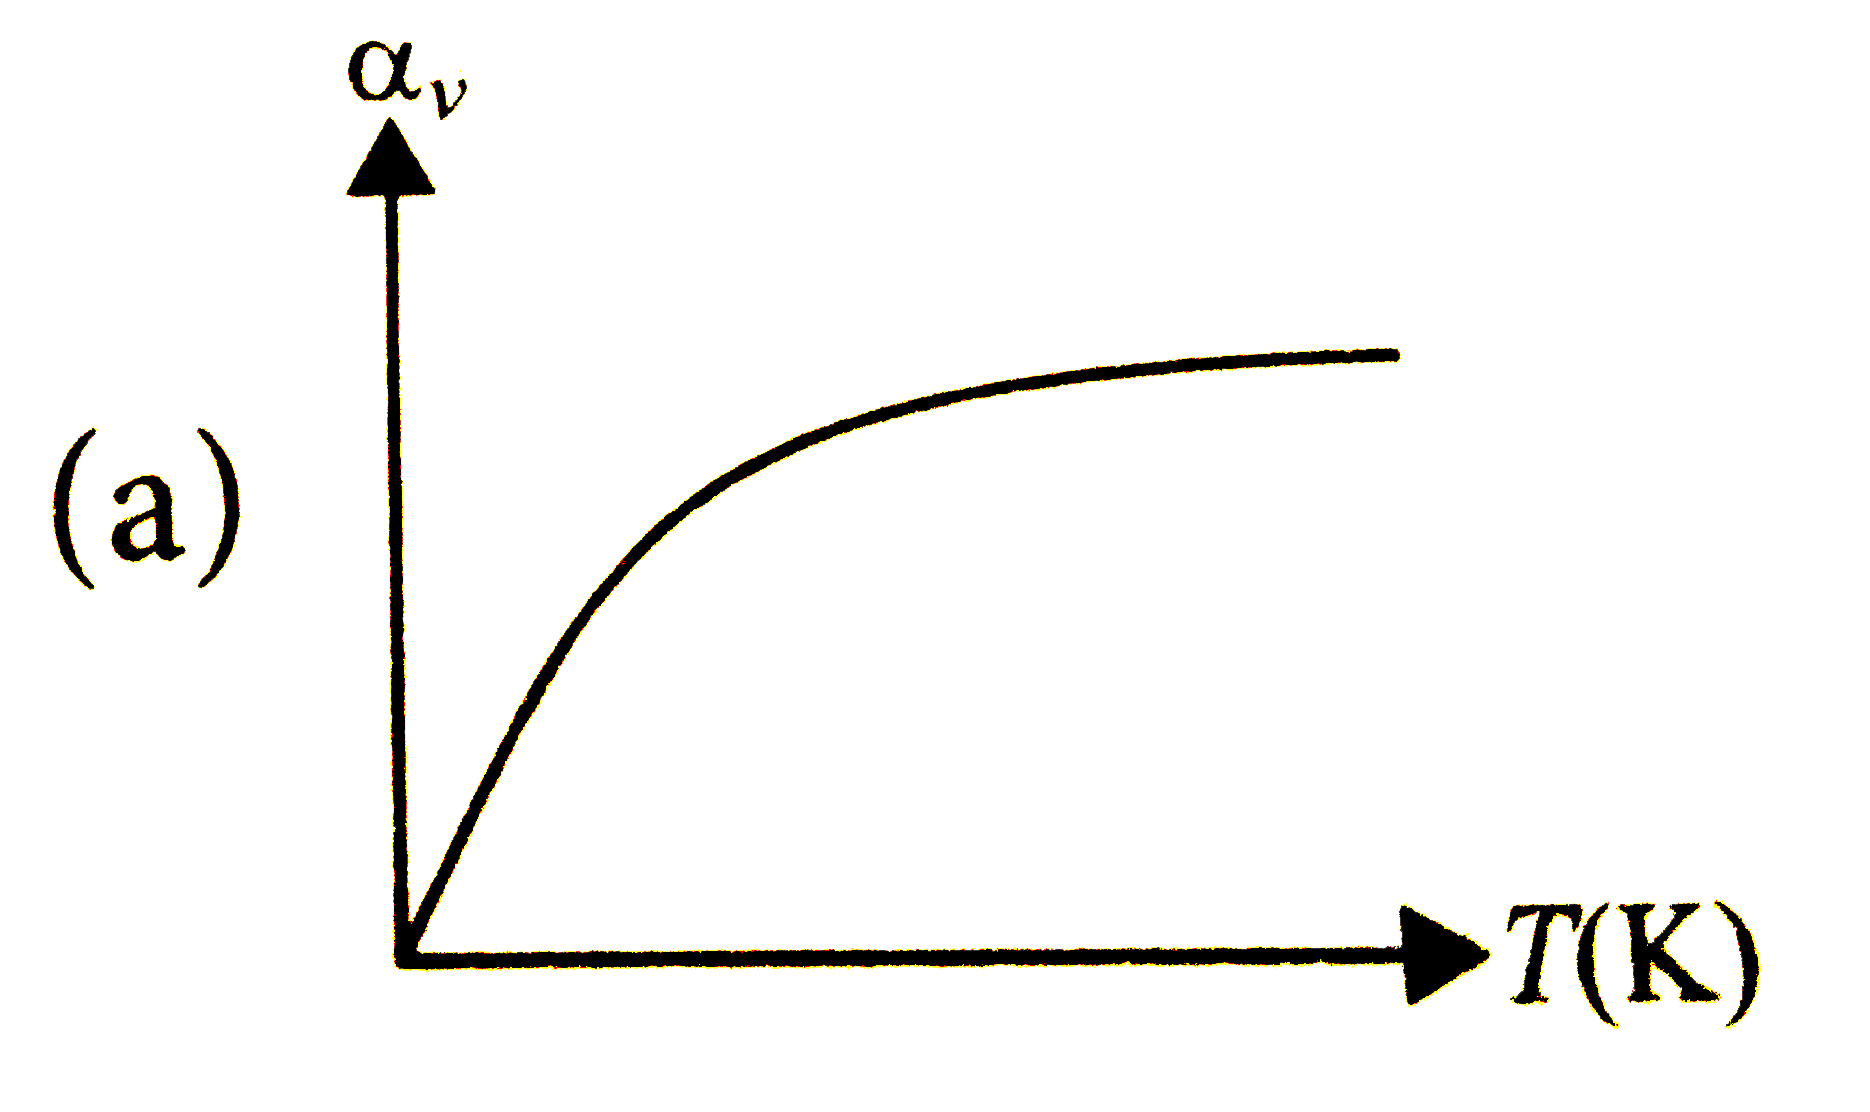 B
B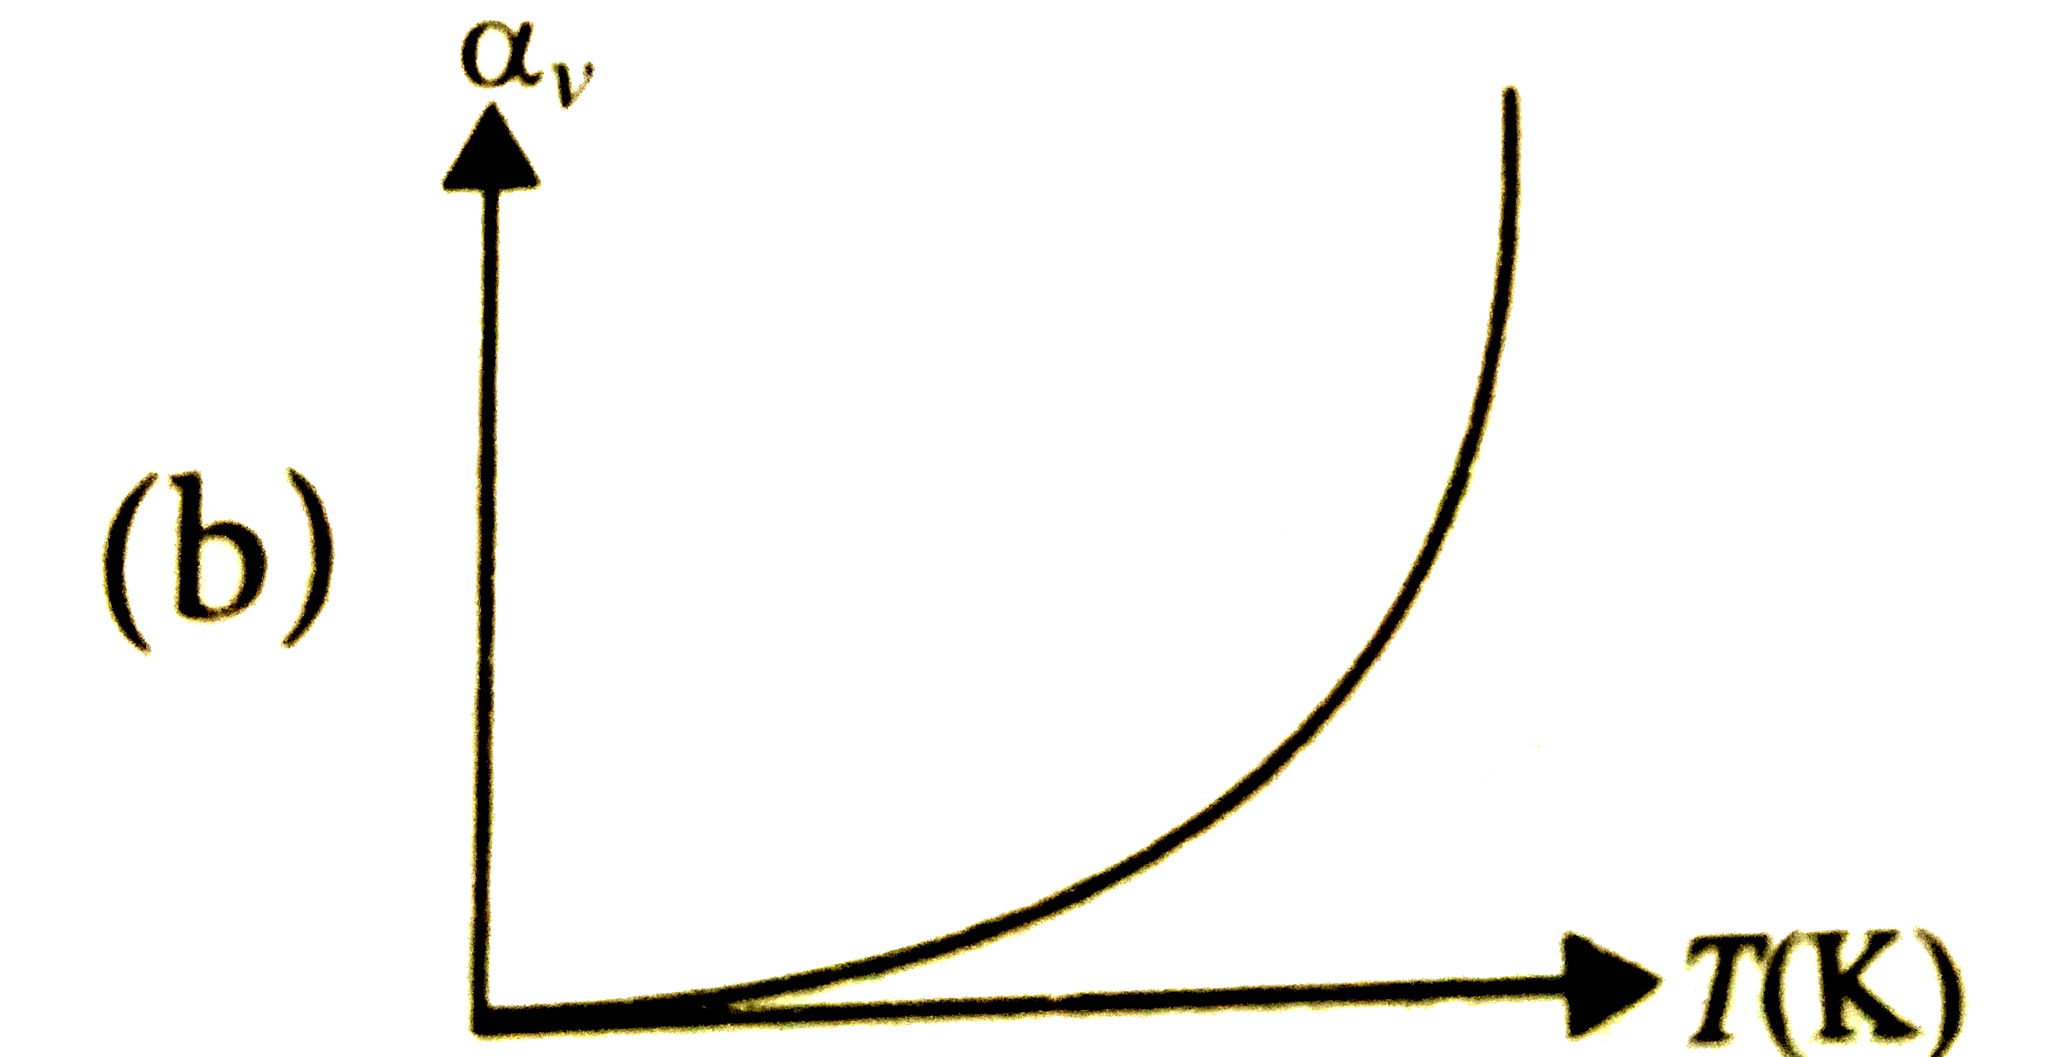 C
C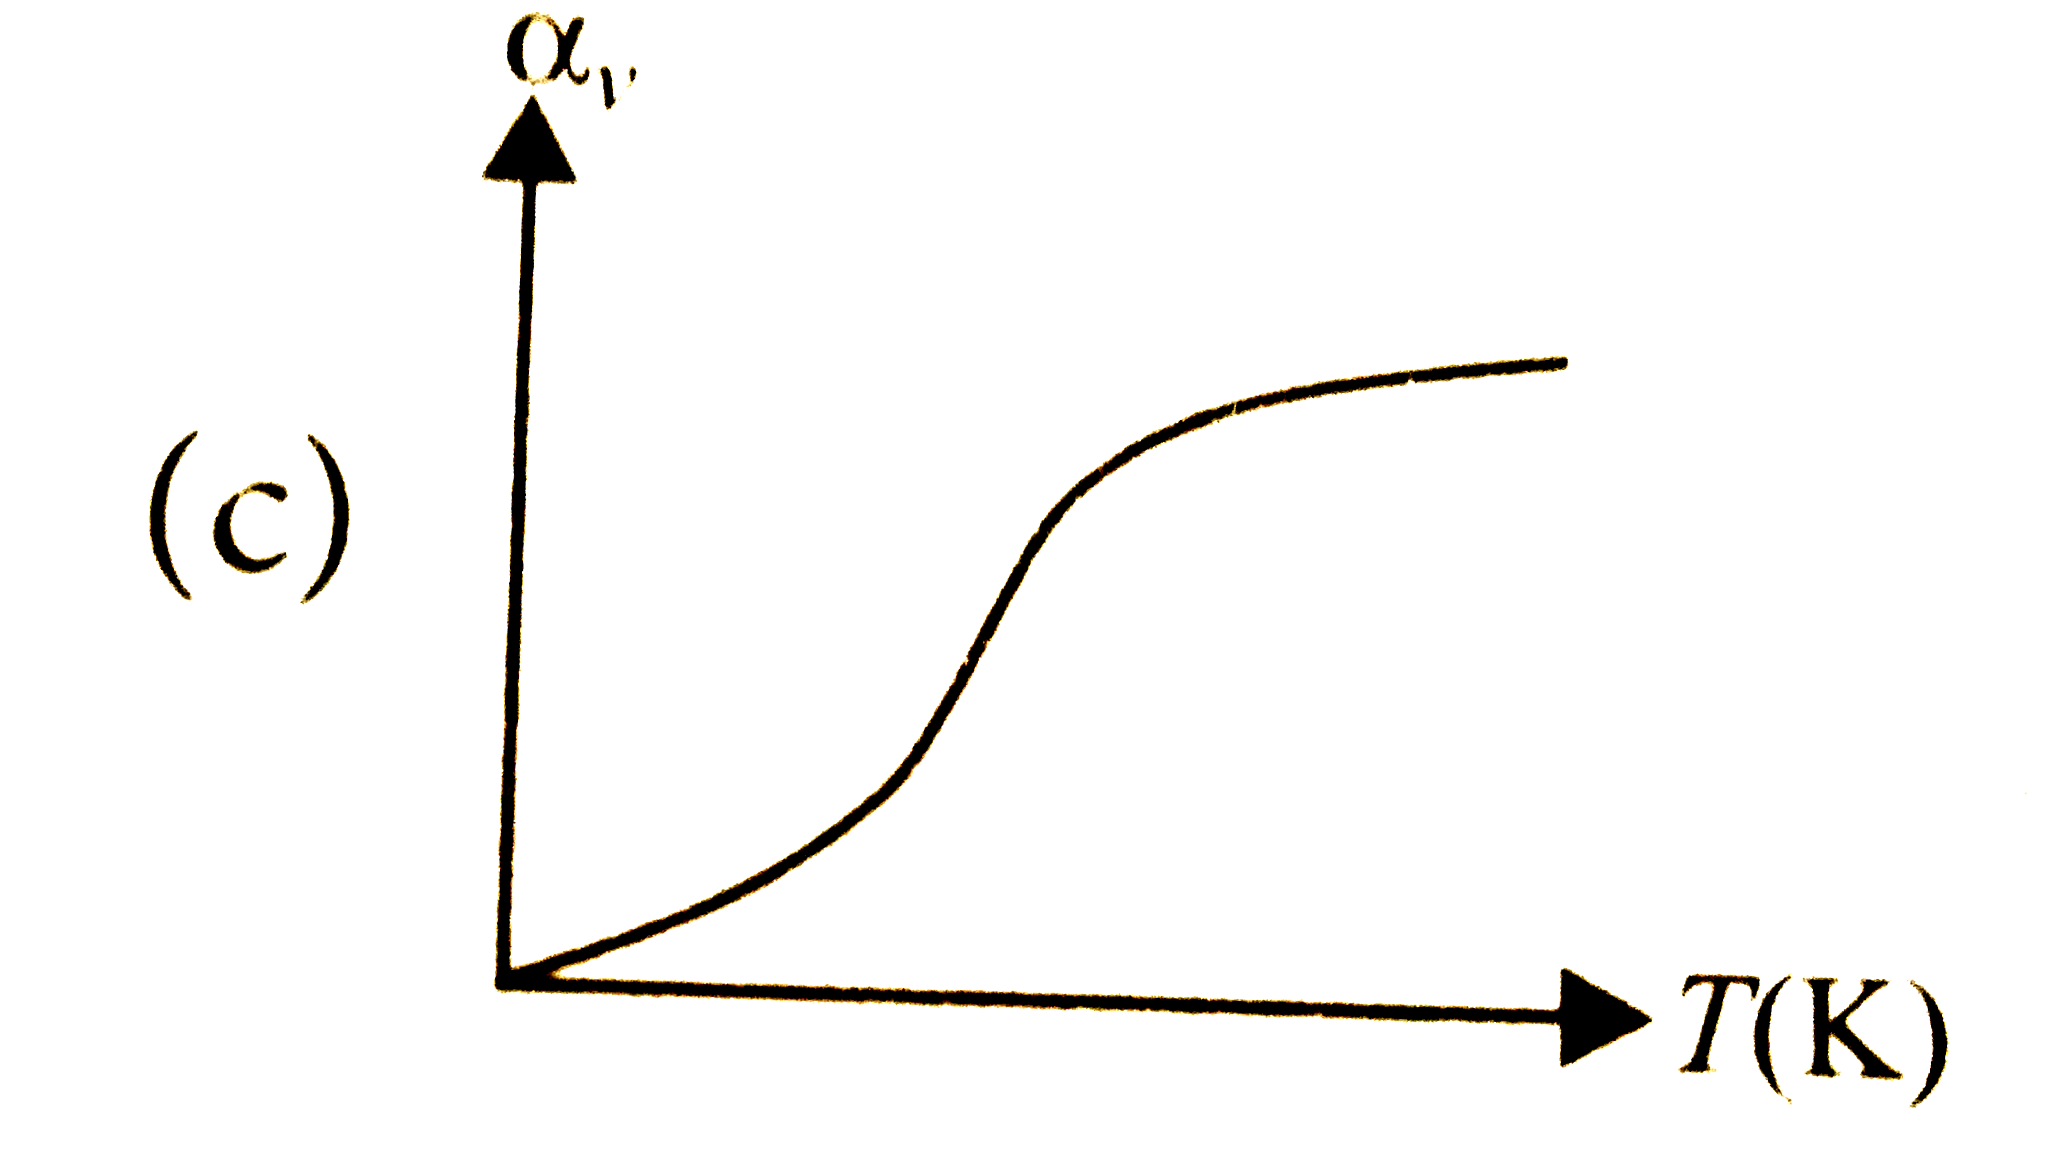 D
D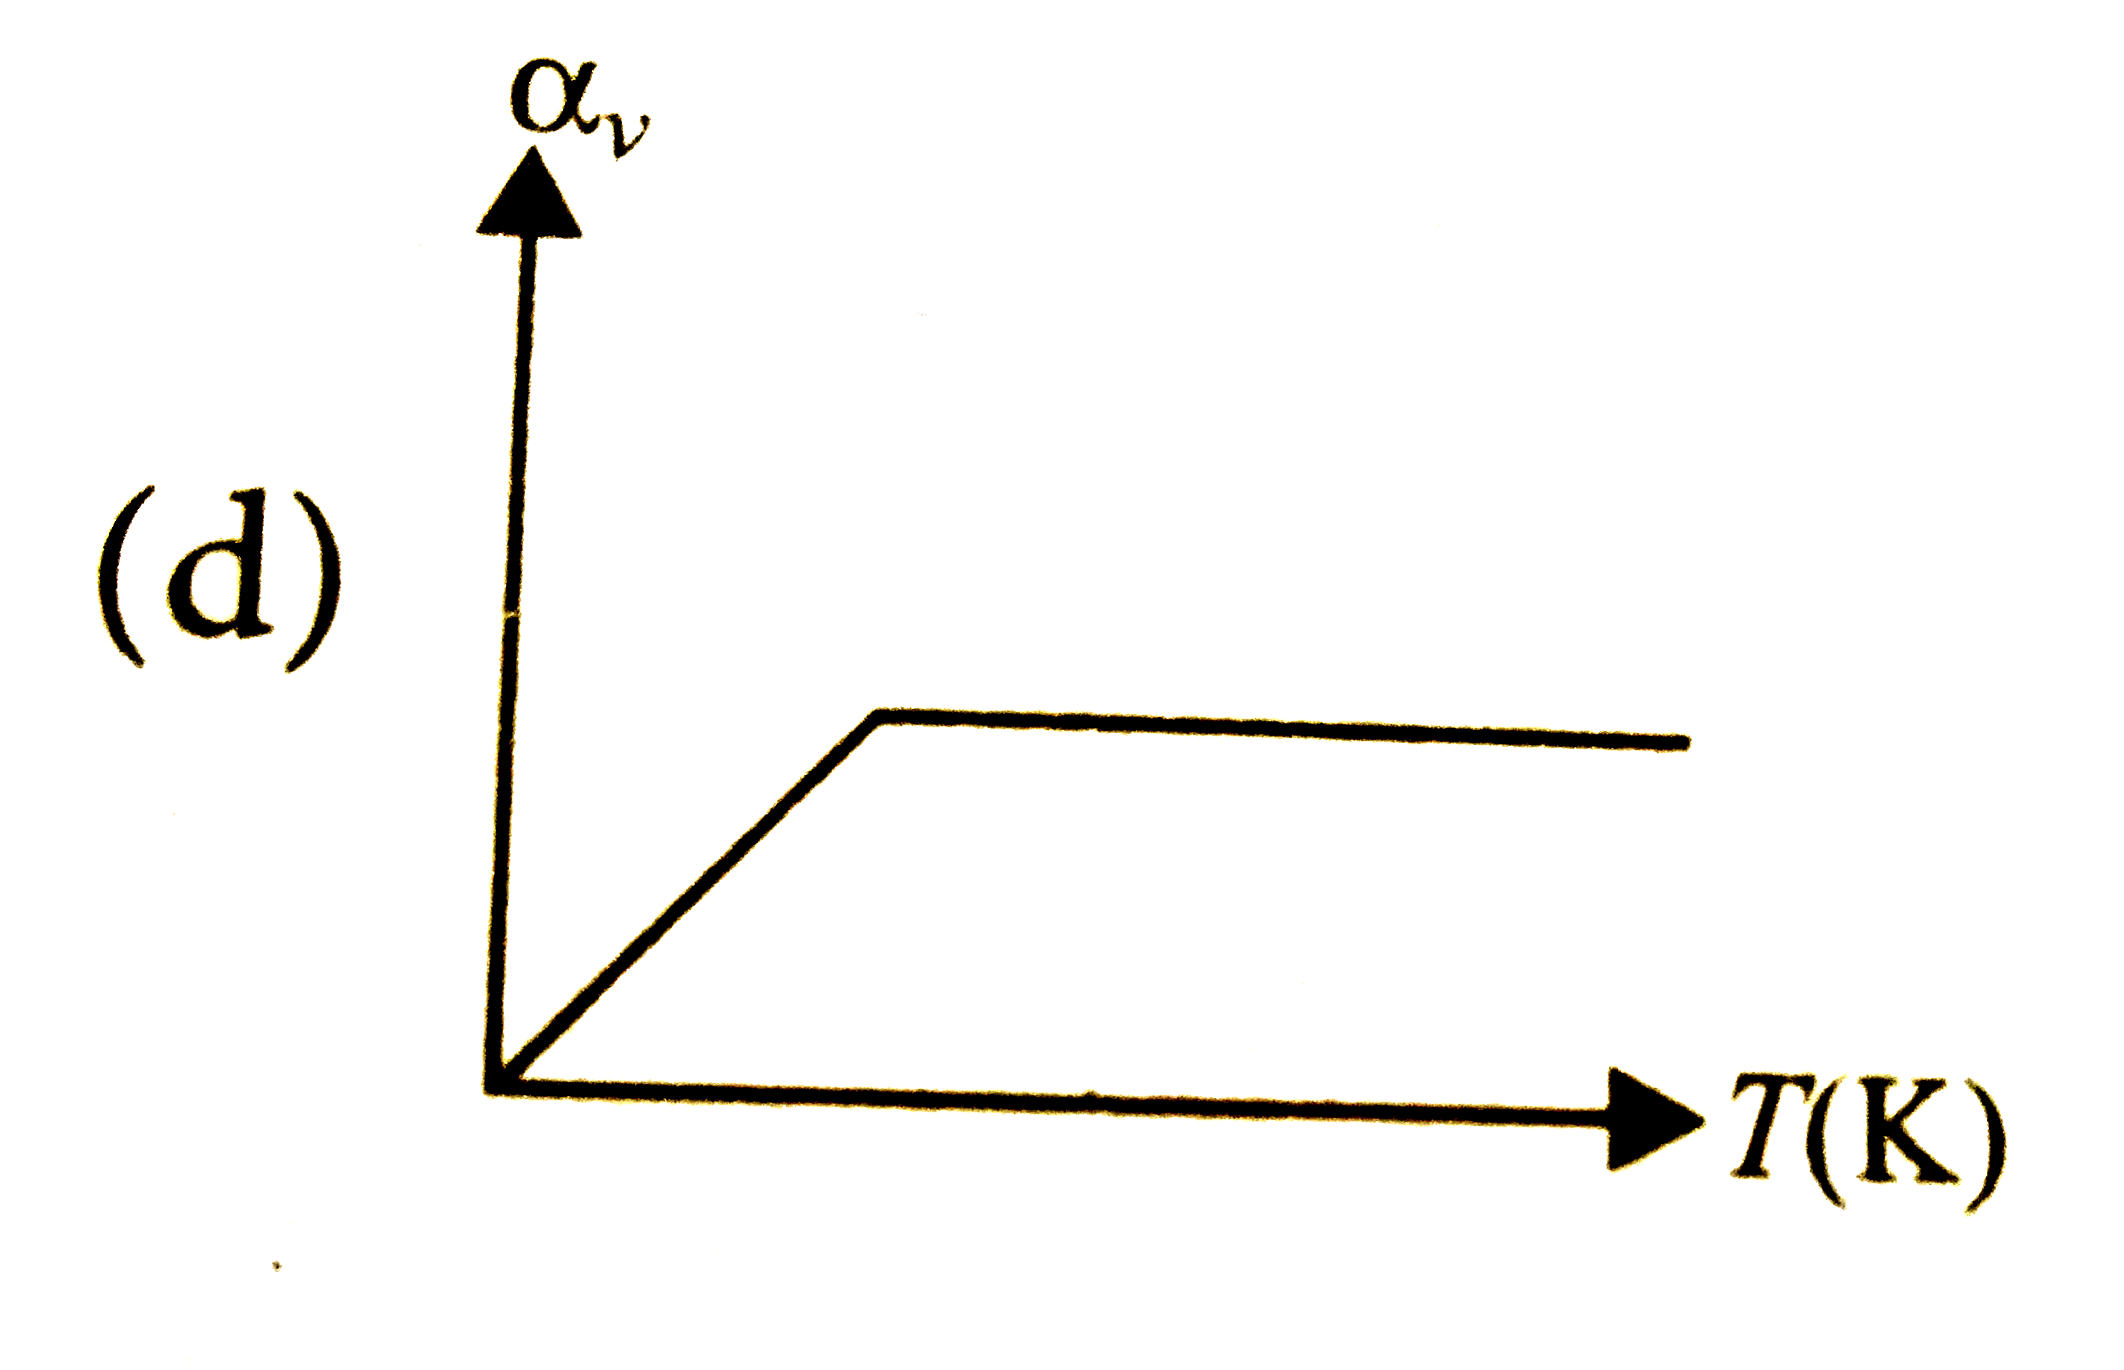
Which of the following graphs correctly shows variation of coefficient of volume expansion of copper as a function of temperature ?
A B
B C
C D
D
Define the term 'temperature coefficient of resistivity' . Write its S.I. unit. Plot a graph showing the variation of resistivity of copper with temperature.
View SolutionPlot a graph showing the variation of resistance of a conducting wire as function of its radius, keeping the length of a wire and its temperature as constant.
View SolutionThe variation of resistance of a metallic conductor with temperature is shown in figure. (i) Calculate the temperature coefficient of resistance from the graph. (ii) State why the resistance of the conductor increases with the rise in temperature.
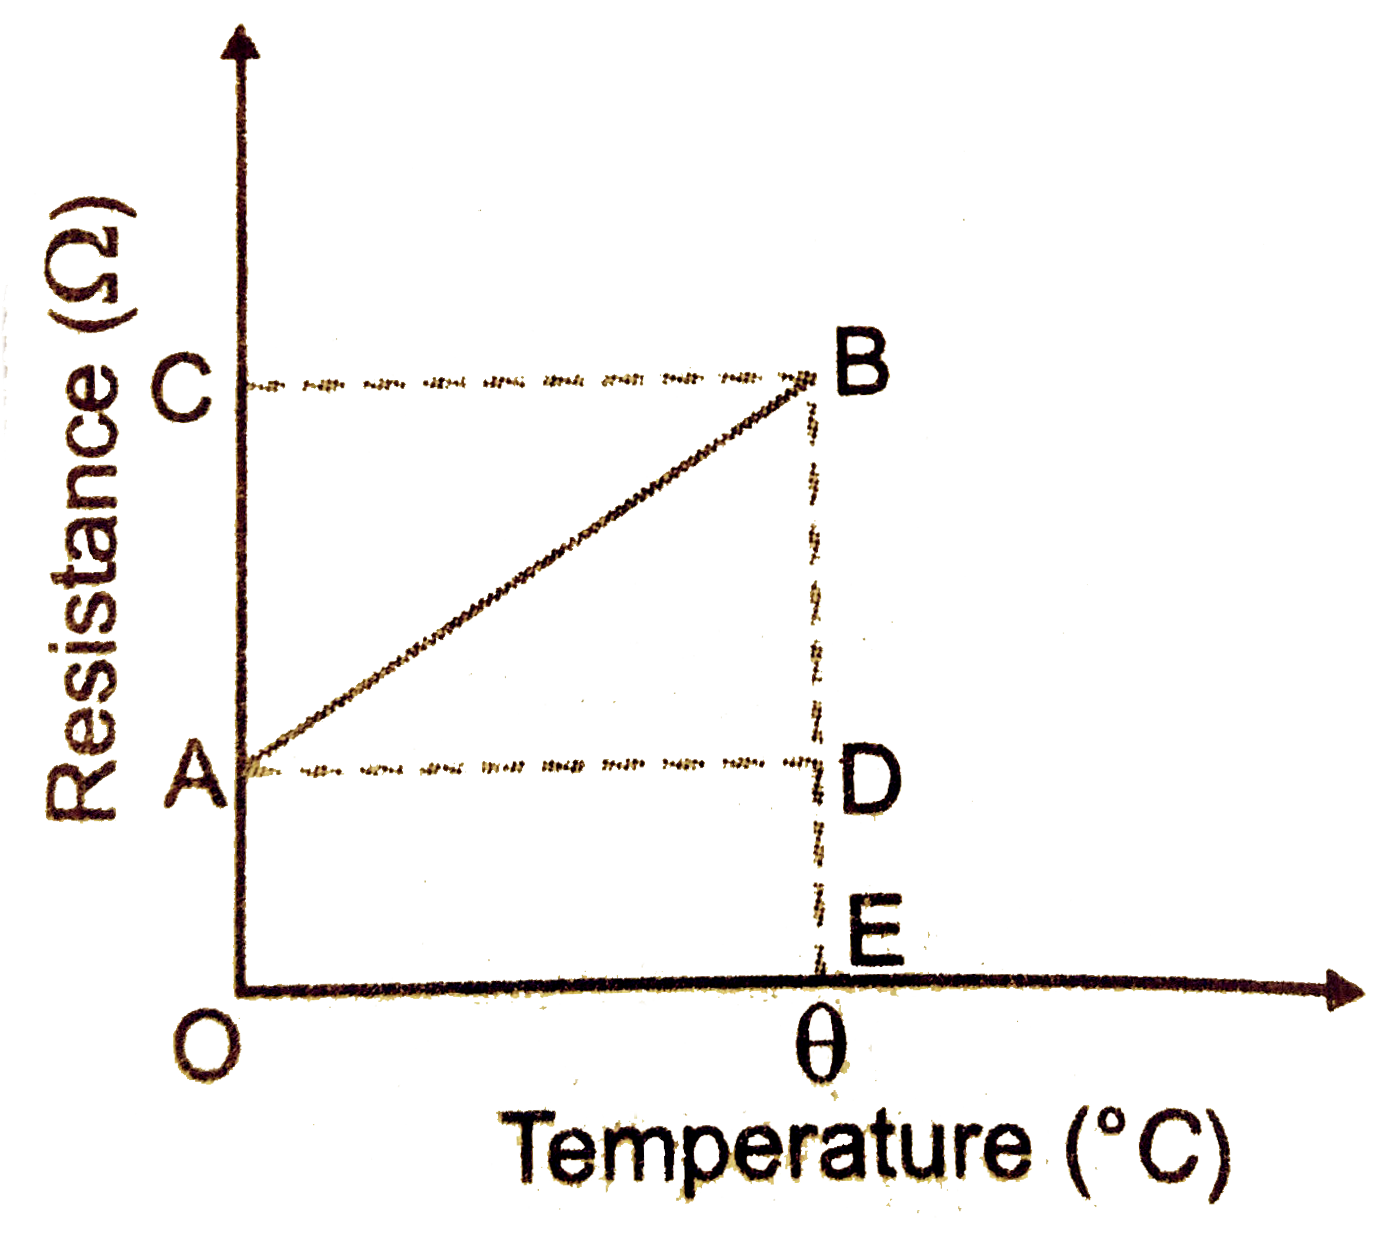
View SolutionDraw the graph showing variation of the value of the induced emf as a function of rate of change of current flowing through an ideal inductor.
View SolutionDraw the graph showing variation of the value of the induced emf as a function of rate of change of current flowing through an ideal inductor.
View SolutionThe given graph shows the variation of resistance of mercury in the temperature range 0 lt T lt 4 K. Name the phenomeon shown by the graph.
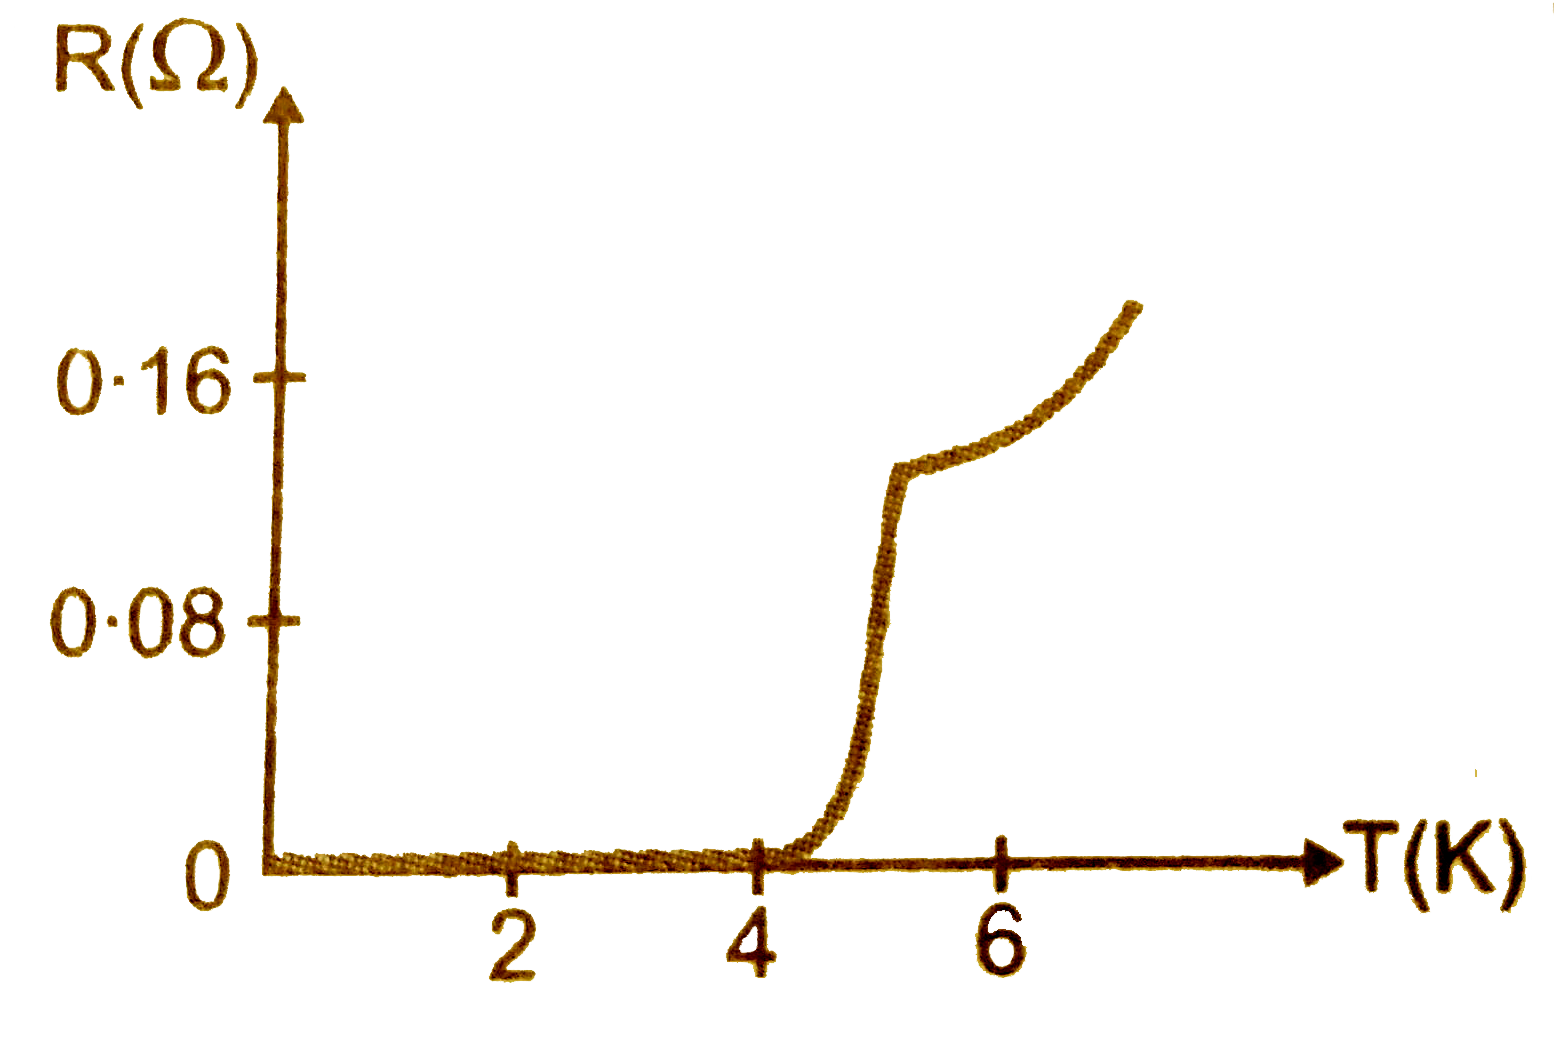
View Solution
