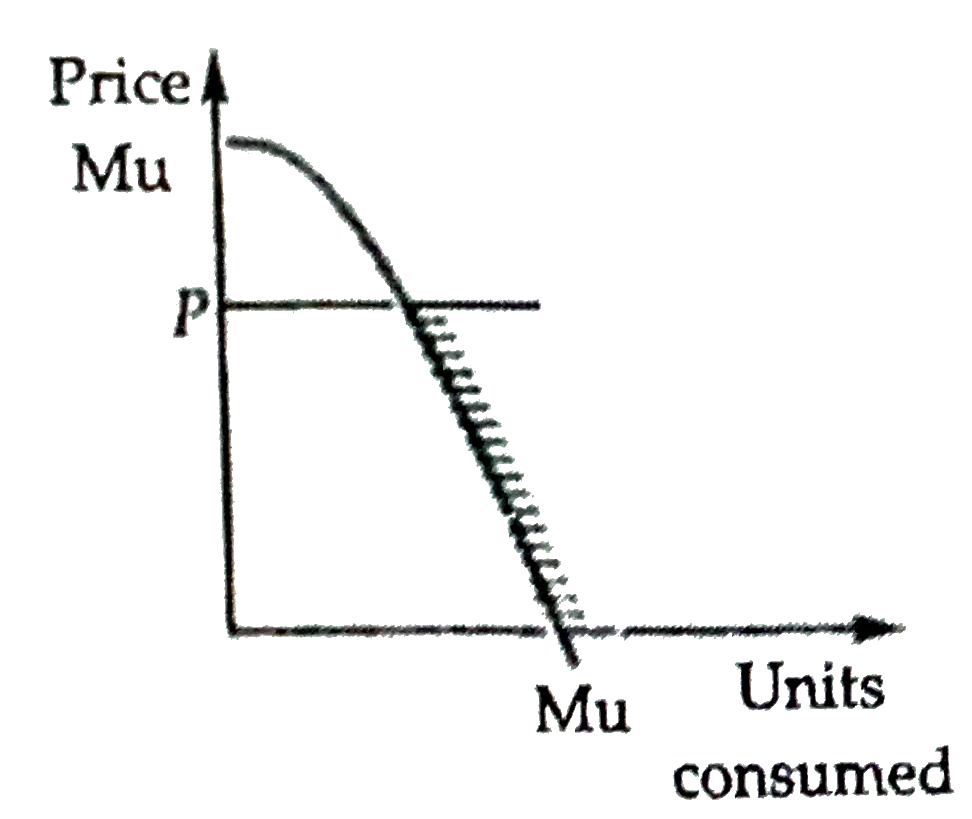
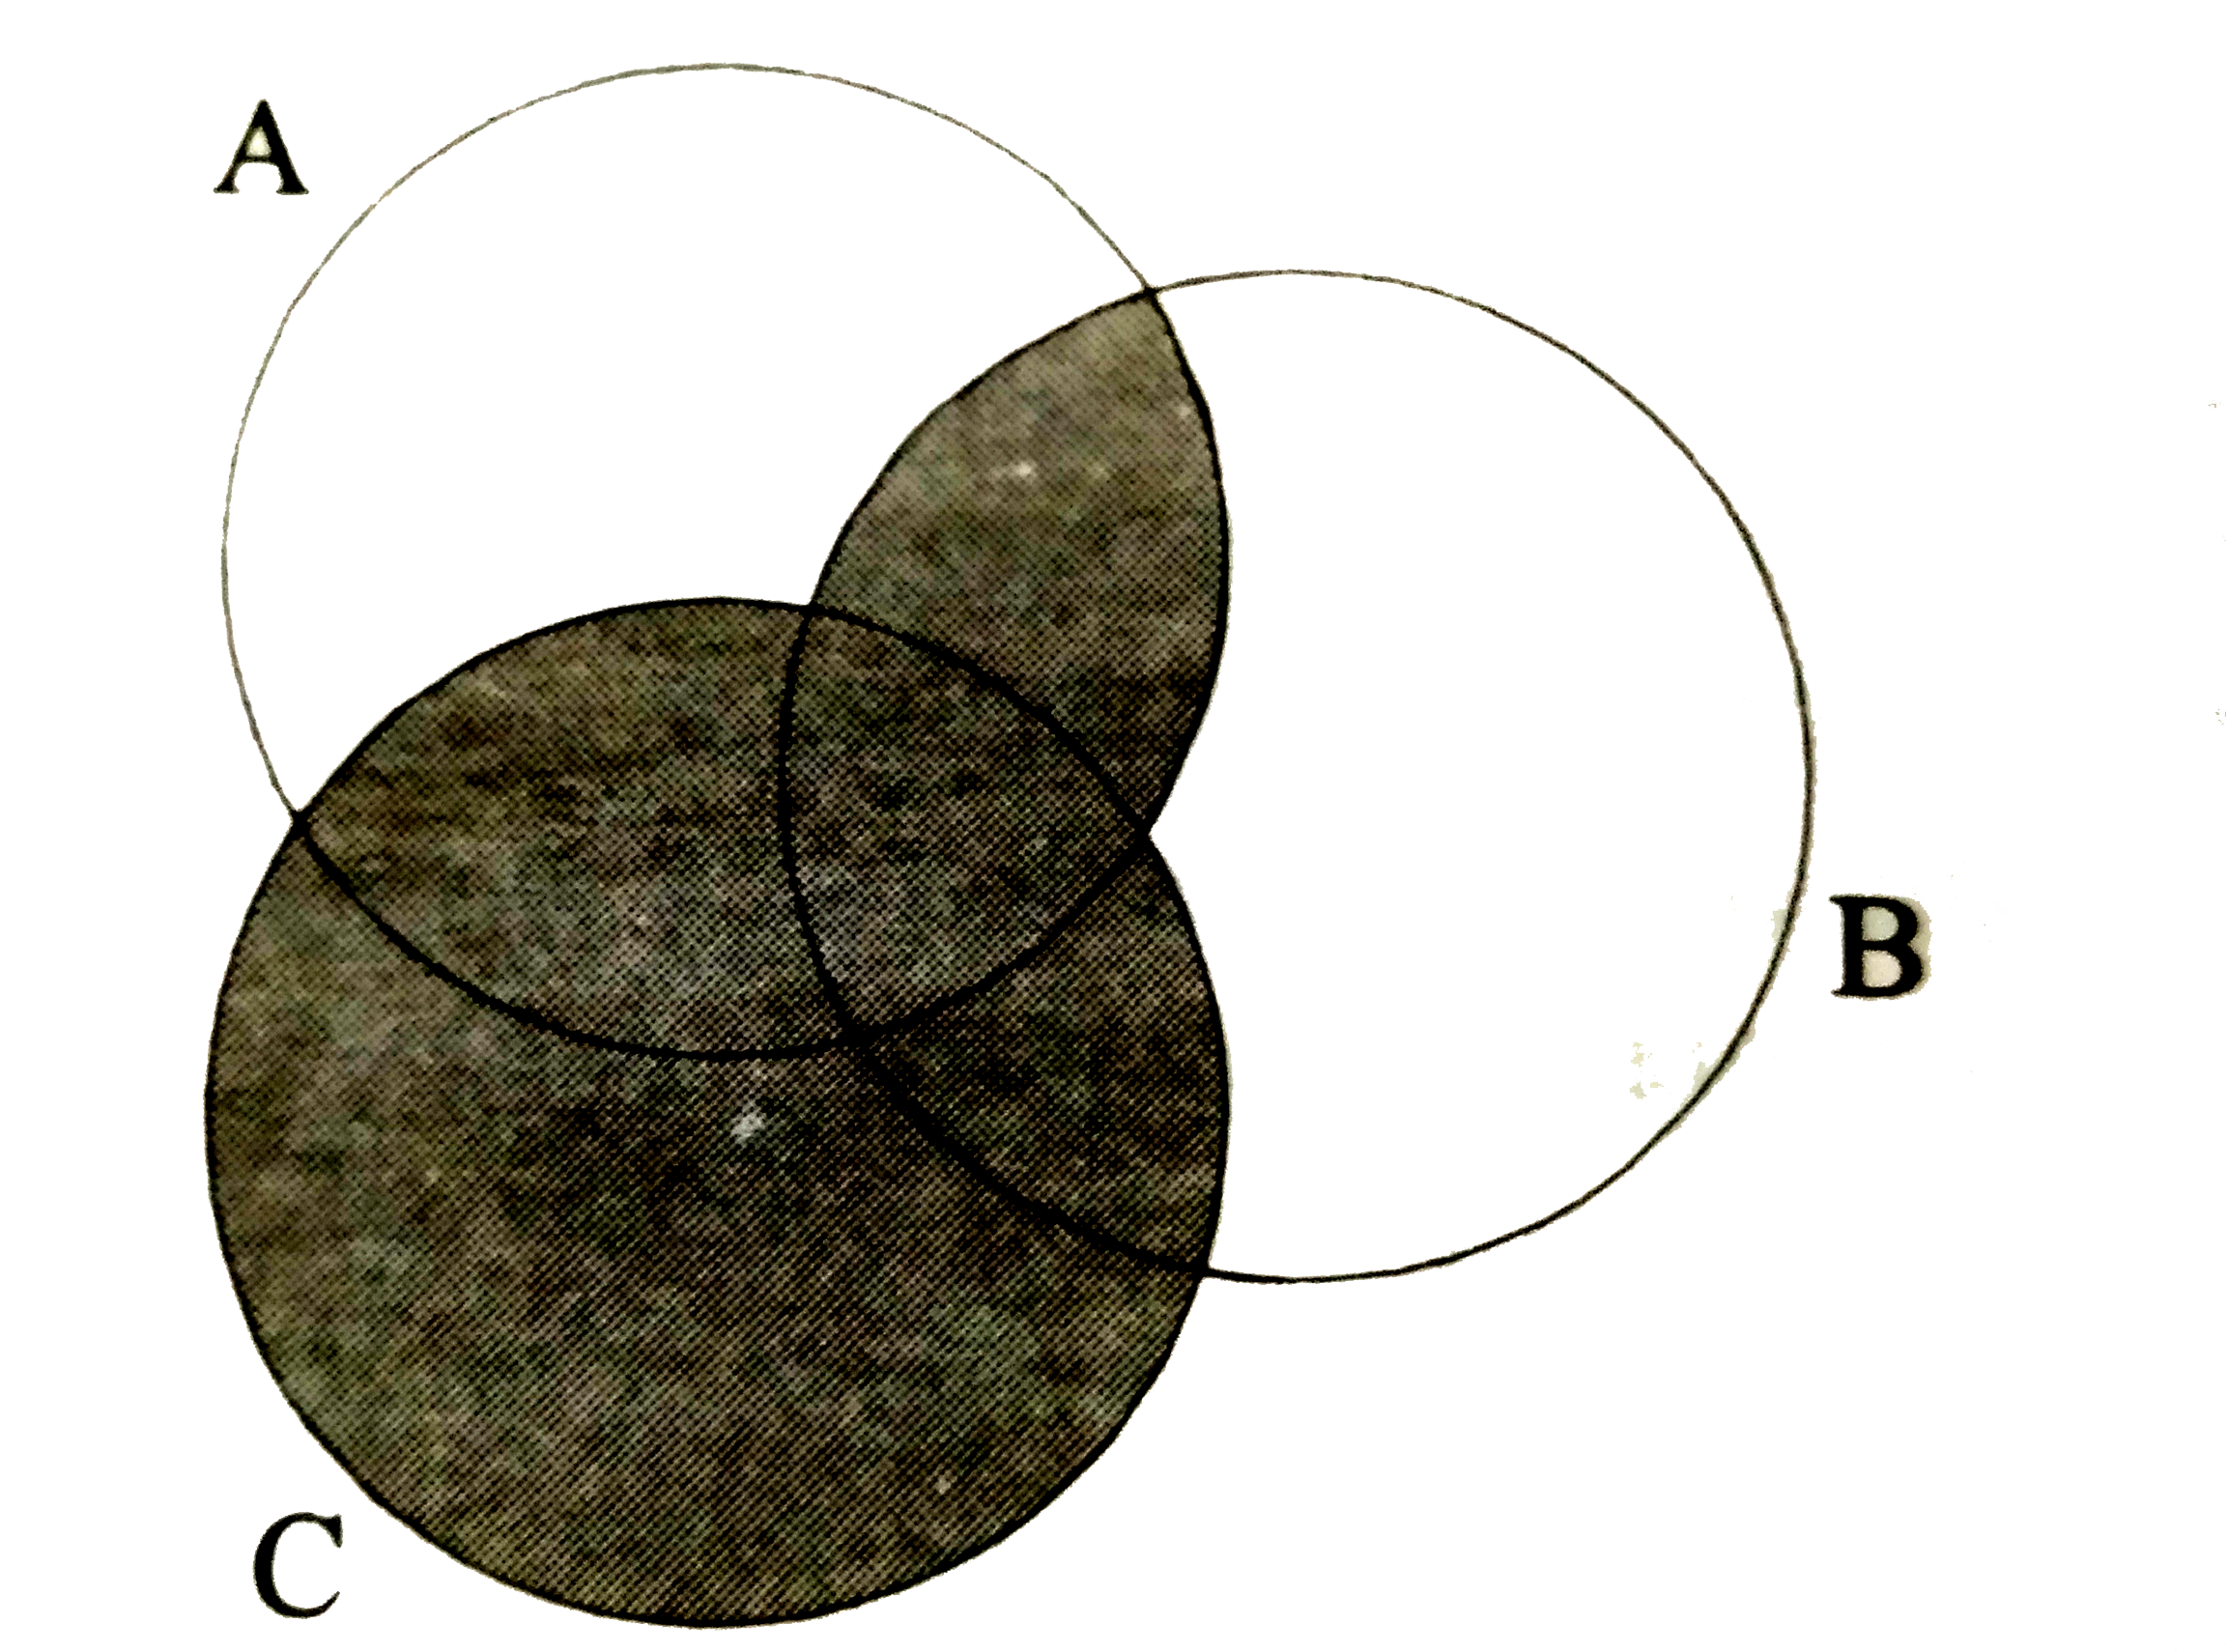
Which of the shaded area in the diagrams below represent total utility ?
A
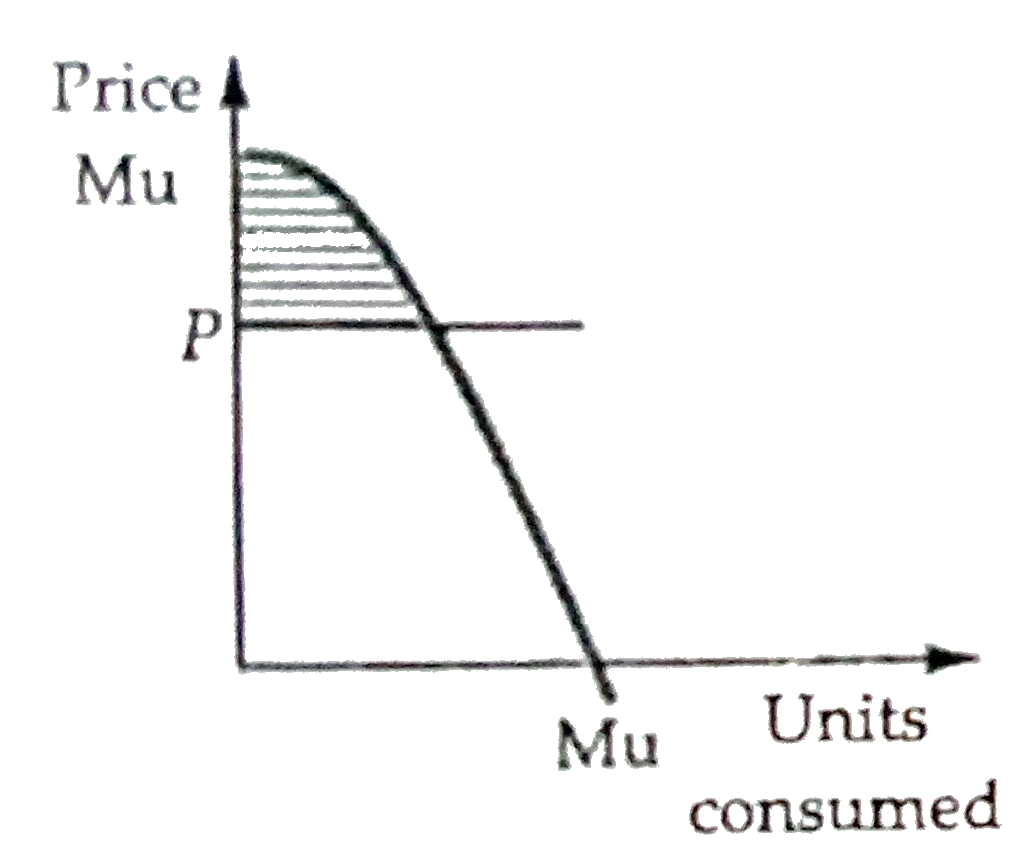
B
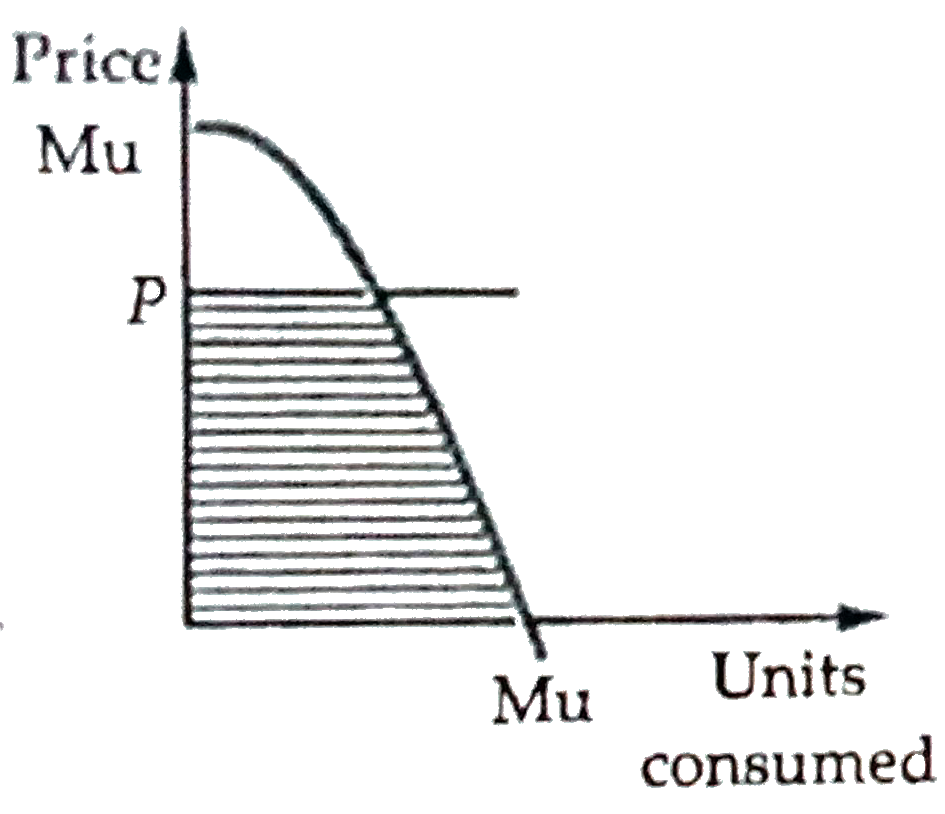
C
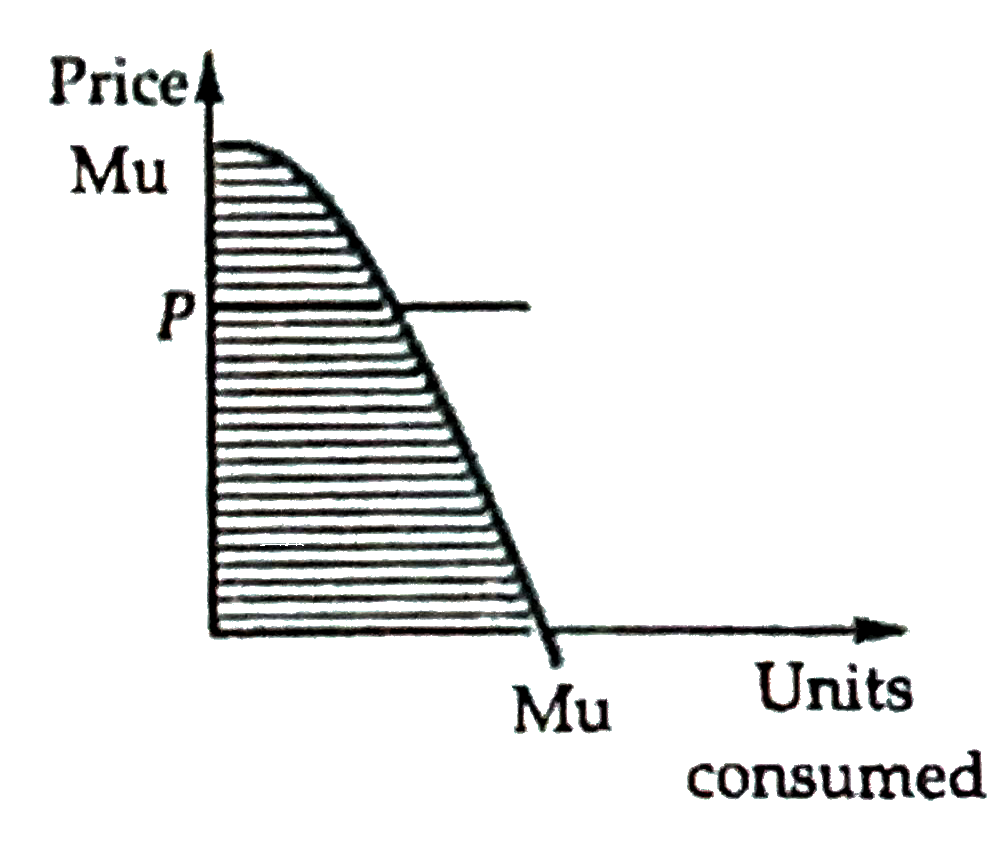
D
Text Solution
The correct Answer is:C
C
|
Topper's Solved these Questions
- CONSUMER'S EQUILIBRIUMBOOK - RADHA BHUGANACHAPTER - CONSUMER'S EQUILIBRIUMEXERCISE - OBJECTIVE
10 Videos
- CONSUMER'S EQUILIBRIUMBOOK - RADHA BHUGANACHAPTER - CONSUMER'S EQUILIBRIUMEXERCISE - CONCEPTUAL
8 Videos
- CONSUMER'S EQUILIBRIUMBOOK - RADHA BHUGANACHAPTER - CONSUMER'S EQUILIBRIUMEXERCISE - LET US RECAPITULATE
8 Videos
- CONCEPTS OF REVENUEBOOK - RADHA BHUGANACHAPTER - CONCEPTS OF REVENUEEXERCISE - Unsolved numericals
4 Videos
- ELASTICITY OF DEMANDBOOK - RADHA BHUGANACHAPTER - ELASTICITY OF DEMANDEXERCISE - Unsolved Numericals
24 Videos
Similar Questions
Knowledge Check
The diagram given below represents
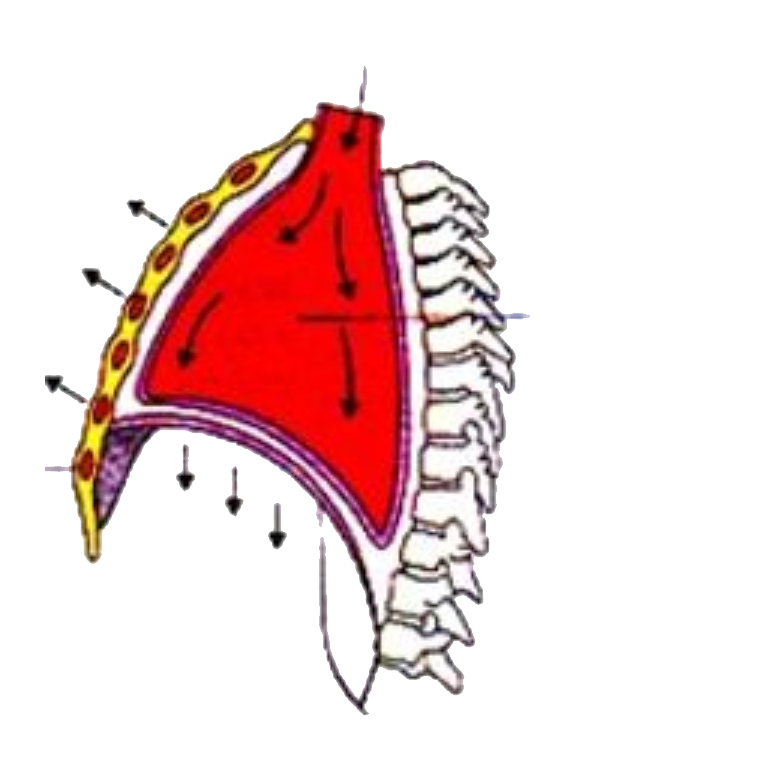 AinspirationBexpirationCSystoleDdiastole
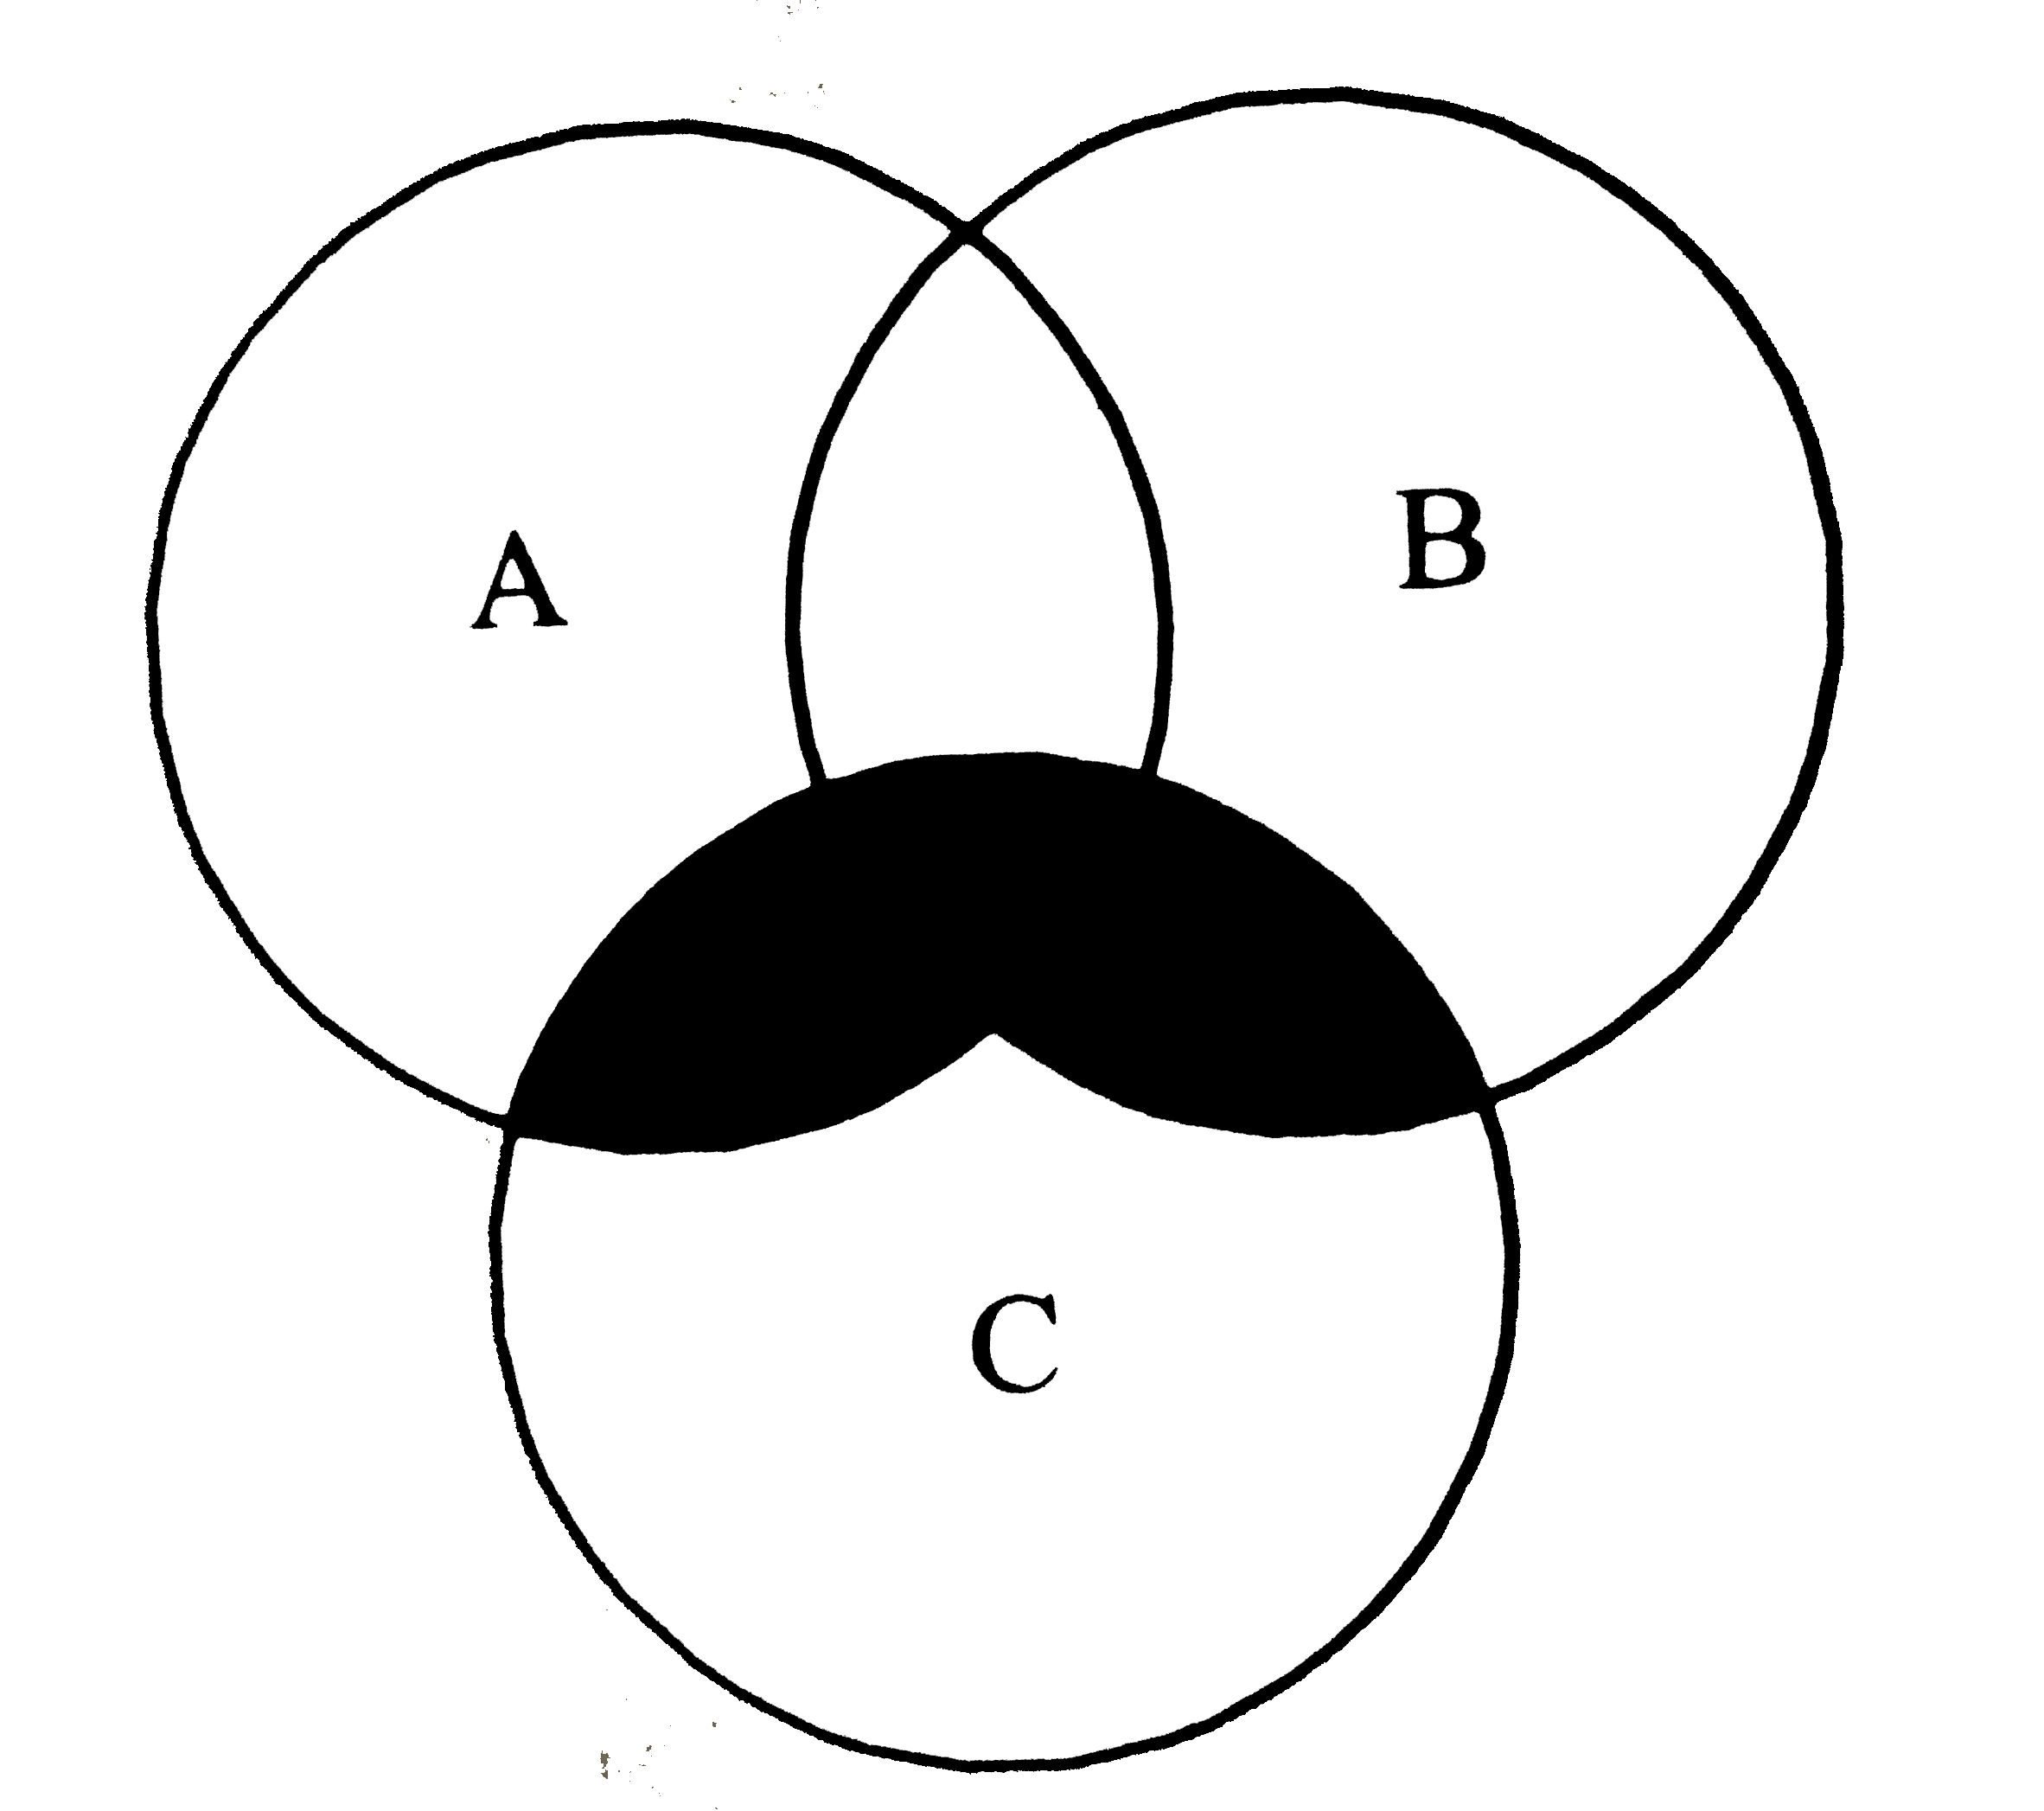
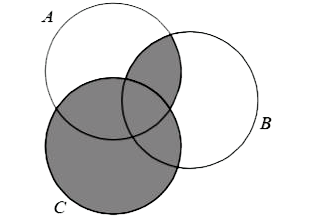
What does the shaded region in the above diagram represent?A(A∩B)∩CB(A∪B)∩CC(A∪B)−CDNone of the aboveTotal utility is :
AThe sum of marginal utilities.BUtility from the first unit × Number of units consumed.CAlways increasing.DUtility from last unit × Nuimber of unit consumed.
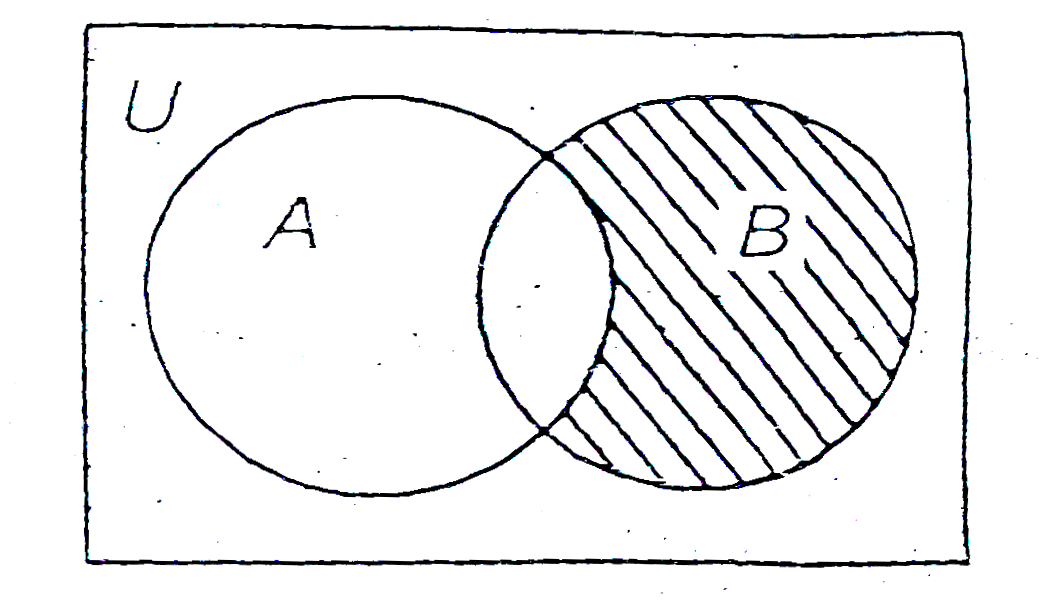
The shaded area in given Venn diagram represent
View SolutionThe diagram given below represents

View SolutionFind the area of the shaded region in the diagram below where the given triangle is isosceles with vertices of base lying on axis of the radius perpendicular to the diameters of the two small semicircles

View SolutionWhat does the shaded region in the Venn diagram given below represent ?
View SolutionWhat does the shaded region in the Venn diagram given below represent ?
View Solution

