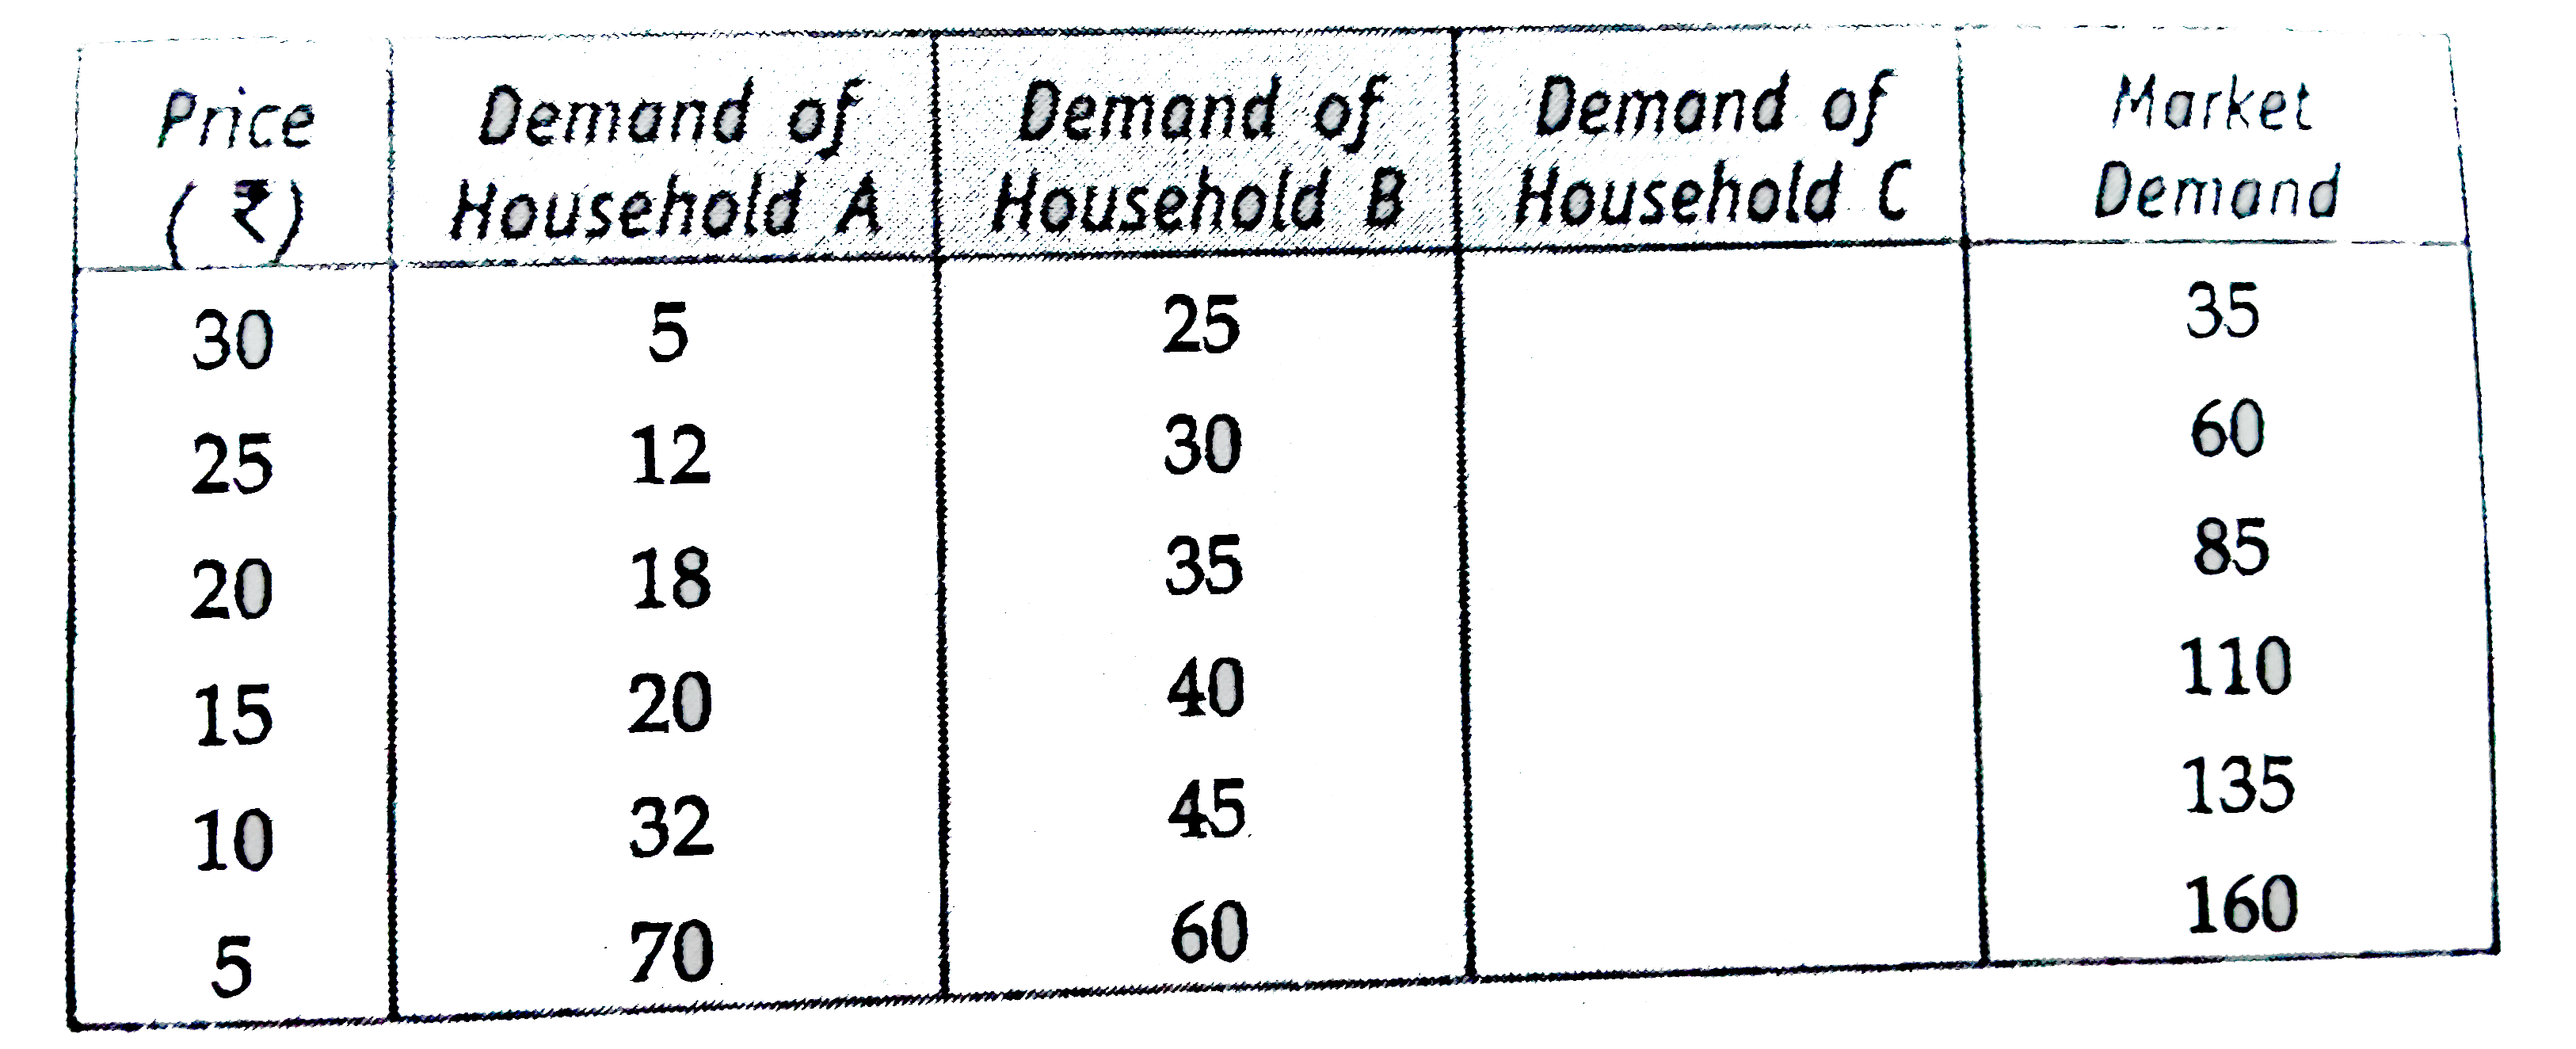
Three households A, B and C form the demand schedule for the market and that for household A and B determine the demadn schedule for C.

5, 18, 32, 50, 58, 30
Topper's Solved these Questions
- THEORY OF DEMANDBOOK - RADHA BHUGANACHAPTER - THEORY OF DEMANDEXERCISE - LONG ANSWER TYPE QUESTION
12 Videos
- SIMPLE APPLICATIONS OF TOOLS OF DEMAND AND SUPPLYBOOK - RADHA BHUGANACHAPTER - SIMPLE APPLICATIONS OF TOOLS OF DEMAND AND SUPPLYEXERCISE - Long answer
3 Videos
- THEORY OF SUPPLY : LAW OF SUPPLY AND ELASTICITY OF SUPPLYBOOK - RADHA BHUGANACHAPTER - THEORY OF SUPPLY : LAW OF SUPPLY AND ELASTICITY OF SUPPLYEXERCISE - LET US RECAPITULATE
9 Videos
Similar Questions
From the following data regarding individual demand schedules of households A, B and market demand schedule, prepare the demand schedule of household C, assuming that there are only three households in the market
Price Rs.Individual Demand (units)¯¯¯¯¯¯¯¯¯¯¯¯¯¯¯¯¯¯¯¯¯¯¯¯¯¯¯¯¯¯¯¯¯¯¯¯¯¯¯¯¯¯¯¯¯¯¯¯¯¯¯¯¯¯¯¯¯¯¯¯¯¯A B CMarket demand (units) 720 16 − 51 818 15 − 46 916 12 − 39 1013 10 − 32
View SolutionThere are the frims A, B and C in a market . The supply schedule for the market and that for firms A and B is given below. Perpare the supply schedule for frim C.

View SolutionThere are three firms X,Y and Z in the market . The supply schedule for the market and the for firms X and Y is given below. Perpare the supply schedule for frim Z.

View SolutionThere are 3 households : A, B and C in a market. From the following table, calculate demand for household B at various levels of price :
Price Rs. Household A Household B Household C Market Demand 14 12 - 22 52 12 16 - 32 72 10 24 - 44 102 8 34 - 60 142 6 48 - 84 198
View Solutionfollowing are the demand schedules for commodities A and B . Which one of them has more elastic demand ?

View SolutionShow the construction of individual and market demand schedule and curve when there are two households in the market.
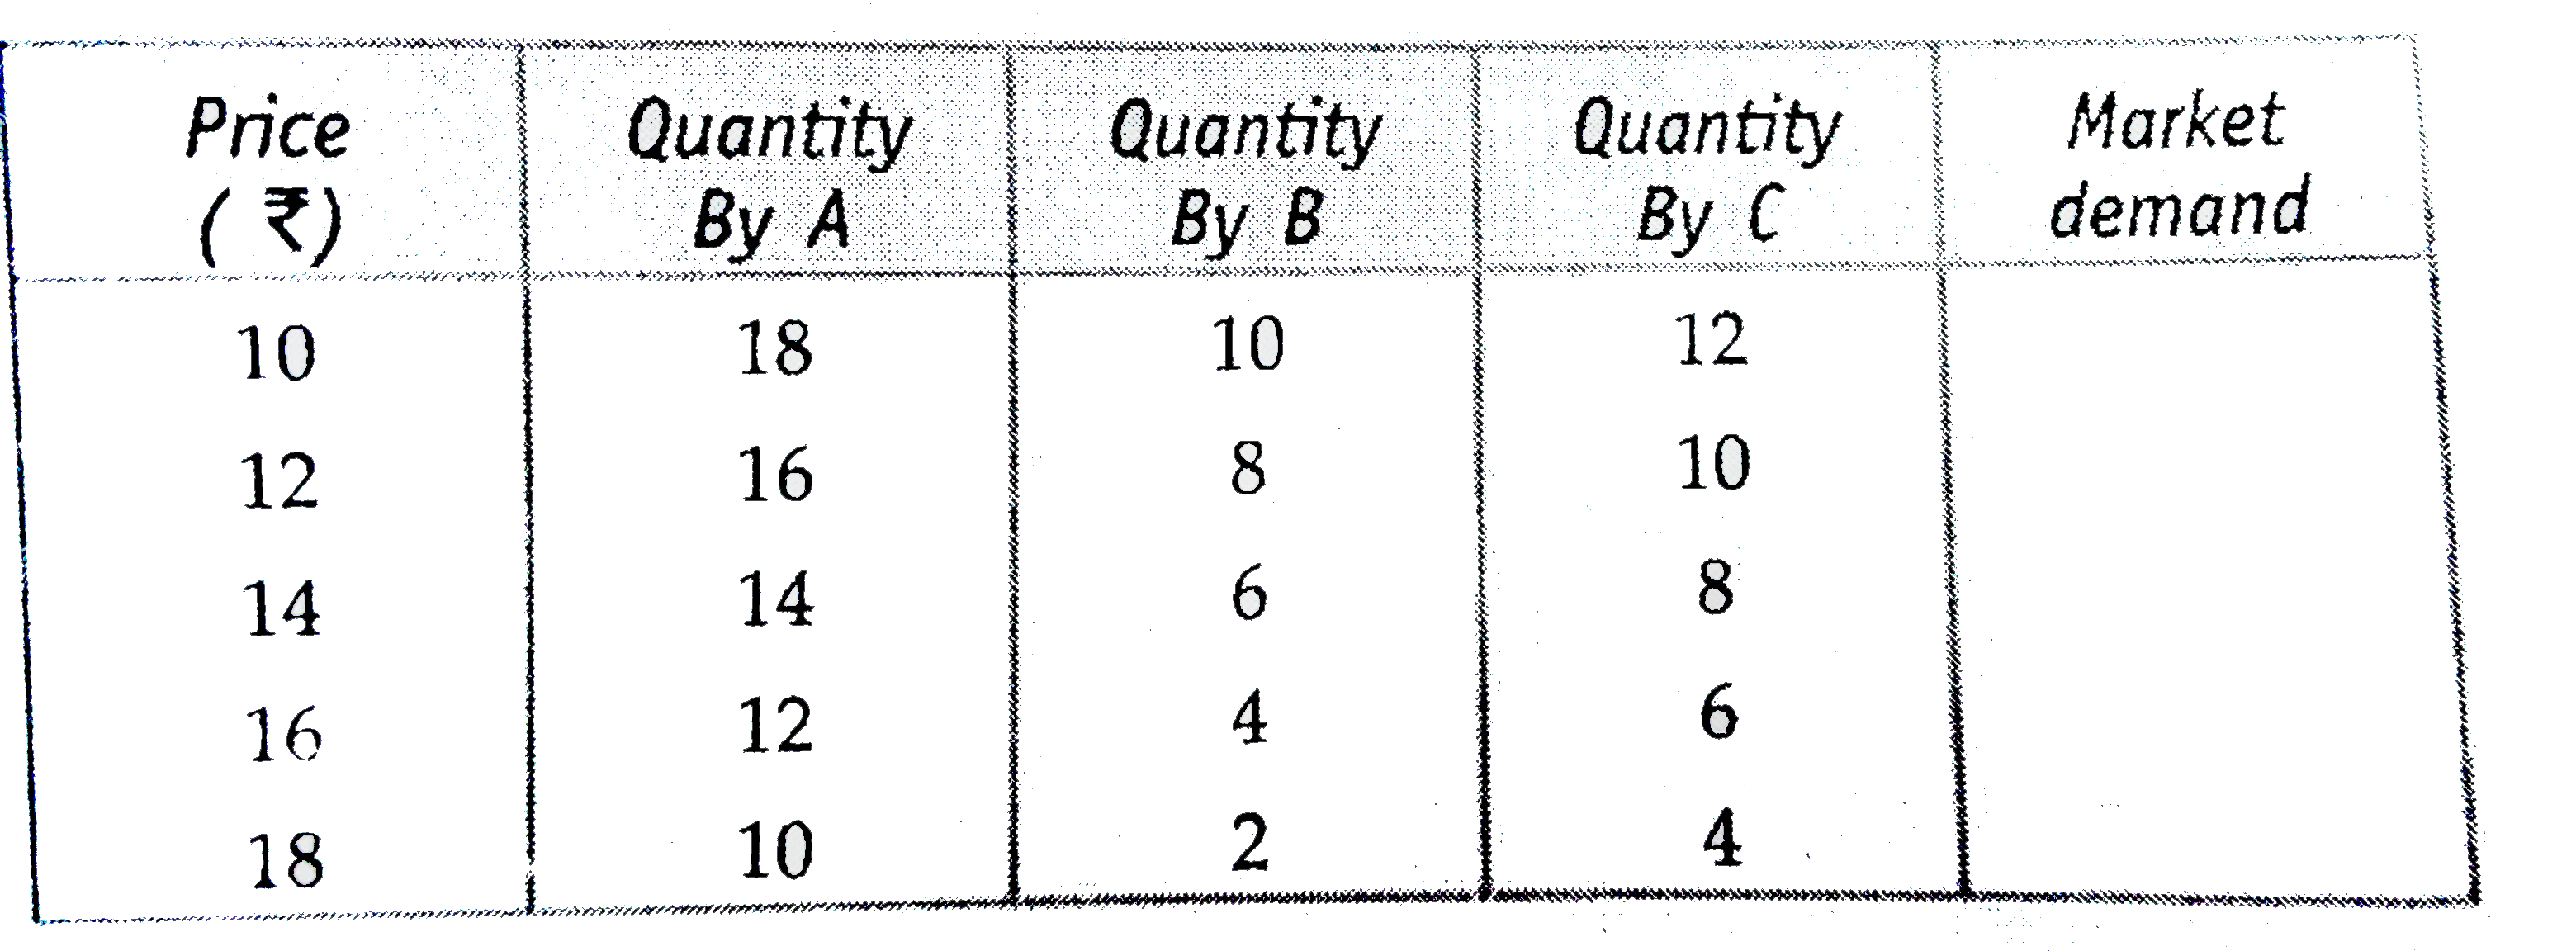
View SolutionSuppose there are 3 consumers in a particular market : A, B and C. Their demand schedules are given in the following table. Prepare the market demand schedule
Price (Rs.)Individual Demand (units)¯¯¯¯¯¯¯¯¯¯¯¯¯¯¯¯¯¯¯¯¯¯¯¯¯¯¯¯¯¯¯¯¯¯¯¯¯¯¯¯¯¯¯¯¯¯¯¯¯¯¯¯¯¯¯¯¯¯¯¯¯¯¯¯¯¯A B C 160 30 70 240 25 65 332 18 50 425 15 30 518 0 22
View SolutionThe supply schedule for three firms (X,Y and Z) are given below . Derive the market supply schedule:

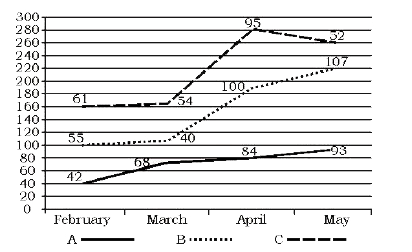
View SolutionThe line graph shows electricity consumption for three households A, B and C for months february to May

IN the line graph the percentage increase in electricity consumption of B between march and May is :
View SolutionFind market demand from the following schedule and draw market demand curves:

View Solution
