The line graph shows electricity consumption for three households A, B and C for months february to May
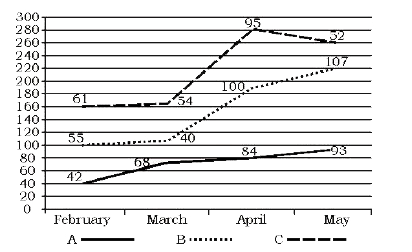
IN the line graph the percentage increase in electricity consumption of B between march and May is :
0.95
0.85
0.07
0.98
The correct Answer is:D
Step by step video & image solution for The line graph shows electricity consumption for three households A, B and C for months february to May IN the line graph the percentage increase in electricity consumption of B between march and May is : by Maths experts to help you in doubts & scoring excellent marks in Class 14 exams.
Updated on:21/07/2023Topper's Solved these Questions
Similar Questions
The line graph shows electricity consumption for three households A,B and C for months february to May.
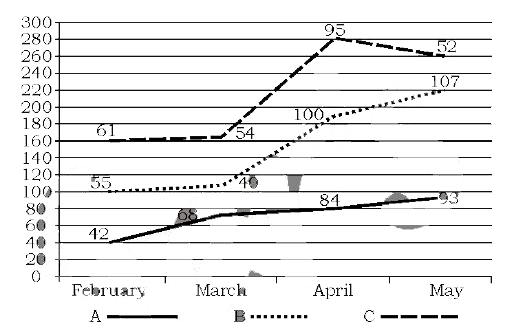
In the given line graph, the difference between the total electrical consumption between months february and April is:
View SolutionThe line graph shows electricity consumption for three households A, B and C for months february to May
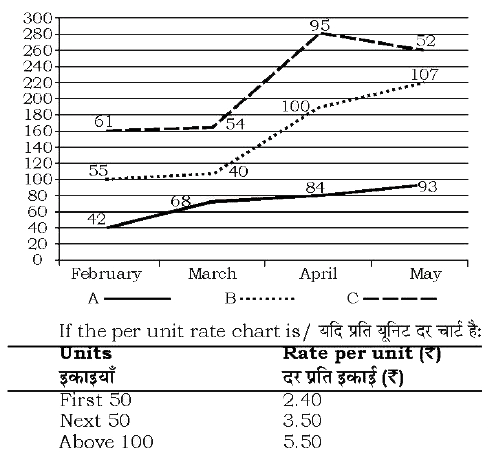
IN thegiven line graph the electricity charges collected from all (A B C) for the month of February is:
View Solution
Knowledge Check
The table shows units of electricity consumed in four cities in the following years.
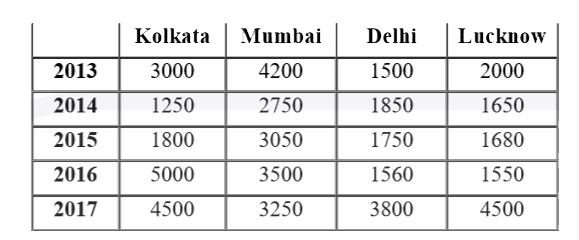
Electricity consumption in Mumbai in 2018 is 12% less than electricity consumption in Kolkata in 2016.
What is the electricity consumption in Mumbai in 2018?A1.4400 unitsB2.2200 unitsC3.2020 unitsD4.2000 units
The line graph shows the production of product A and B during the period 2004 to 2009 and the second line graph shows the percentage sale of these products
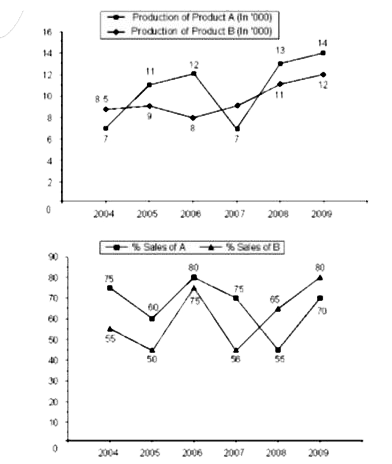
In the given line graph, what is the total sale of products A and B in the year 2007
View SolutionThe line graph shows the production of product A and B (in thousands) during the period 2004 to 2009 and the second line Graph shows the percentage sale of these products.
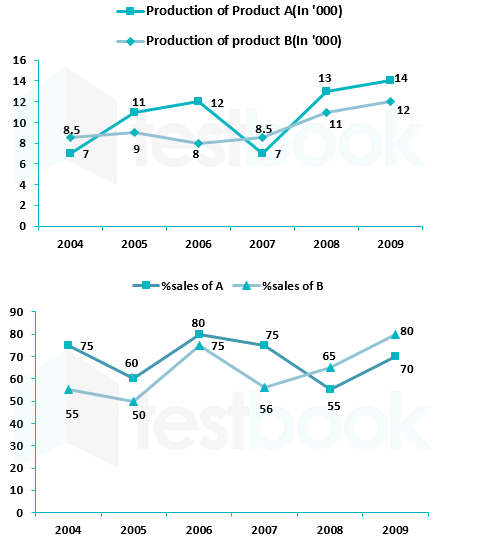
In the given line graph, what is the total sale of Products A and B in the year 2007?
View SolutionThe line graph shows the production of product A and B (in thousands) during the period 2004 to 2009 and the second line Graph shows the percentage sale of these products.

In the given line graph, what is the total sale of Product B in the year 2004 and 2008 together?
View SolutionThe line graph shows the production of product A and B during the period 2004 to 2009 and the second line graph shows the percentage sale of these products
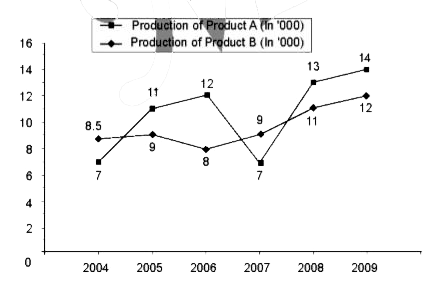 br>
br> 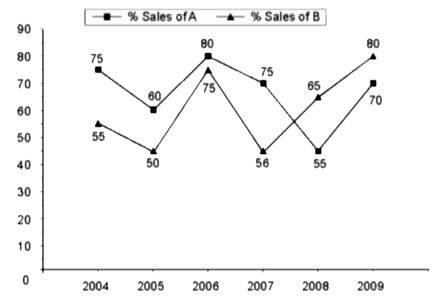
In the given line graph, what is the total sale of products A in the year 2005 and 2009 taken together?
View SolutionThe line graph shows the production of product A and B (in thousands) during the period 2004 to 2009 and the second line Graph shows the percentage sale of these products.

In the given line graph. what is the total sale of Product A in the year 2005 and 2009 taken together?
View SolutionThe line graph shows the monthly expenditure by two families in hundreds
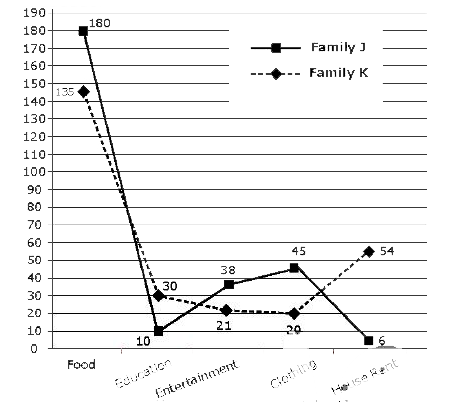
In the given line graph what is the difference in percentage of percentage of spending on food between family J and K?
View SolutionThe following graph shows the production of cement (in lakh tons) of four factories A, B, C and D over the years
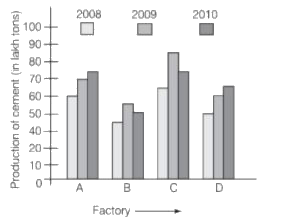
The percentage increase in production of cement by factory B from 2008 to 2009 is about
View Solution
