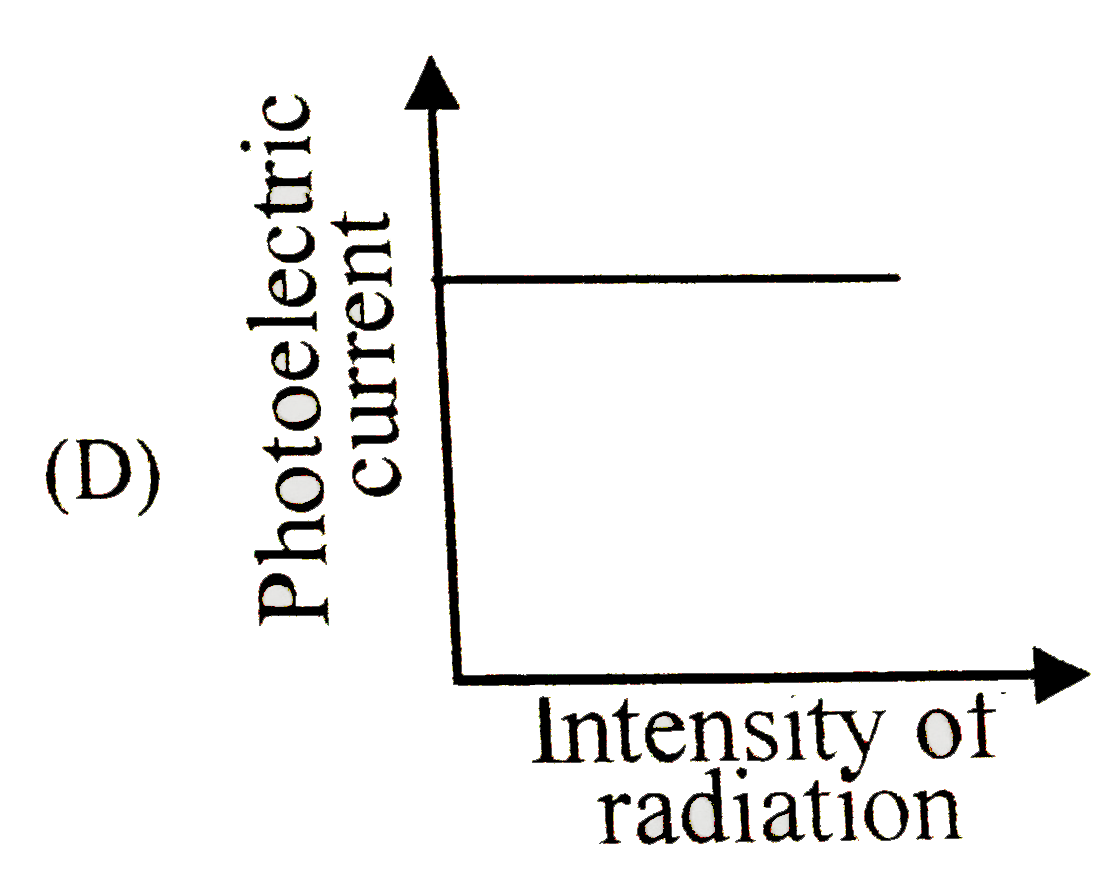
The graph that depicts Einstein photoelectric effect for a monochromatic source of frequency above that theshold frequency is
A

B

C

D
Video Solution
Text Solution
The correct Answer is:c
On inceasing intensity of radiation , values of photo electric current inceses because no. of photon incident increases
|
Updated on:21/07/2023
Topper's Solved these Questions
Similar Questions
Knowledge Check
- Question 1 - Select One or More
Which is the graph with respect to photoelectric effect?
A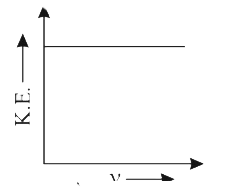 B
B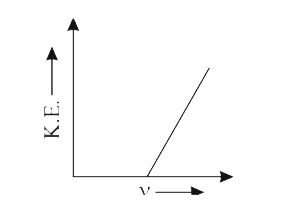 C
C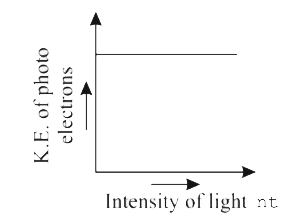 D
D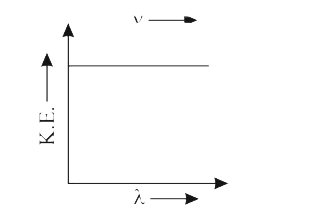
- Question 2 - Select One
By photoelectric effect, Einstein, proved
AE=hvBK.E.=12mv2CE=mc2DE=Rhc2n2 - Question 3 - Select One
Einstein's work on photoelectric effect gives support to
AMass energy relationBBohr's theoryCPlanck's equation E=hvDde Broglie's hypothesis
Einstein's work on photoelectric effect gives support to
View SolutionIn the experiment on photoelectric effect using light having frequency greater than the threshold frequency, the photocurrent will certainly increase when
View SolutionIn photoelectric effect , if a week intensity radiation instead of strong intensity of suitable frequency is used then
View SolutionIn photoelectric effect , if a week intensity radiation instead of strong intensity of suitable frequency is used then
View SolutionIn photoelectric effect on metals, an increase in the frequency of incident radiation increases:
View Solution

