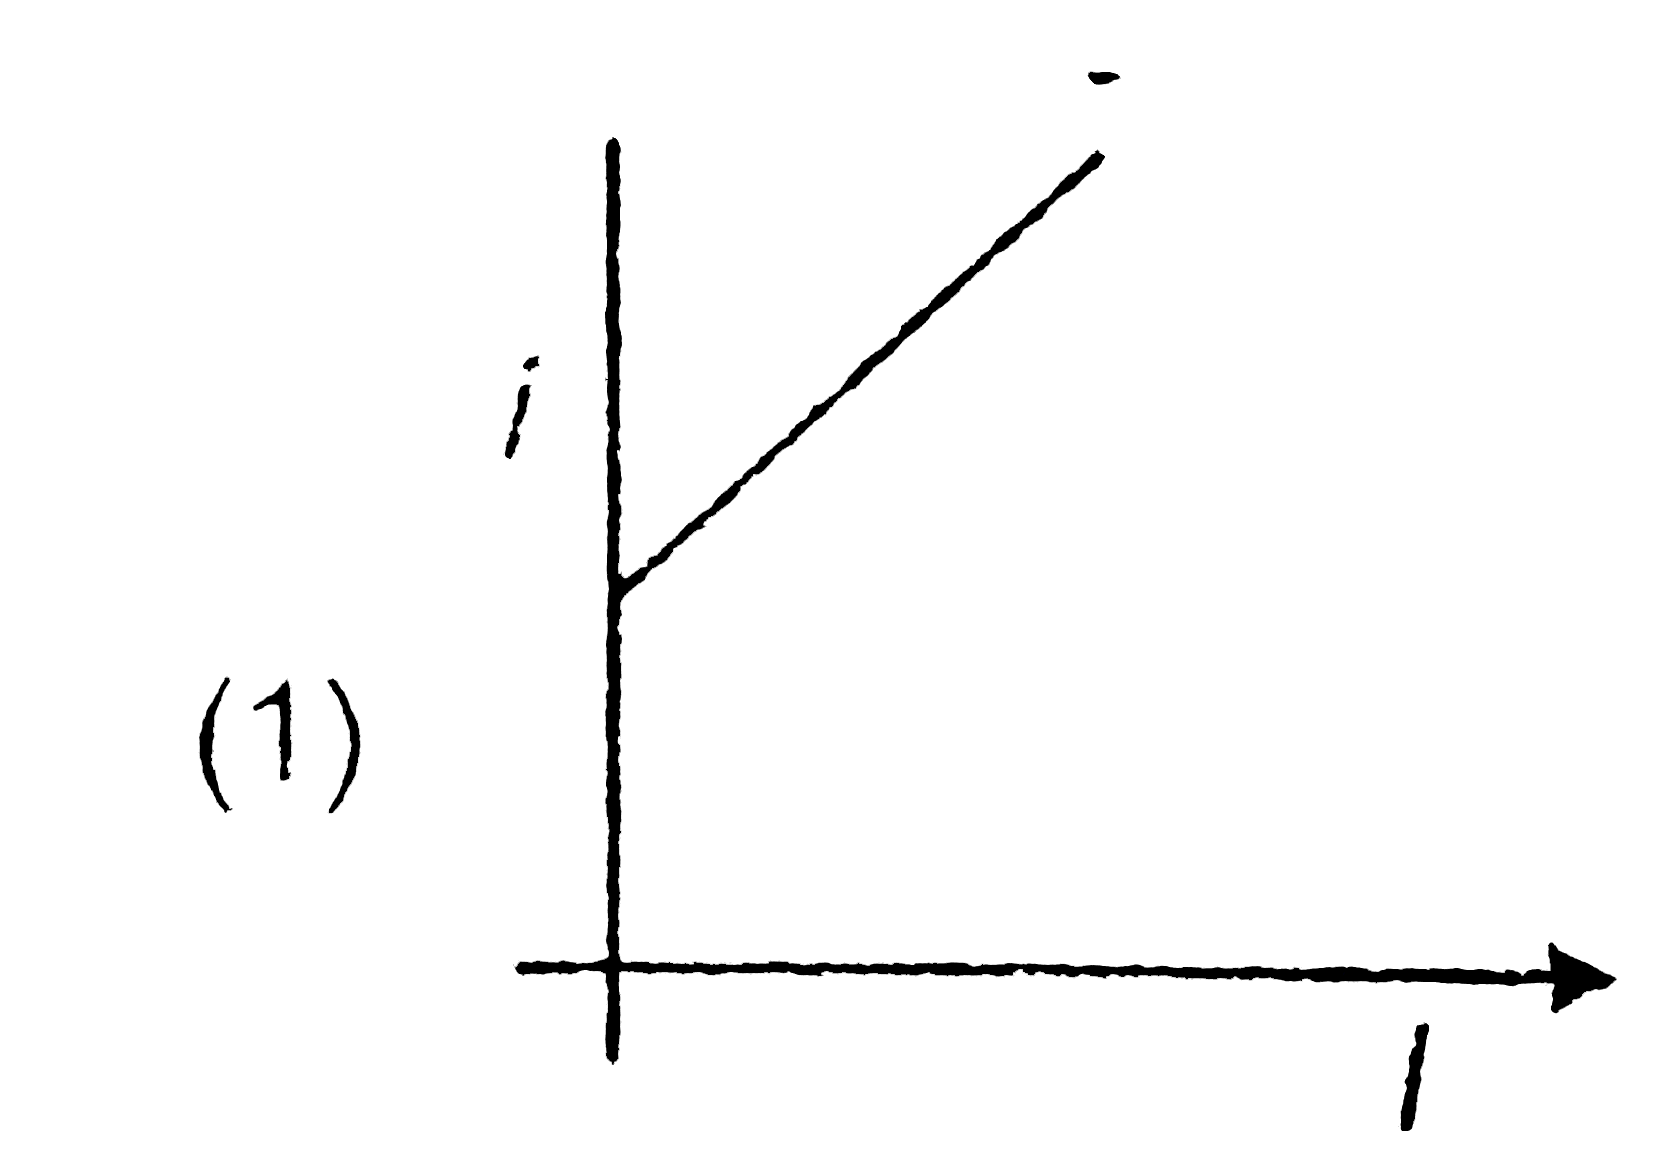
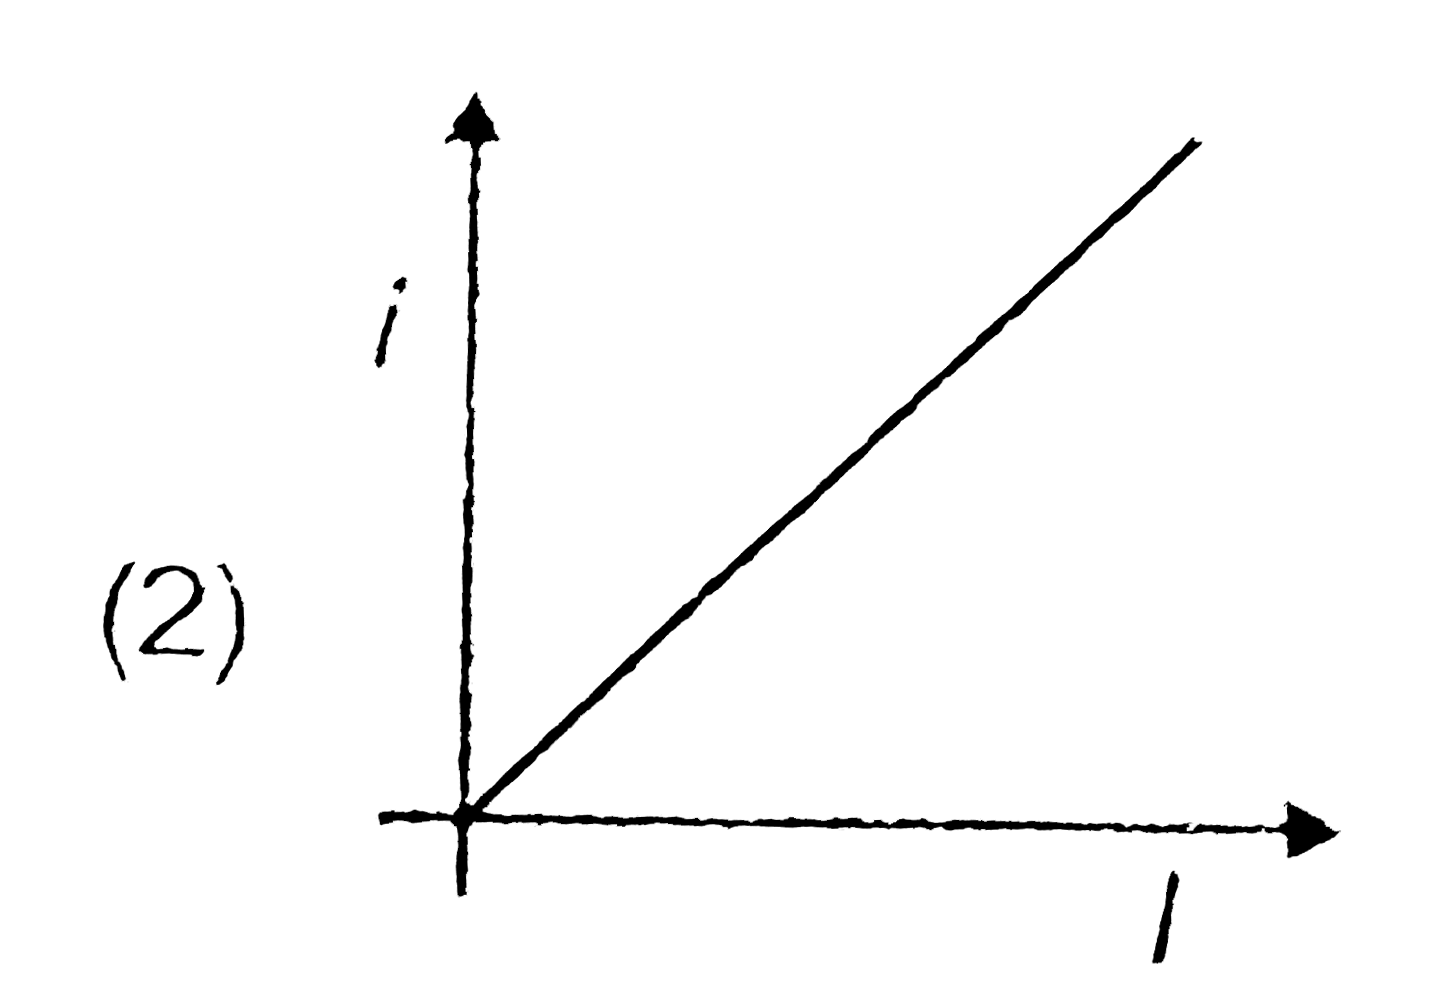
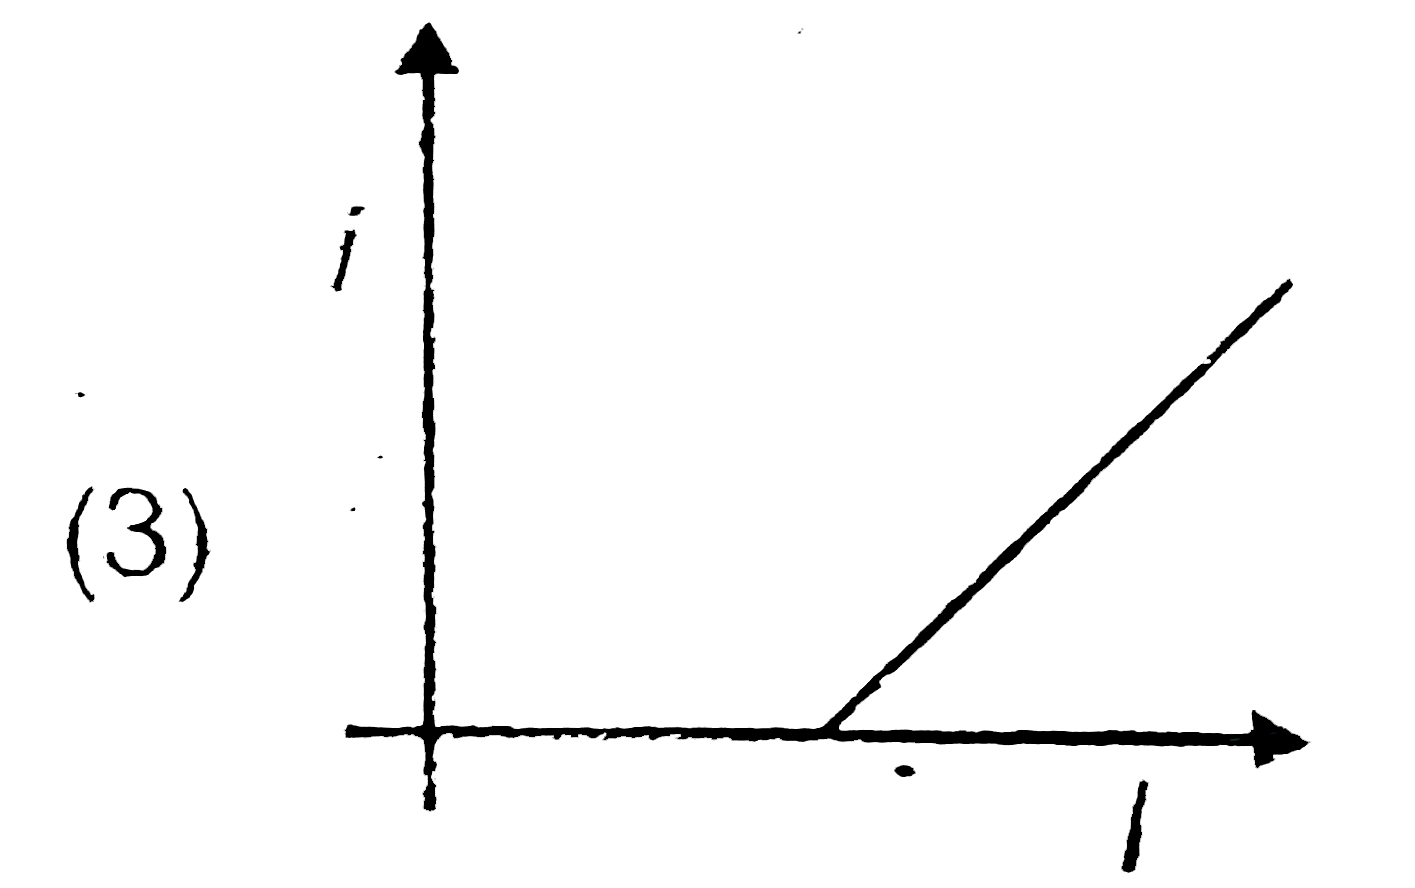
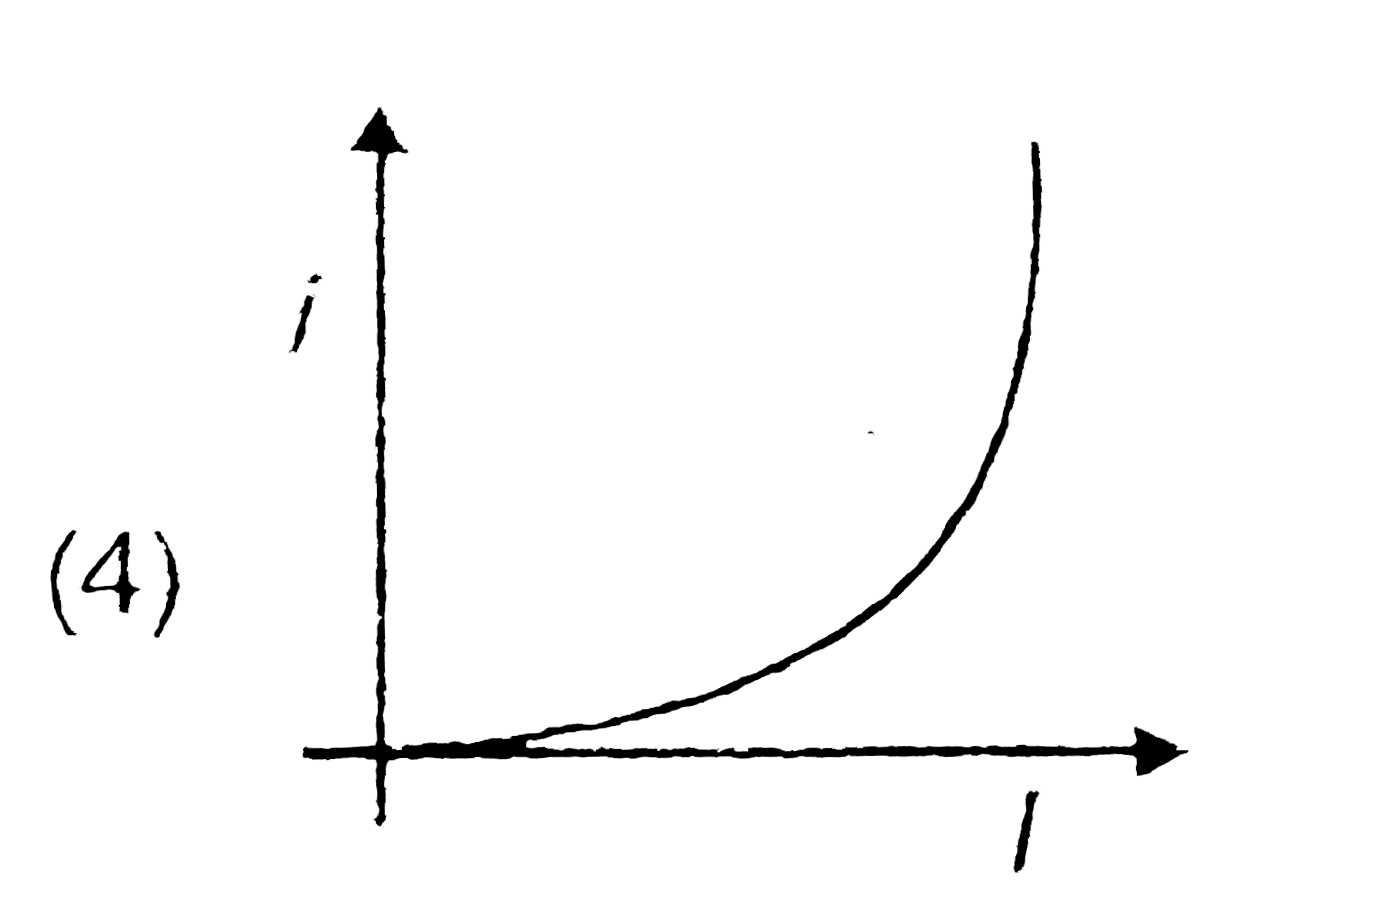
Draw a graph between intensity of light and photoelectric current for a given frequency .
Refer to theory
Photoelectric current is found to increase linearly with the intensity of light.
Topper's Solved these Questions
- BOOK - MODERN PUBLICATIONCHAPTER - DUAL NATURE OF RADIATION AND MATTER EXERCISE - Revision Exercises (Additional Questions)8videos
DUAL NATURE OF RADIATION AND MATTER
- BOOK - MODERN PUBLICATIONCHAPTER - DUAL NATURE OF RADIATION AND MATTER EXERCISE - Revision Exercises (Fill in the Blanks)11videos
DUAL NATURE OF RADIATION AND MATTER
- BOOK - MODERN PUBLICATIONCHAPTER - DUAL NATURE OF RADIATION AND MATTER EXERCISE - Higher Order Thinking Skills & Advanced Level (QUESTIONS WITH ANSWERS)8videos
DUAL NATURE OF RADIATION AND MATTER
- BOOK - MODERN PUBLICATIONCHAPTER - CURRENT ELECTRICITYEXERCISE - Chapter Practice Test15videos
CURRENT ELECTRICITY
- BOOK - MODERN PUBLICATIONCHAPTER - ELECTRIC CHARGES AND FIELDS EXERCISE - Chapter Practice Test15videos
ELECTRIC CHARGES AND FIELDS
Similar Questions
What is the effect of the intensity of incident radiation on the photoelectric current, for a given emitter material and p.d across the photoelectric cell ?
View SolutionAccording to Einstein's photoelectric equation, the graph between kinetic energy of photoelectrons ejected and the frequency of the incident radiation is :
View Solution
Knowledge Check
- Question 1 - Select One
The graph between stopping potential and intensity of light in photoelectric effect is
A B
B C
C D
D
- Question 2 - Select One
Explain photoelectric effect Explain the effect of increase of intensity of incident radiations on photoelectrons emitted by a photo-tube.
AincreasesBdecreasesCremains constantDfirst decrease and then increase constant - Question 3 - Select One
The graph between intensity of light falling on a metallic plate (l) with the current (i) generated is
A B
B C
C D
D
Light of frequency v=1.5v0 (where v0=threshold frequency) is incident on a photosensitive material and photoelectric current is I. if the frequency of incident light is halved and the intensity of light is doubled then the photoelectric current becomes_____.
View SolutionDraw graphs showing variation of photoelectric current with applied voltage for three incident radiations of equal frequency and different intensities. Mark the graph for the radiation of higher intensity.
View SolutionDraw a graph, showing the effect of potential on photoelectric current. Hence define stopping potential.
View SolutionThe graph between intensity of light falling on a metallic plate (I) with the current (i) generated is
View SolutionAccording to Einstein's photoelectric equation, the graph between the kinetic energy of photoelectrons ejected and the frequency of incident radiation is
View Solution
