Draw a schematic graph showing how the rate of first order reaction changes with change in concentration of reactants.
Step by step video & image solution for Draw a schematic graph showing how the rate of first order reaction changes with change in concentration of reactants. by Chemistry experts to help you in doubts & scoring excellent marks in Class 12 exams.
Updated on:21/07/2023Topper's Solved these Questions
- CHEMICAL KINETICSBOOK - DINESH PUBLICATIONCHAPTER - CHEMICAL KINETICSEXERCISE - Effect of temperature and catalyst on rate of reaction.
15 Videos
- CHEMICAL KINETICSBOOK - DINESH PUBLICATIONCHAPTER - CHEMICAL KINETICSEXERCISE - Select the correct answer.
100 Videos
- CHEMICAL KINETICSBOOK - DINESH PUBLICATIONCHAPTER - CHEMICAL KINETICSEXERCISE - Assertion Reason type questions
5 Videos
- CHEMICAL BONDING AND MOLECULAR STRUCTUREBOOK - DINESH PUBLICATIONCHAPTER - CHEMICAL BONDING AND MOLECULAR STRUCTUREEXERCISE - Unit Test - 1
20 Videos
- CHEMICAL THERMODYNAMICS AND CHEMICAL ENERGETICS BOOK - DINESH PUBLICATIONCHAPTER - CHEMICAL THERMODYNAMICS AND CHEMICAL ENERGETICS EXERCISE - Exercise
507 Videos
Similar Questions
Knowledge Check
In a first order reaction with time the concentration of the reactant decreases
AlinearlyBexponentiallyCno changeDNone of theseFor a first order reaction, the concentration of reactant :
Ais independent of timeBvaries linearly with timeCvaries exponentially with timeDNoneThe increase in concentration of the reactants lead changes in
AΔHBCollision frequencyCActivation energyDEquilibrium constant
For a first order reaction, the rate of the reaction doubled as the concentration of the reactant is doubled.
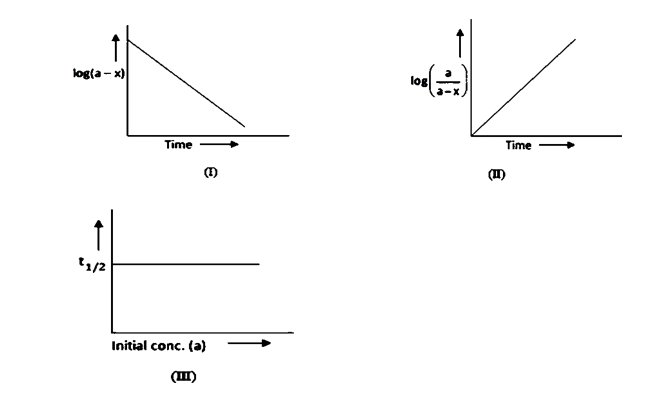
View SolutionWhich of the following is/are correct for the first order reaction ? (a is initial concentration of reactant, x is concentration of the reactant reacted and t is time)

View SolutionThe increase in concentration of the reactants lead changes in
View SolutionStatement-2: The reciprocal of time in which 66% of the reactant is conveted to product is equal to the rate constant of first order reaction.
Because
Stetment-2 : The rate constant for first order reaction depends on initial concentration of reactants.
View SolutionIn a first order reaction , on plotting a graph between t1/2 and concentration of reactant
View Solution
