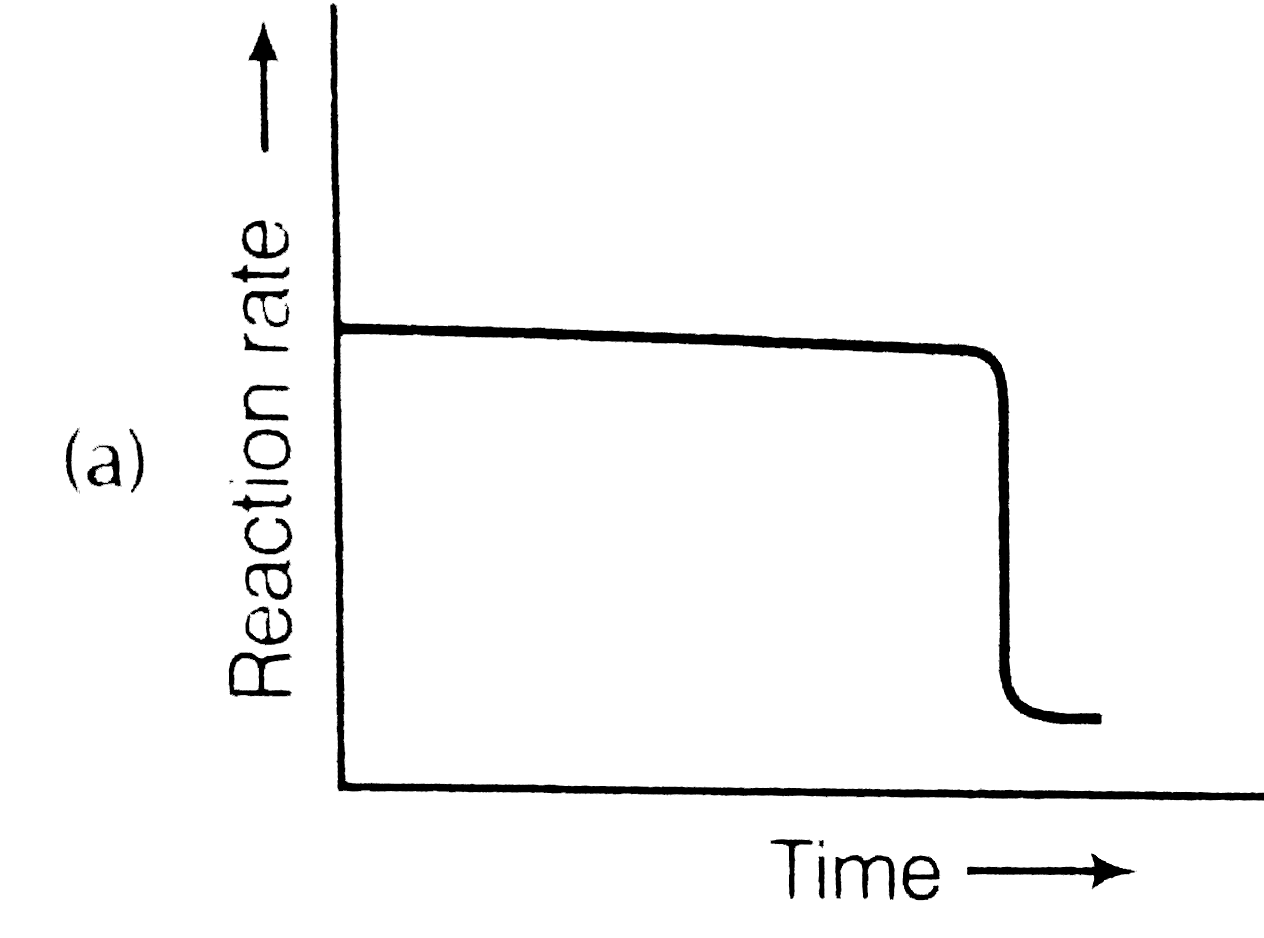
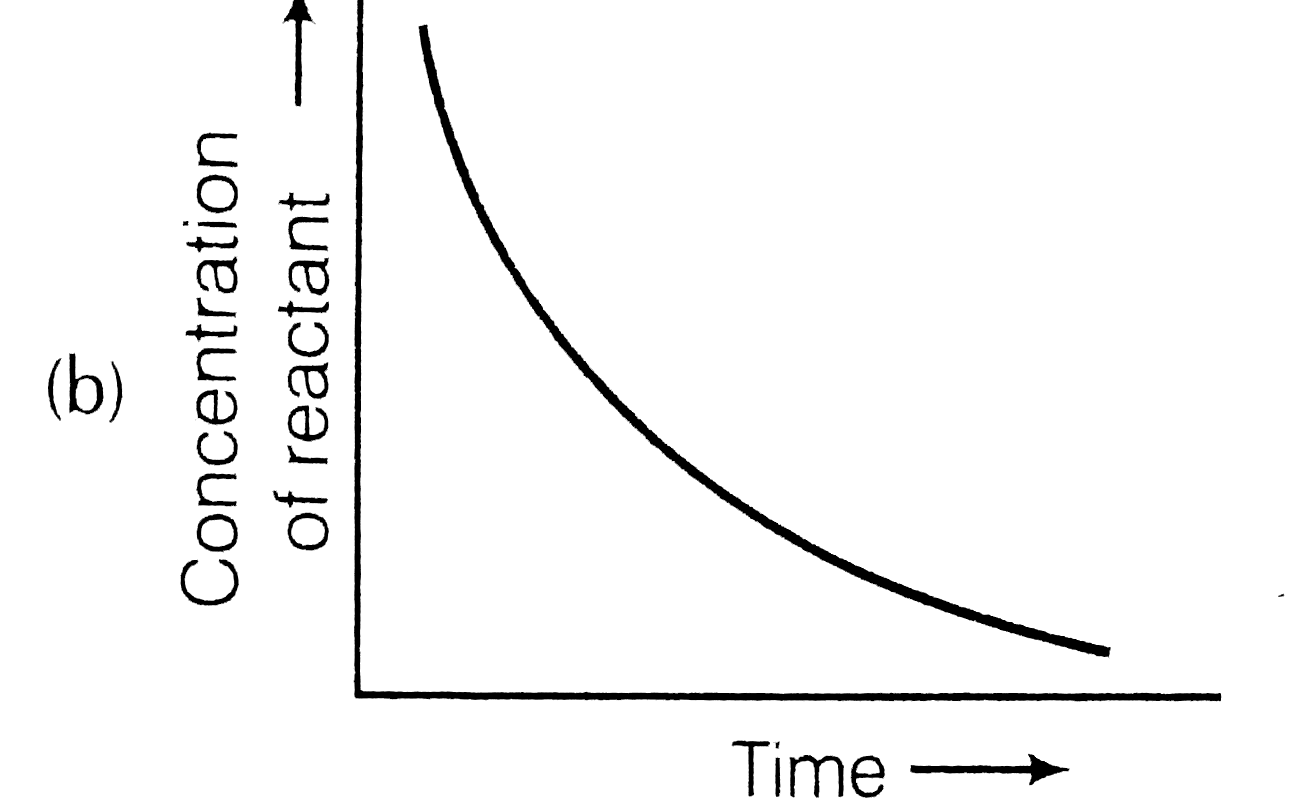
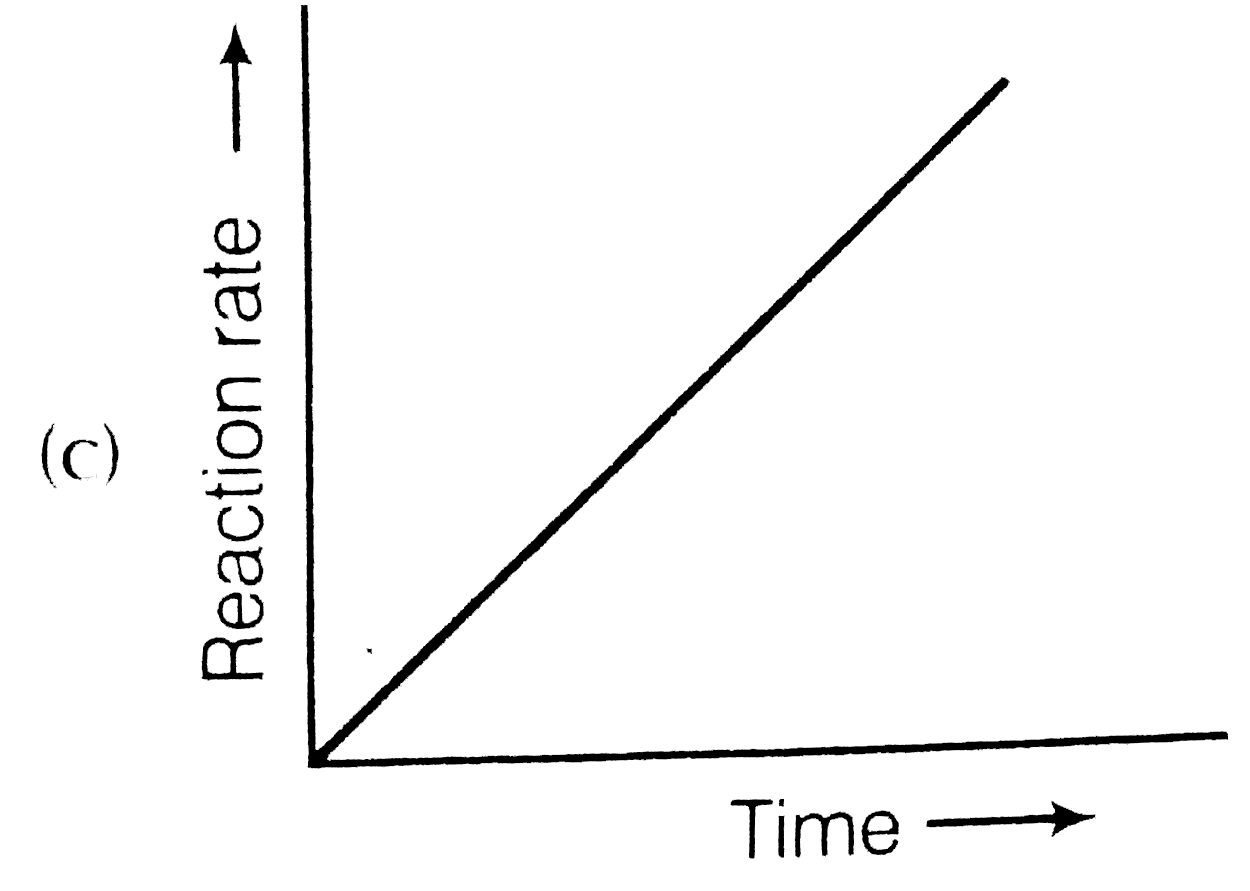
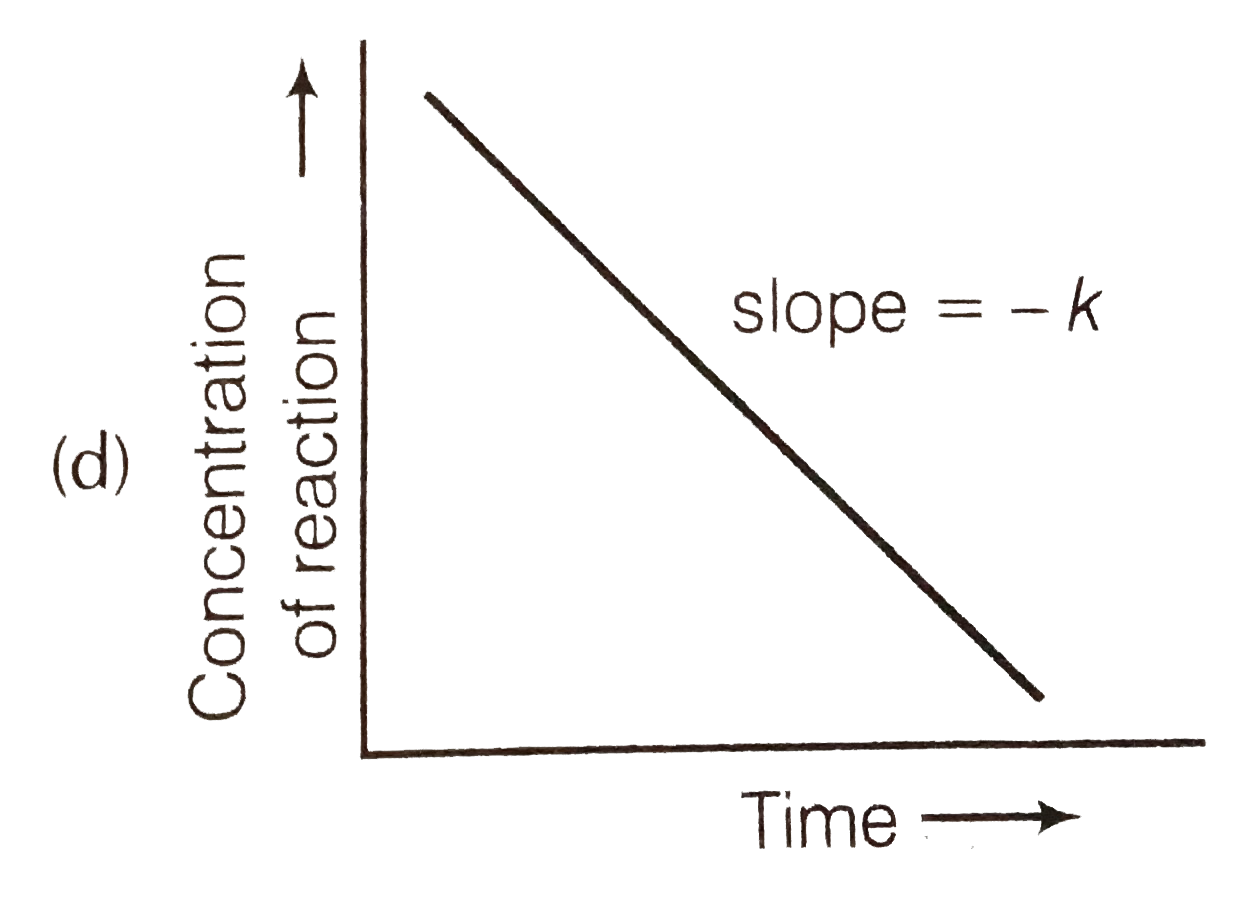
Which of the following graph is correct for a zero order reaction ?
A
B
C
D
Text Solution
The correct Answer is:A, D
For a zero order reaction [R]=(−k)↑t↑+[R]0↑
y=m×x+c
On comparing with Eq. of straight line
y=[R] concentration
x=t time
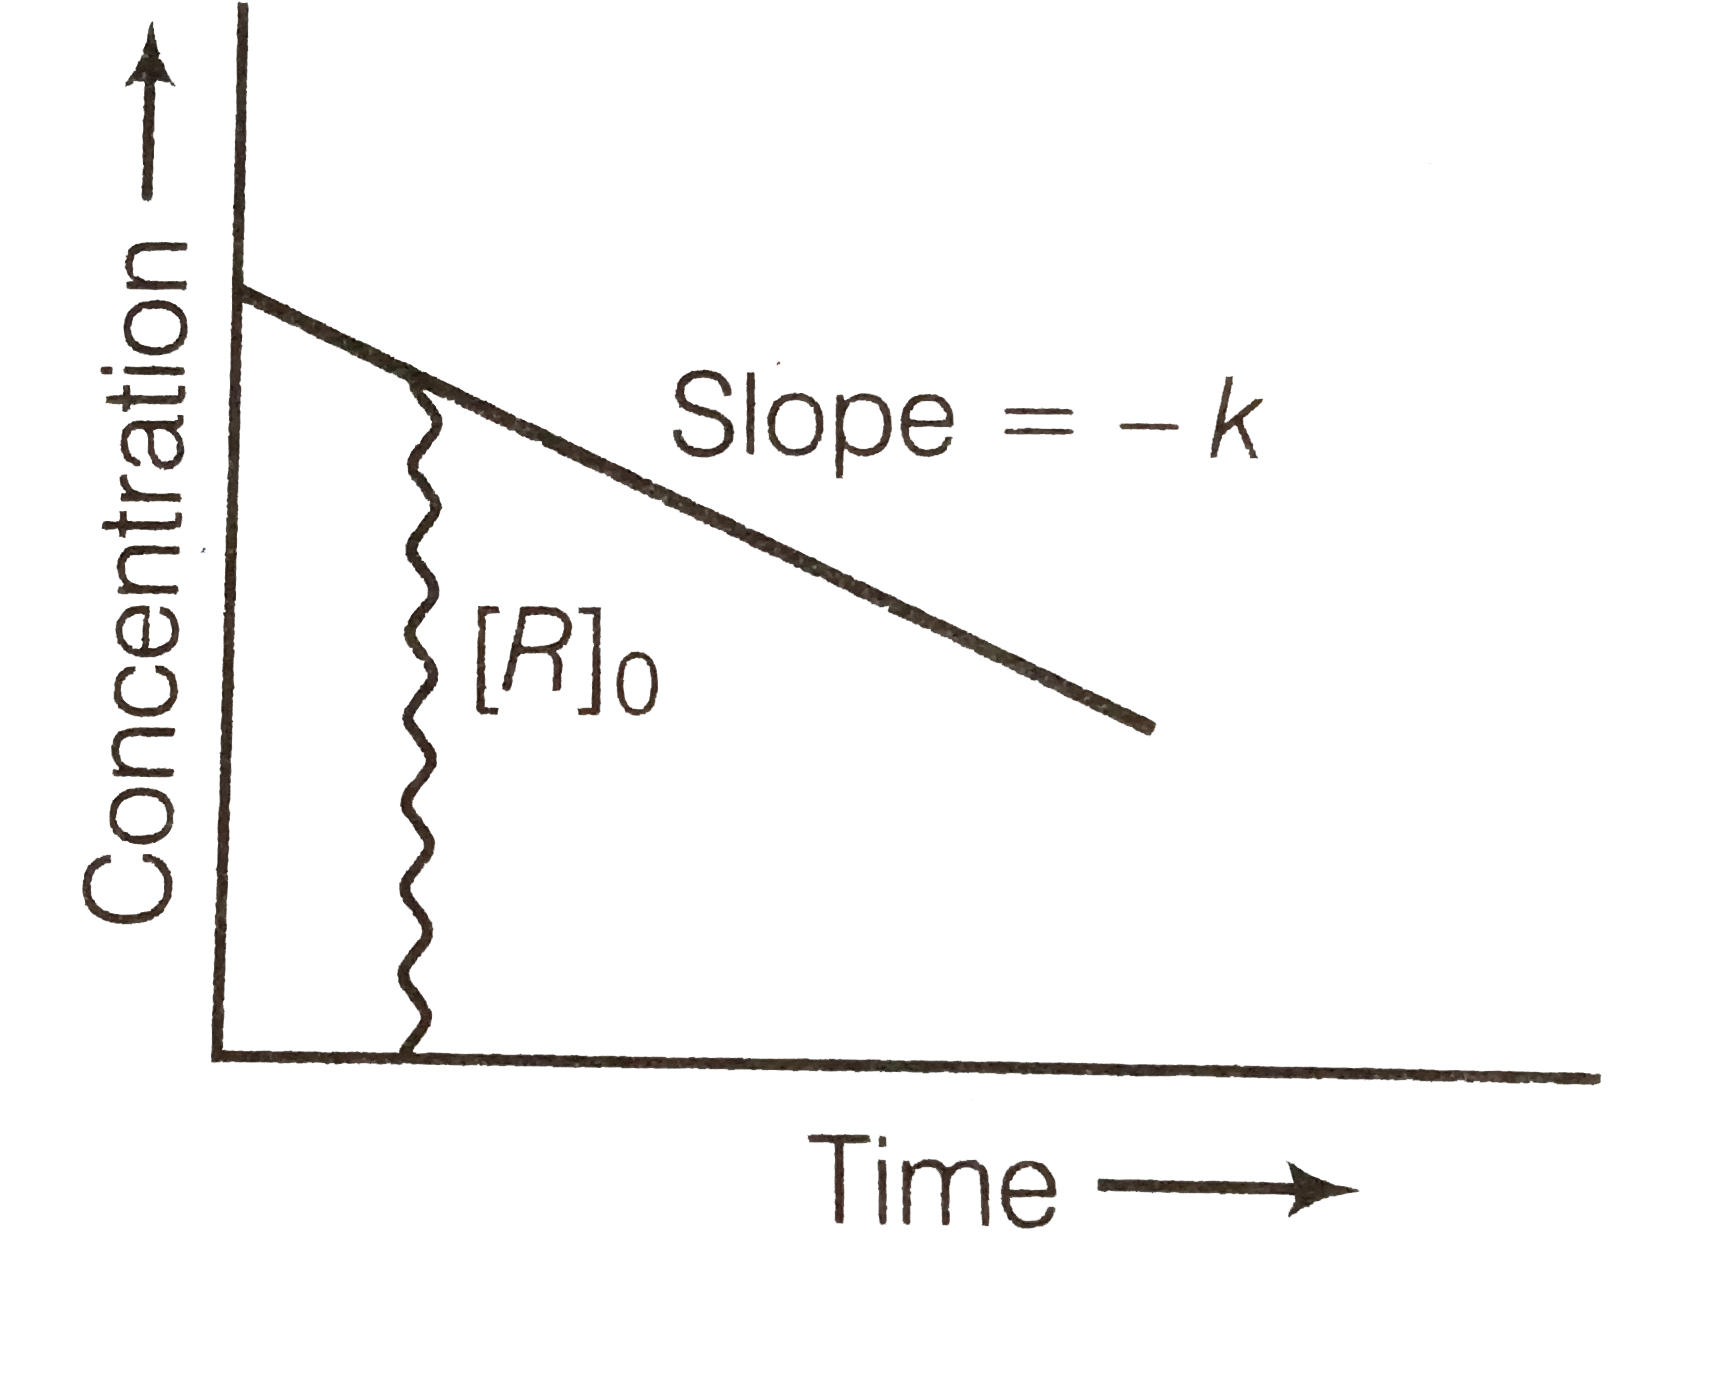
Slope(m)=−k rate constant
Intercept(c)=[R]0 initial concentration
On rearranging Eq. (i)
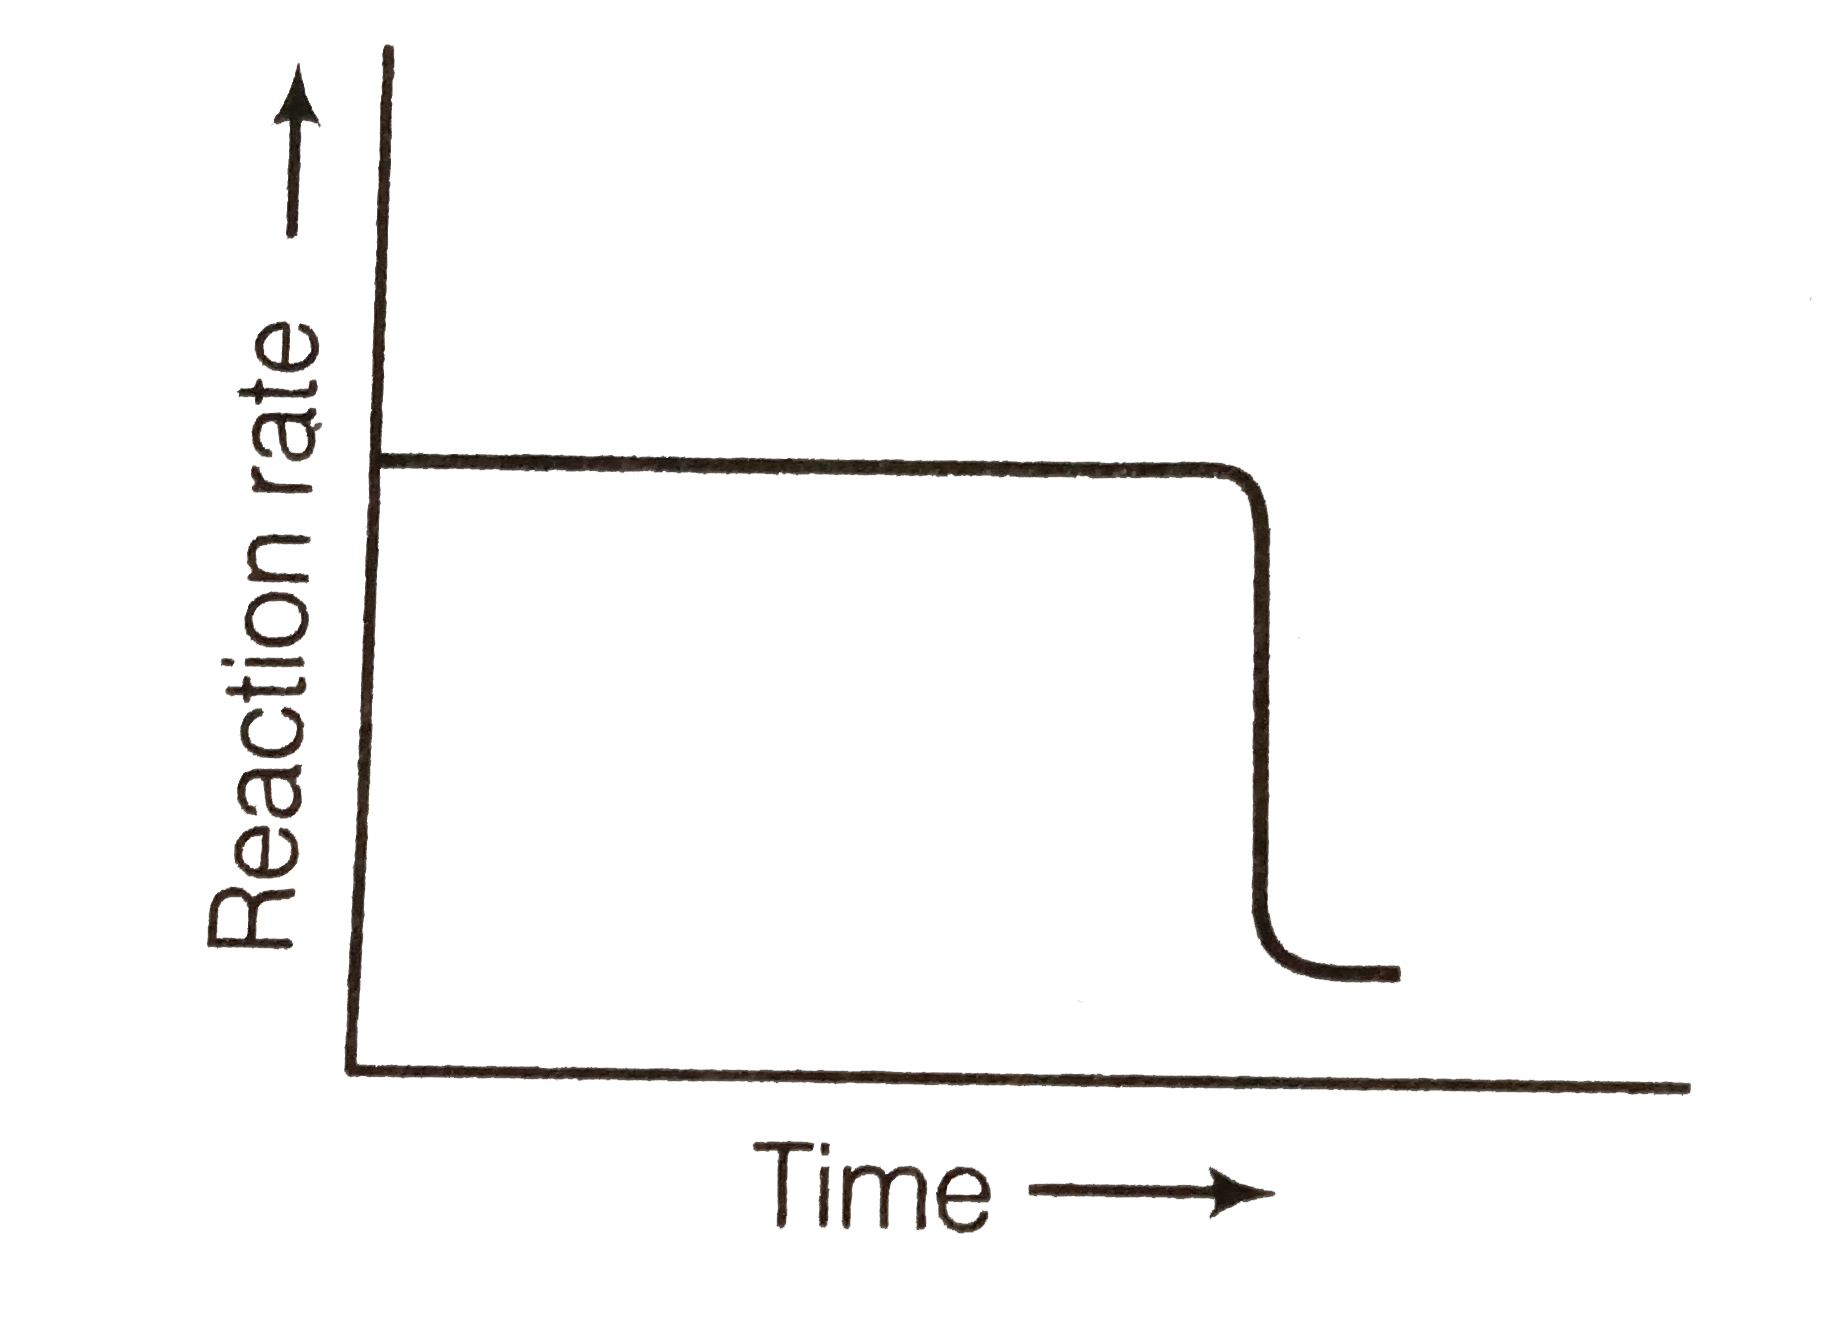
[R]−[R]0t=−k
[R]−[R]0t=−kt0
Rate∝t0
|
Topper's Solved these Questions
Similar Questions
Knowledge Check
Which of the following graphs is correct for a zero order reaction ?
A B
B C
C D
D
Which of the following graphs is correct for a zero order of reaction?
A B
B C
C D
D
Which of the following graph is correct for zero order reaction?
A B
B C
C D
D
Which of the following graph is correct for a first order reaction ?
View SolutionWhich of the following graph is correct for a first order reaction ?
View SolutionWhich of the following graphs is correct for a first order reaction?
View SolutionWhich of the following graphs is correct for a first order reaction ? (R→P)
View SolutionWhich of the following graphs is correct for second order reaction ?
View Solution
