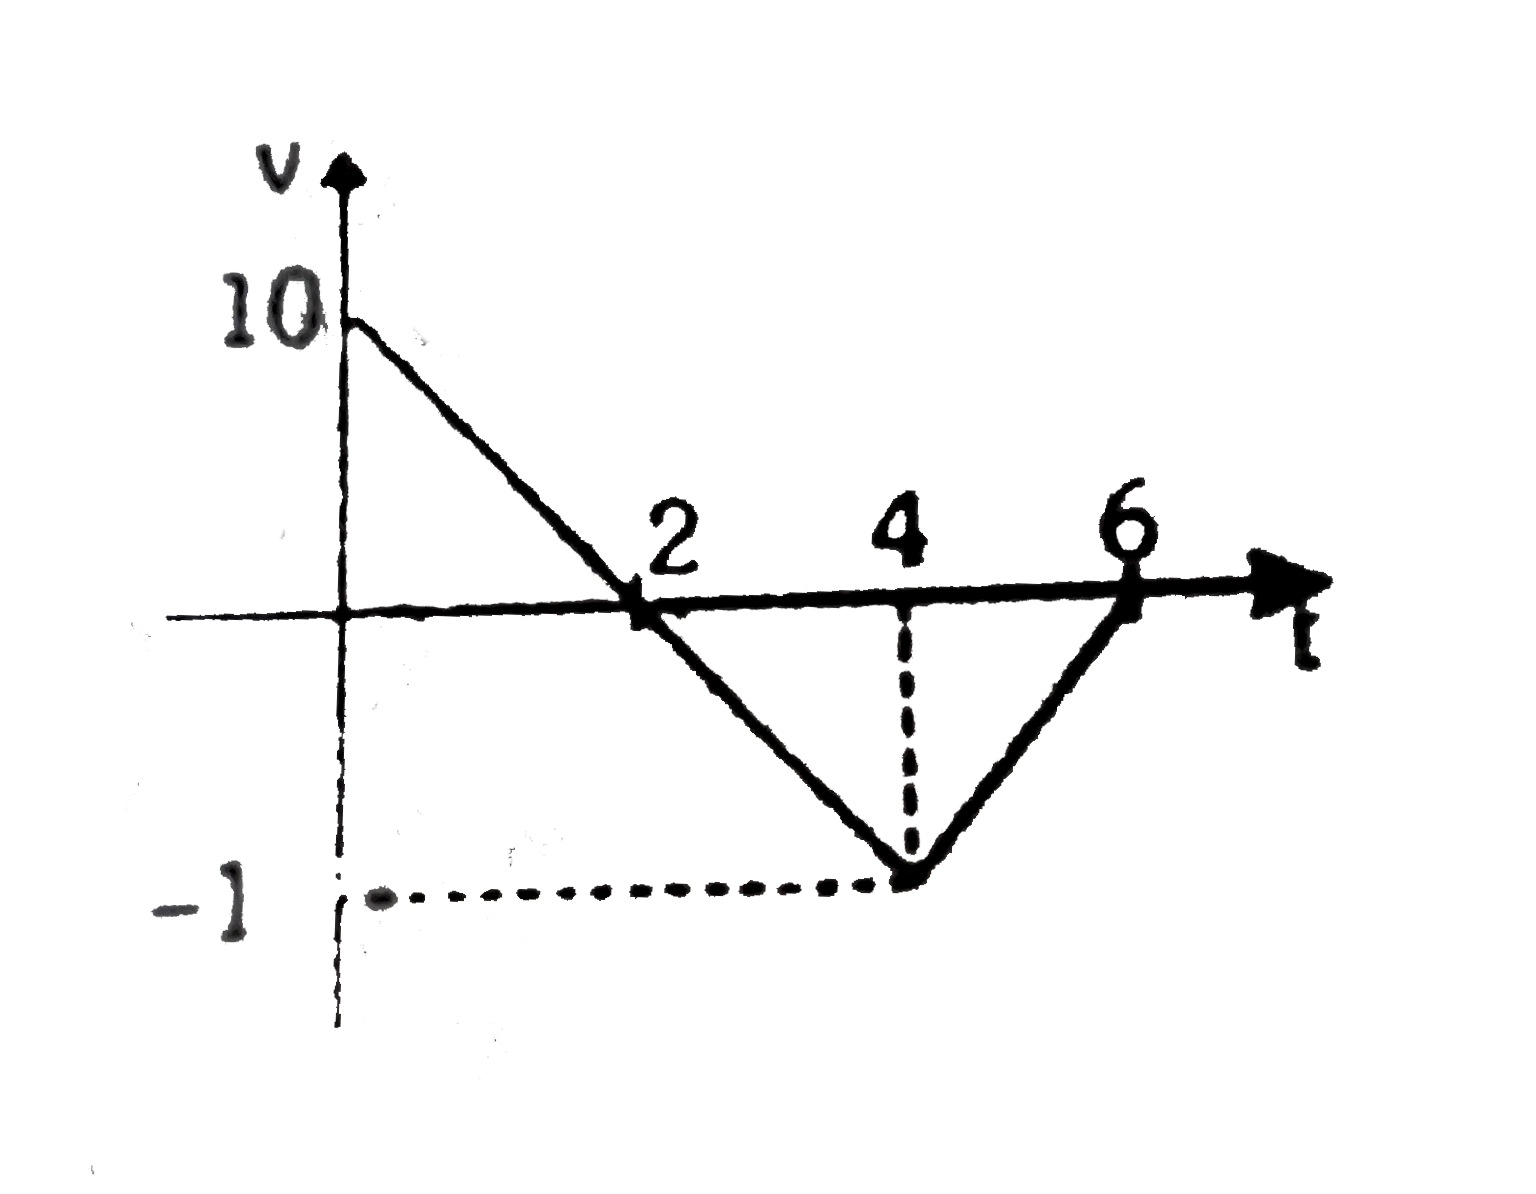
For the velocity -time graph shown in figure, in a time interval from t=0 to t=6s, match the following:

Column IColumn II(A)Change in velocity(p)−5/3SIunit(B)Average acceleration(q)−20SIunit(C)Total displacement(r)−10SIunit(D)Acceleration ay t=3s(s)−5SIunit
The correct Answer is:A, B, C, D
υi=+10ms−1 and υf=0
∴Δυ=υf−υi=−10ms−1
aav=ΔυΔt=−106=−53ms−2
Total displacement = area under υ−t graph (with sign)
=12×10×2−12×2×10
=−10m
And acceleration = slope of υ−t graph
=−102=−5ms−2
Topper's Solved these Questions
- BOOK - DC PANDEYCHAPTER - MOTION IN A PLANEEXERCISE - (C )Medical entrances gallery32videos
MOTION IN A PLANE
- BOOK - DC PANDEYCHAPTER - MOTION IN A PLANEEXERCISE - (B) Meical entrance special format questions (Assertion and reason)19videos
MOTION IN A PLANE
- BOOK - DC PANDEYCHAPTER - MOTIONEXERCISE - Medical entrances gallery19videos
MOTION
- BOOK - DC PANDEYCHAPTER - PROJECTILE MOTIONEXERCISE - Level - 2 Subjective10videos
PROJECTILE MOTION
Similar Questions
A balloon rises up with constant net acceleration of 10m/s2. After 2 s a particle drops from the balloon. After further 2 s match the following : (Takeg=10m/s2)
Column IColumn II(A)Height of perticle from ground(p)Zero(B)Speed of particle(q)10SIunits(C)Displacement of Particle(r)40SIunits(D)Acceleration of particle(s)20SIunitsView SolutionIn the s-t equation (s=10+20t−5t2) match the following columns.
∣∣ ∣ ∣ ∣ ∣ ∣∣Column IColumn II(A)Distancec travelled in 3s(p)−20 units(B)Displacement 1 s(q)15 units(C)Initial acceleration(r)25 units(D)Velocity at 4 s(s)−10 units∣∣ ∣ ∣ ∣ ∣ ∣∣View Solution
Knowledge Check
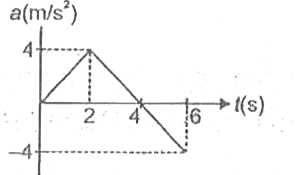
- Question 1 - Select One
For the acceleration - time (a - t) graph shown in figure, the change in velocity of particle from t = 0 to t = 6 s is
 A10 m/sB4 m/sC12 m/sD8 m/s
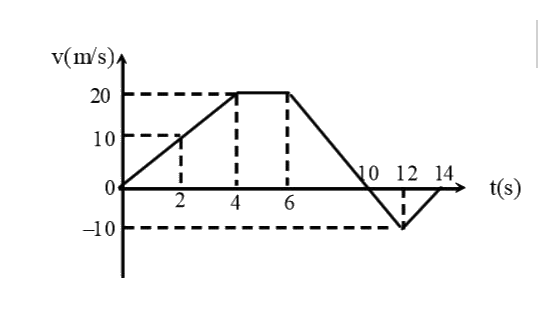
 - Question 2 - Select One
Velocity-time graph of a particle moving in a straight line is shown in figure. In the time interval from t = 0 to t = 14 s, find:

Q. average velocity andA(507)m/sB(257)m/sC(207)m/sD(157)m/s
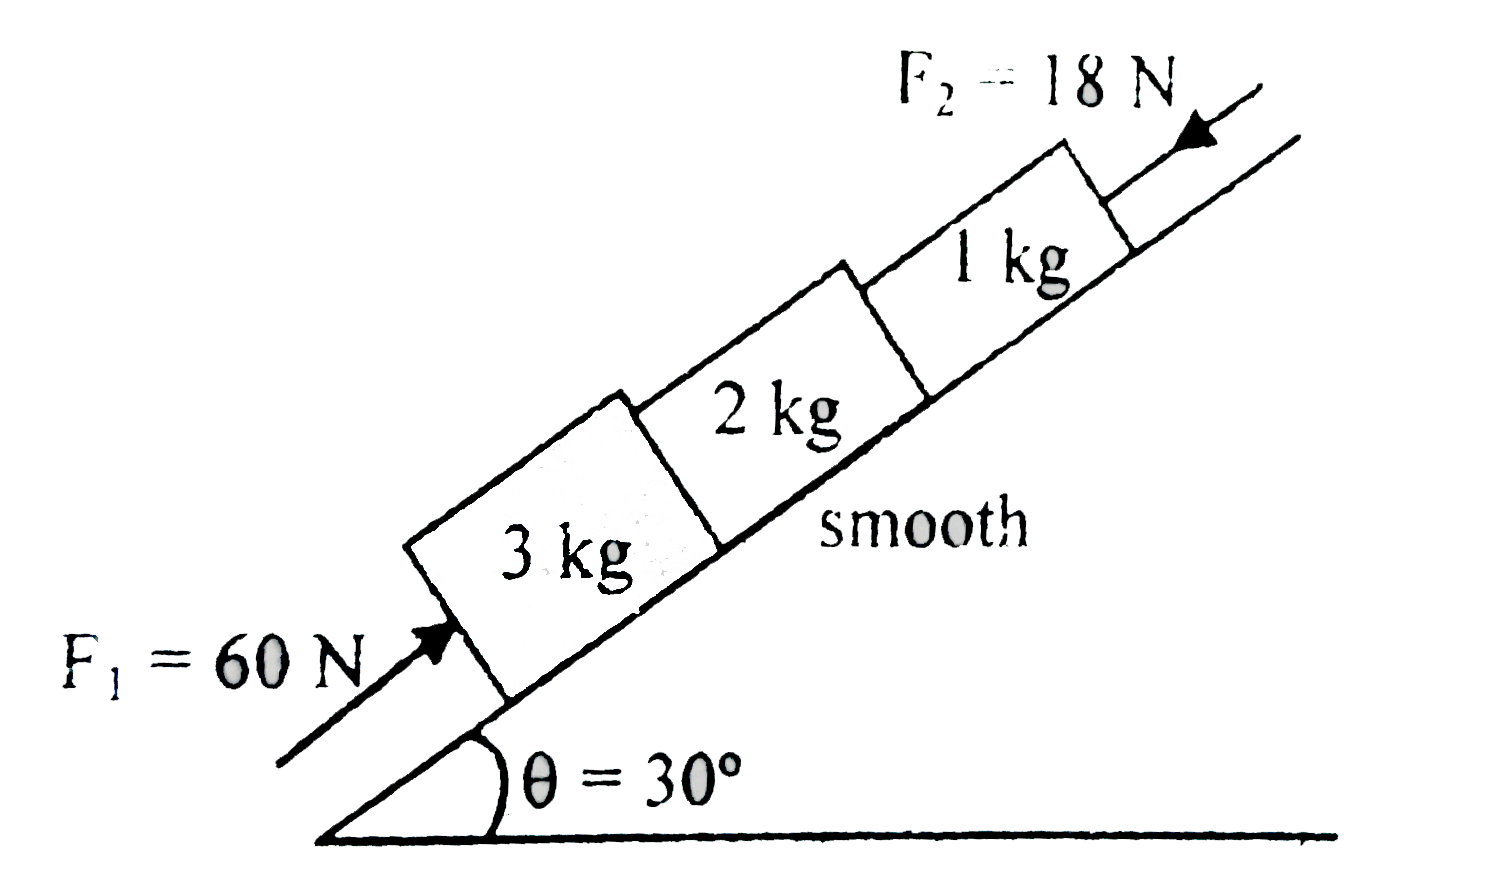
In the diagram shown in figure, match the following (g=10m/s2)

Column-IColoumn-II(A)Acceleration of 2kg block(P)8 Si unit(B)Net force on 3kg block(Q)25 SI unit(C)Normal reaction between 2 kg and 1kg(R)2 SI unit(D)Normal reaction between 3 kg and 2kg (S) 45 SI unit(T) NoneView SolutionIn the diagram shown in figure, match the following columns (take g=10ms−2)

Column IColumn II(A) Normal reaction(p) 12 SI unit(B) Force of friction(q) 20 SI unit(C) Acceleration of block(r) zero(s) 2 SI unitView SolutionA particle is rotating in a circle of radius 1m with constant speed 4m/s. In time 1s, match the following (in SI units)
Column IColumn II(A)Displacement(p)8sin2(B)Distance(q)4(C)Average velocity(r)2sin2(D)Average acceleration(s)4sin2View SolutionMatch the following
Column-IColumn-II(A)Derived unit(p)Height(B)Fundamental unit(q)Thickness(C)Derived quantity(r)Area(D)Fundamental quantity(s)Newton(t)KilogramView SolutionMatch the following
Column-IColumn-II(A)unit of length in F.P.S(p)m(B)unit of mass in C.G.S(q)foot(C)unit of time(r)metre(s)gm(t)secondView SolutionMatch the following columns.
∣∣ ∣ ∣ ∣ ∣ ∣ ∣ ∣∣Column IColumn II(A)d v/dt(p)Acceleration(B)d|v|/dt(q)Magnitude of acceleration(C)drdt(r)Velocity(D)∣∣drdt∣∣(s)Magnitude of velocity(t)Rate of change of speed∣∣ ∣ ∣ ∣ ∣ ∣ ∣ ∣∣View Solution

