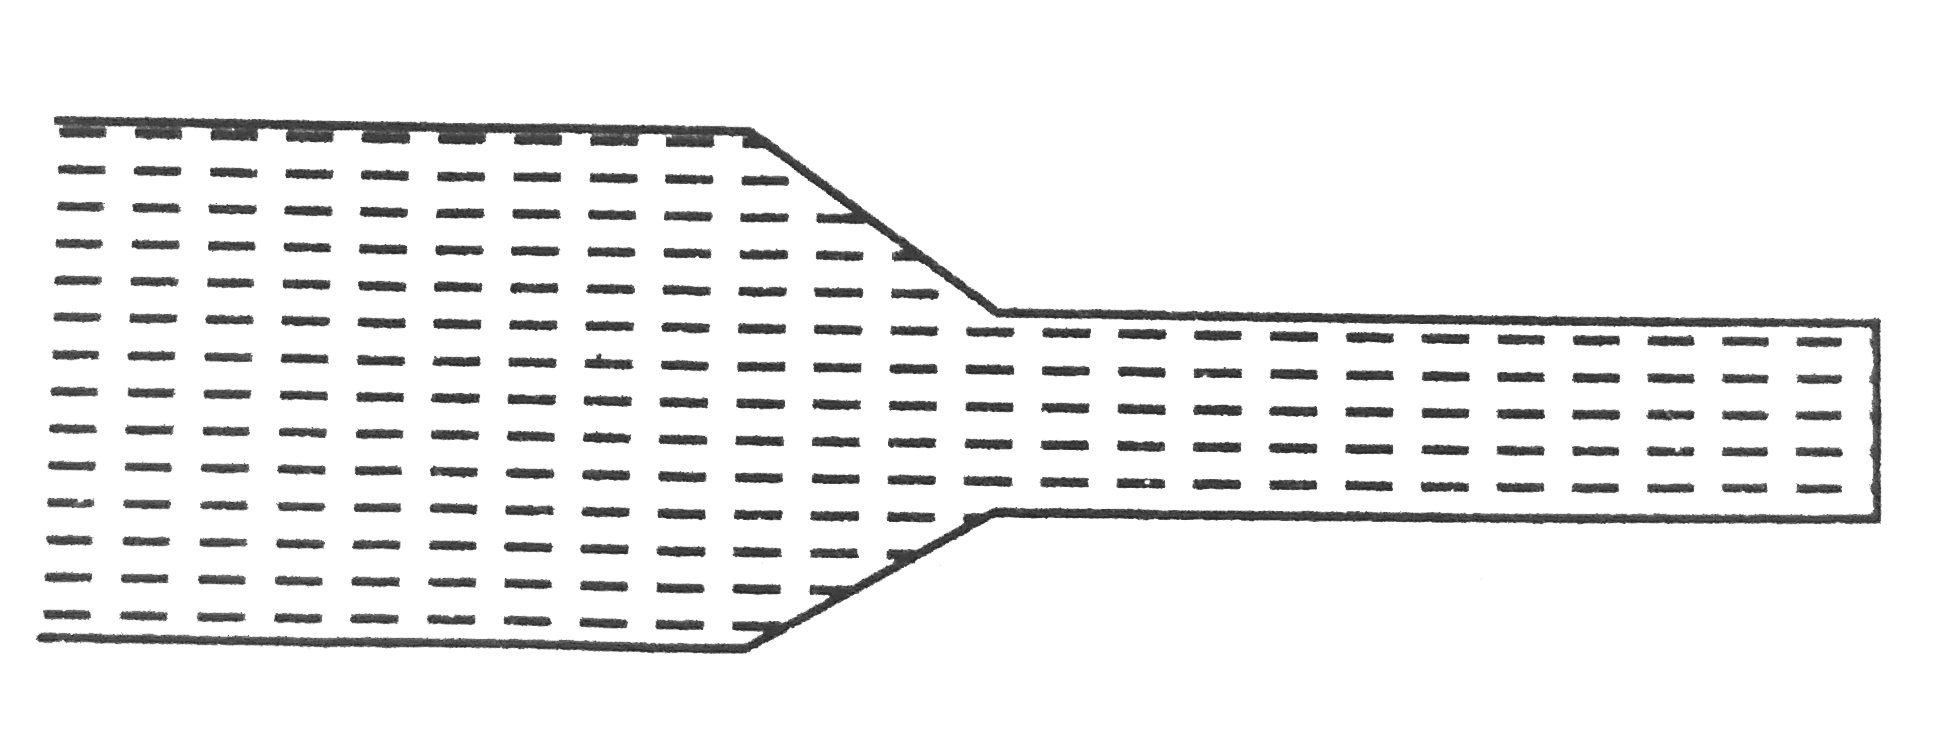
A non viscous liquid is flowing through a frictionless duct, cross-section varying as shown in figure.

Which of the following graph represents the variation of pressure p along the axis of tube ?
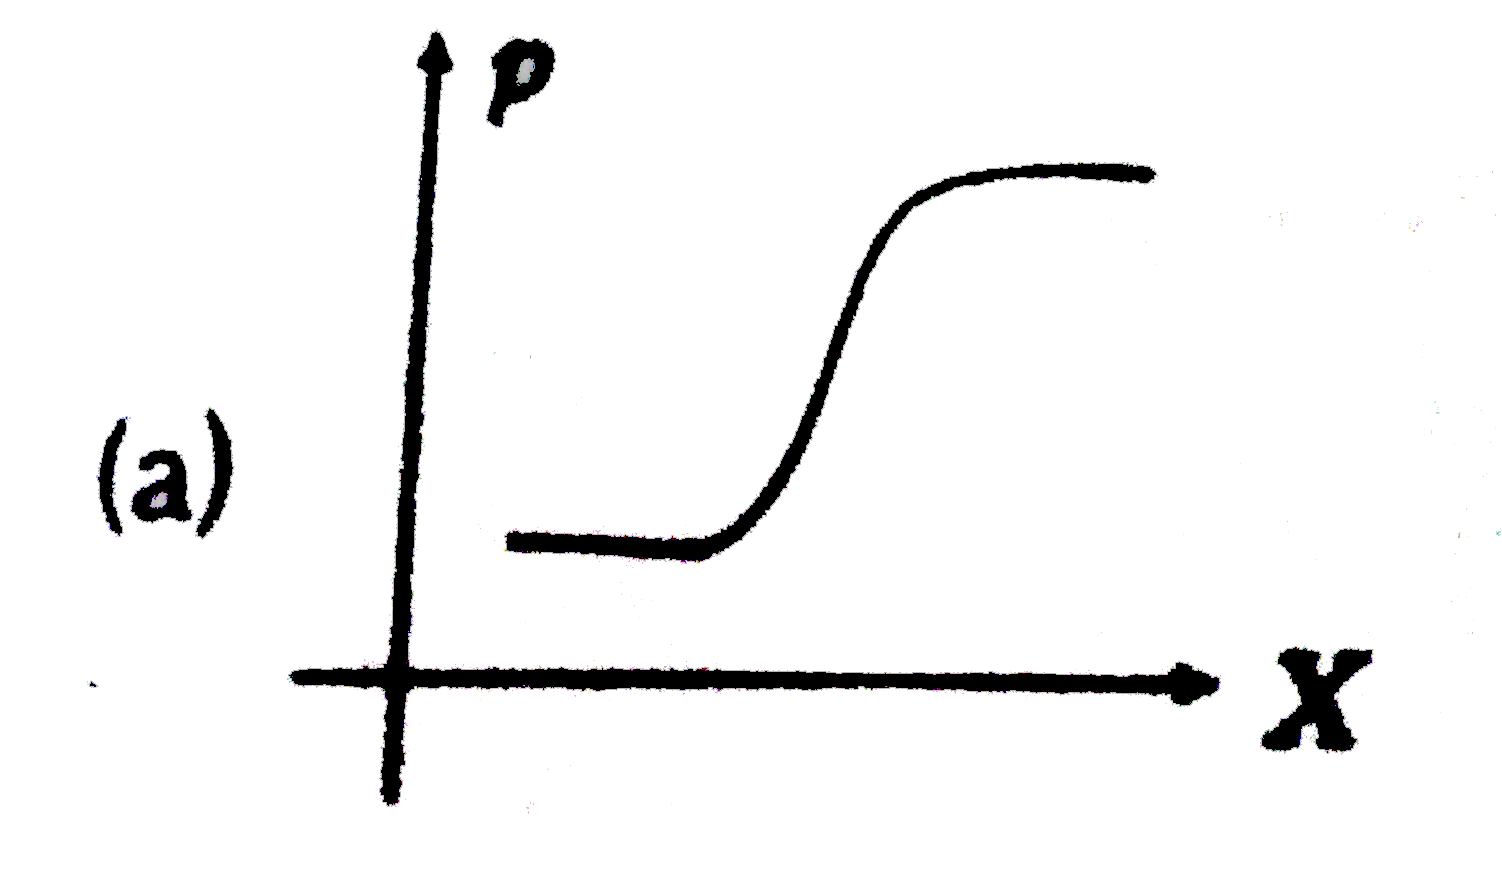
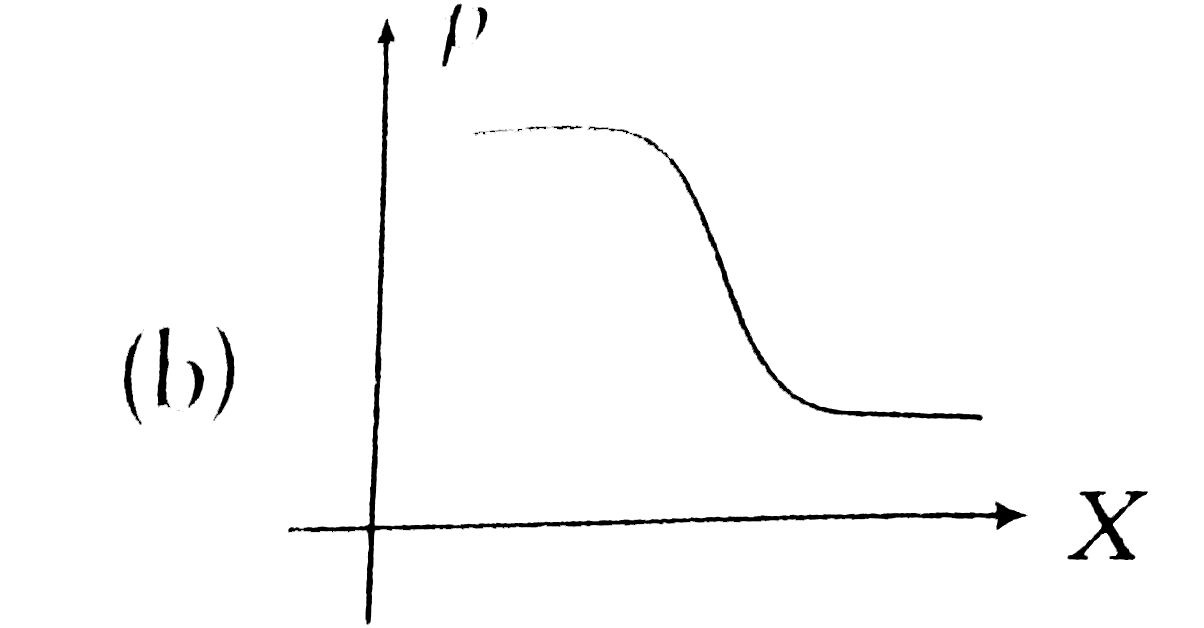

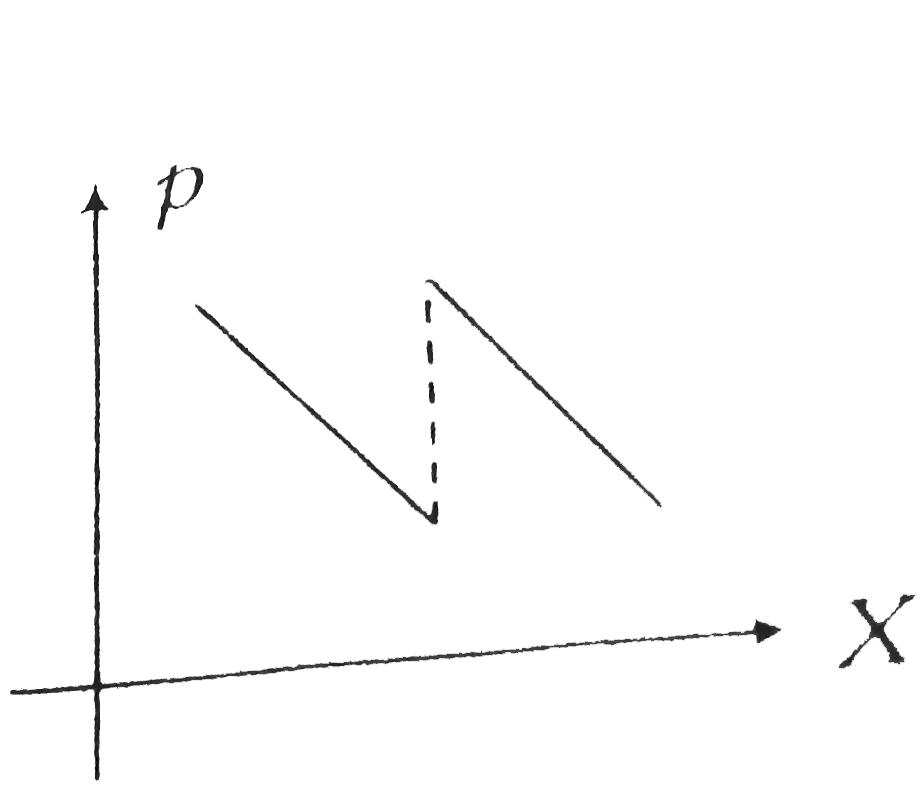
The correct Answer is:B
As we know according to equation of continuity, when cross-section of duct decreases, the velocity of flow of liquid increases and in accordance with Bernoullis therem in a horizontal pipe. Gh=raph (b) correctly repersents the variation of pressure.
Topper's Solved these Questions
- BOOK - DC PANDEYCHAPTER - FLUID MECHANICSEXERCISE - B) Medical entrance special format question19videos
FLUID MECHANICS
- BOOK - DC PANDEYCHAPTER - FLUID MECHANICSEXERCISE - Match the columns6videos
FLUID MECHANICS
- BOOK - DC PANDEYCHAPTER - FLUID MECHANICSEXERCISE - Check point 13.410videos
FLUID MECHANICS
- BOOK - DC PANDEYCHAPTER - EXPERIMENTSEXERCISE - Subjective15videos
EXPERIMENTS
- BOOK - DC PANDEYCHAPTER - GENERAL PHYSICSEXERCISE - INTEGER_TYPE2videos
GENERAL PHYSICS
Similar Questions
The velocity -displacement graph of a particle is as shown in the figure. Which of the following graphs correctly represents the variation of acceleration with displacement?
 View Solution
A viscous liquid flows through a horizontal pipe of varying cross-sectional area. Identify the option which correctly represents the variation of height of rise of liquid in each vertical tube
View Solution
Knowledge Check
- Question 1 - Select One
Which of the following figures represents the cross section of an OV?
A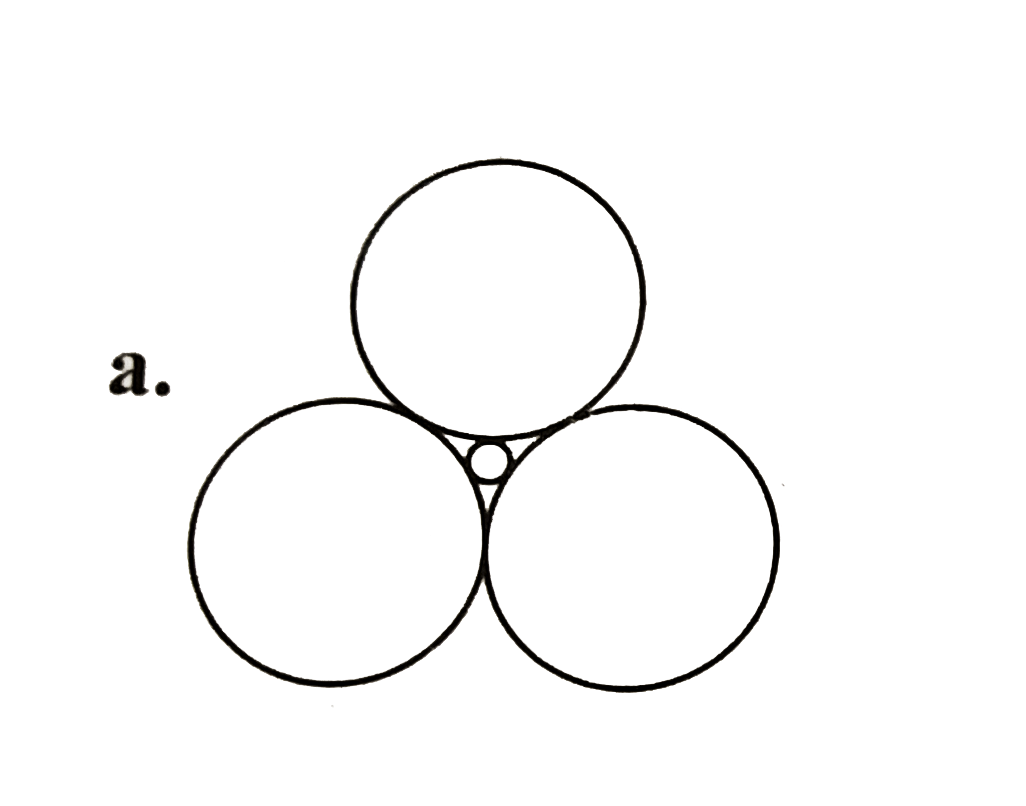 B
B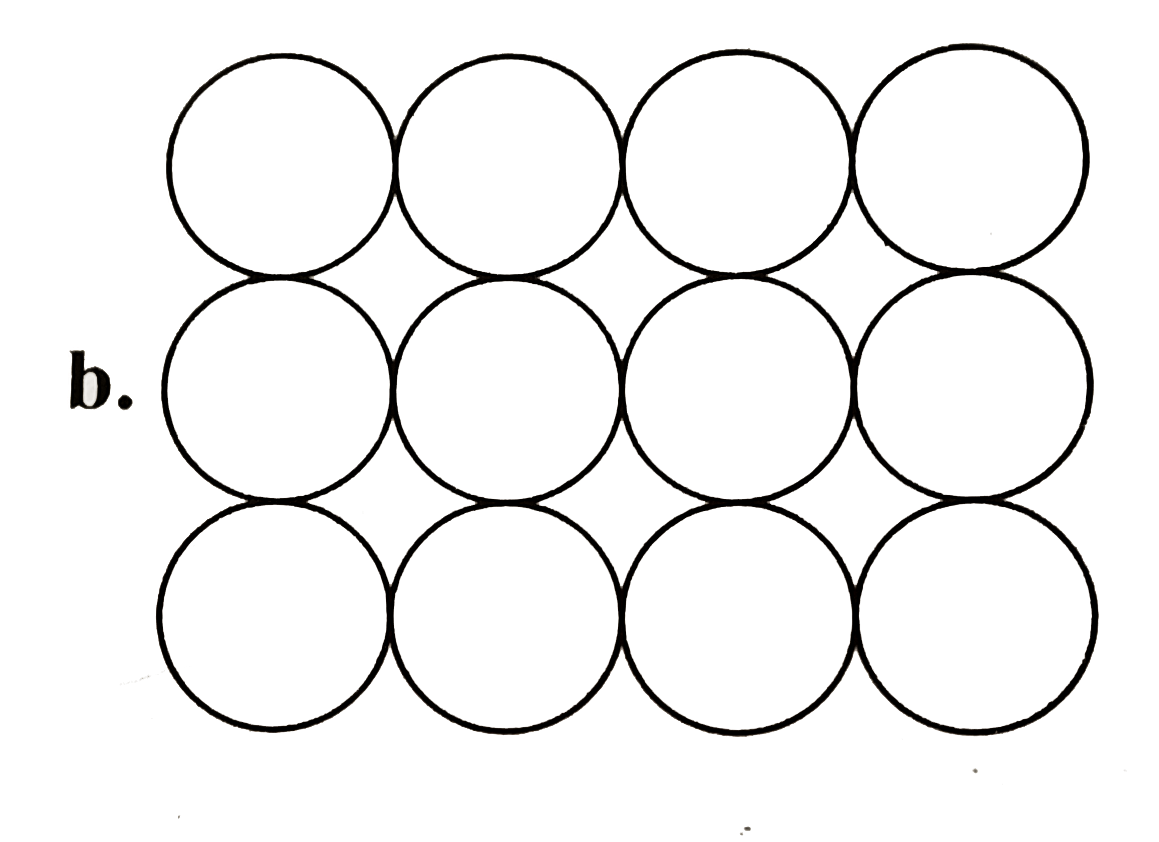 C
C D
D
- Question 2 - Select One
which of the following graph represents the variation of resistivity (ρ) with temperature (T) for copper?
A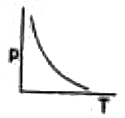 B
B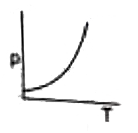 C
C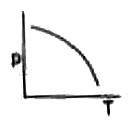 D
D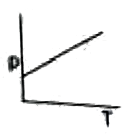
- Question 3 - Select One
Water flows through a frictionless duct with a cross-section varying as shown in fig. Pressure P at points along the axis is represented by
 A
A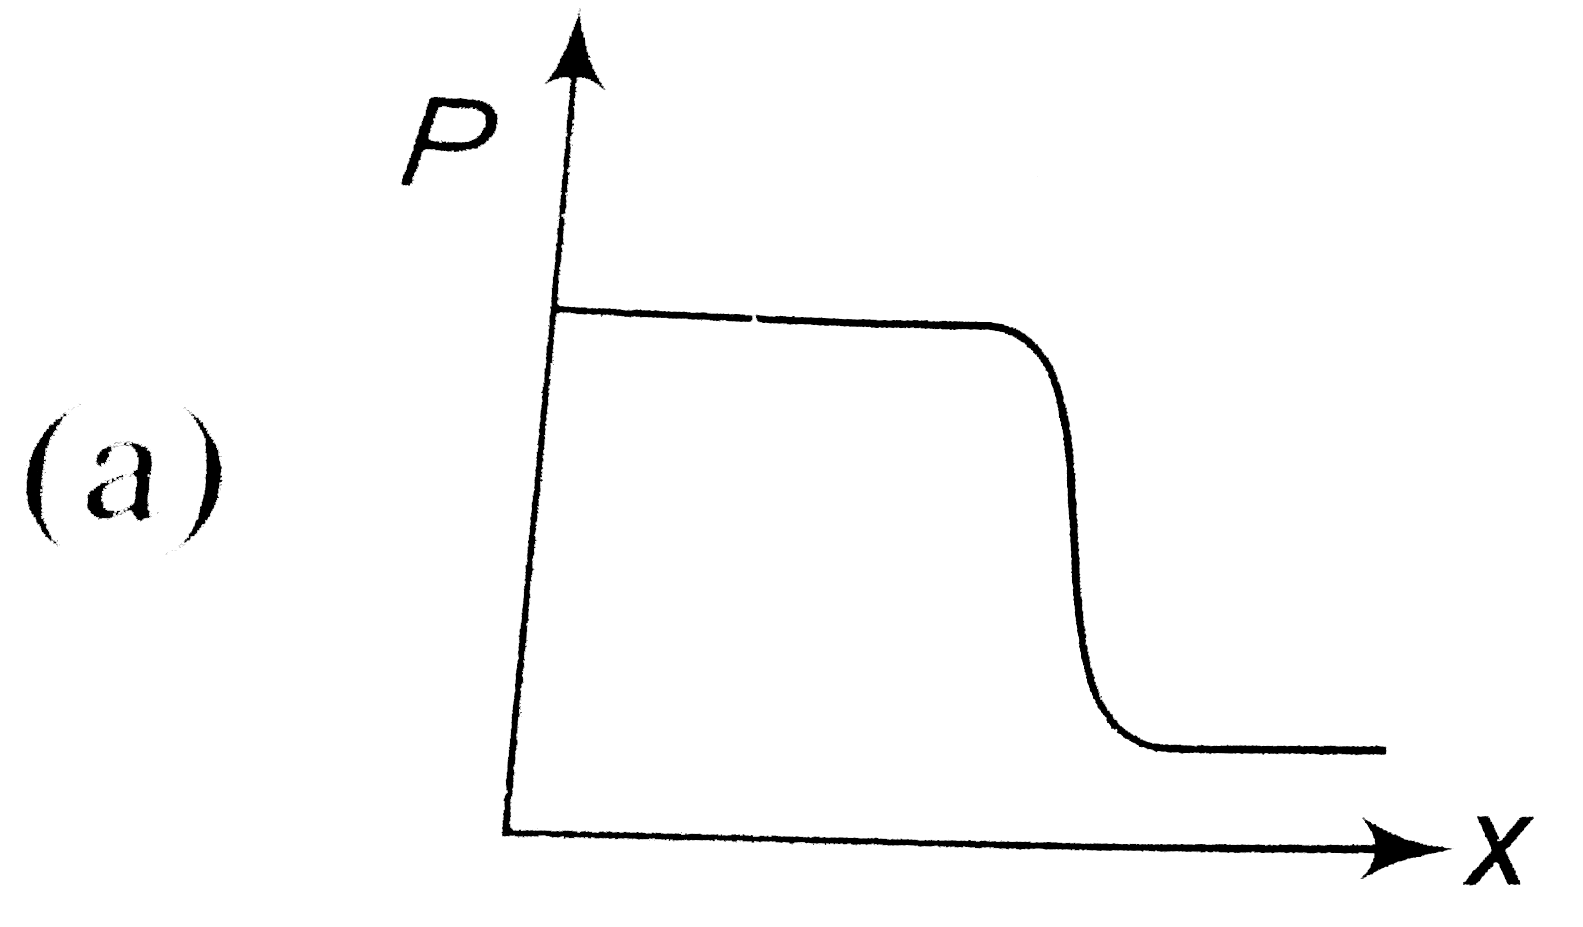 B
B C
C D
D
Graph between velocity and displacement is shown in the following figure:
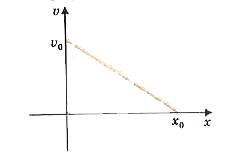
Which of the following graphes represents the correct variation of acceleration with displacementView SolutionThe potential energy U(x) of a particle moving along x−axis is shown in figure. Which one of the following graphs represents the variation of kinetic energy of this particel if its total mechanical enery is E0
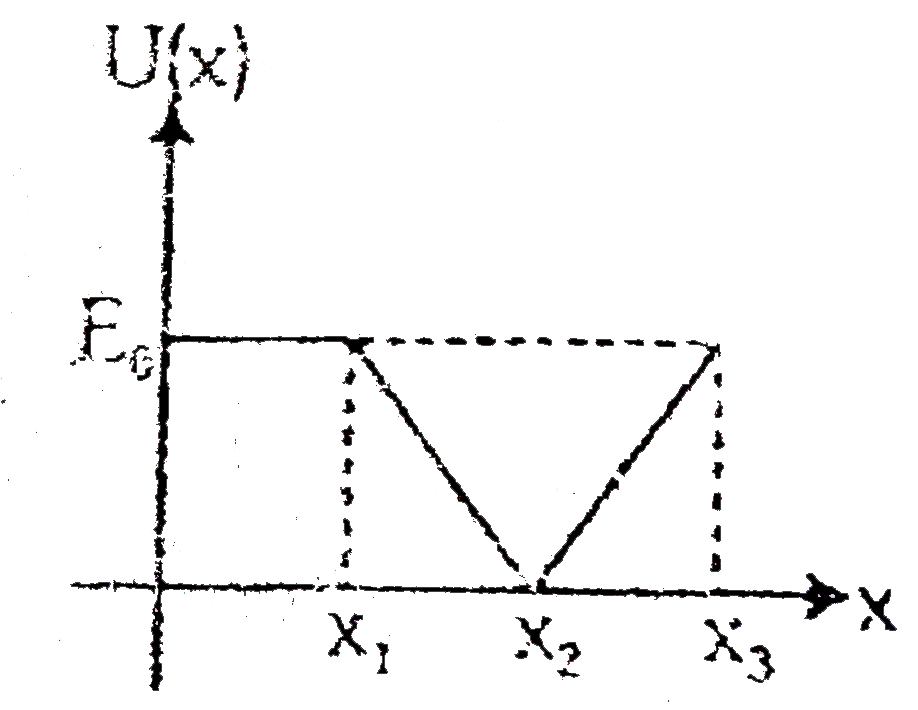 View Solution
A non-viscous liquid is flowing through a non-uniform pipe from section A to section B as shown in the figure. Cross sectional area of the pipe at A is less than that at B. Which of the following statements are correct?
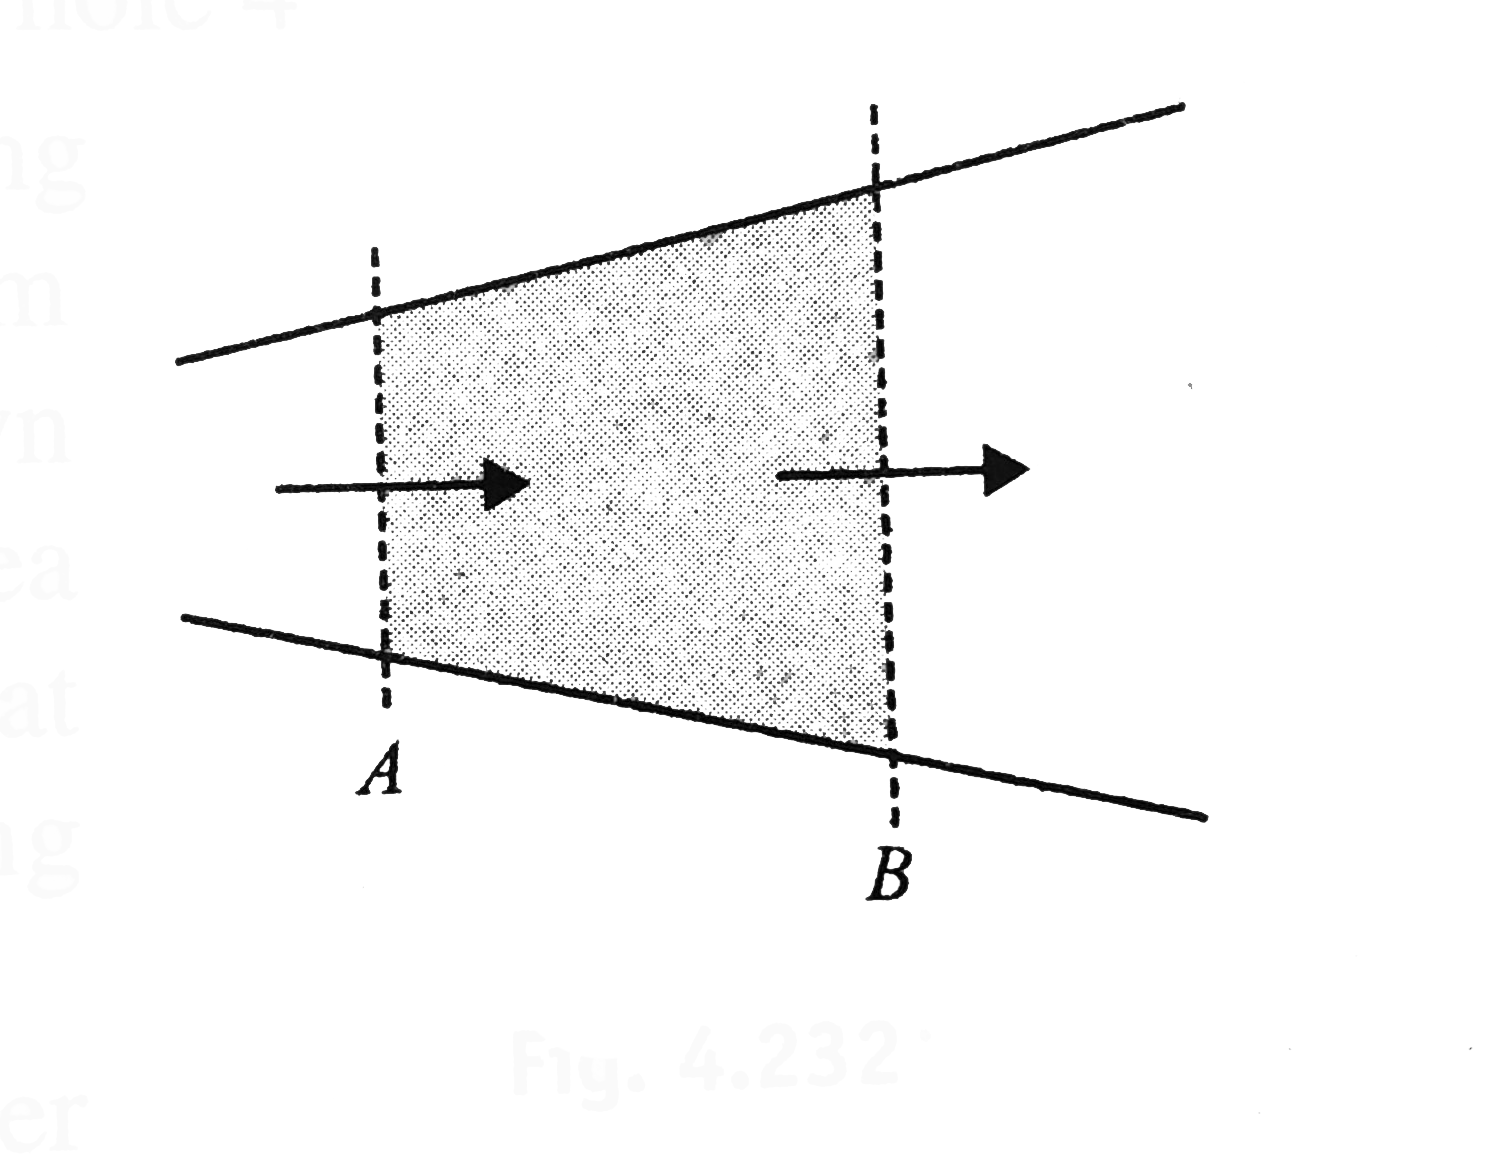 View Solution
An incompressible liquid flows through a horizontal tube as shown in the figure. Then the velocity 'v' of the fluid is:
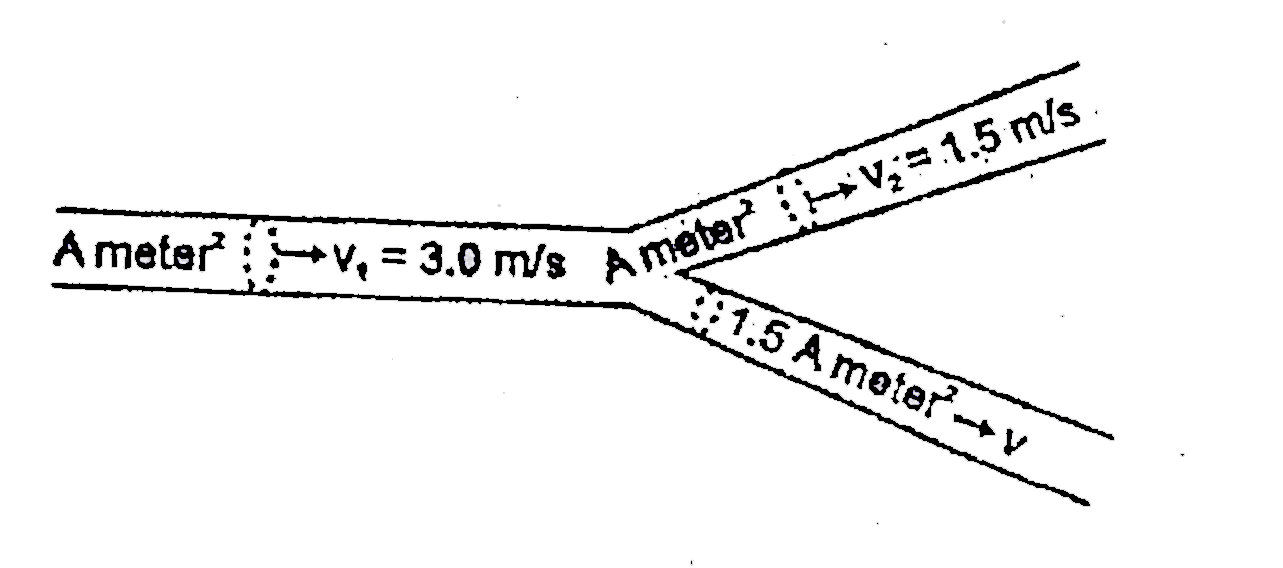 View Solution
A non viscous inconpressible liquid is flowing from a horizontal pipe of non-uniform cross section as shown, Choose the correct option
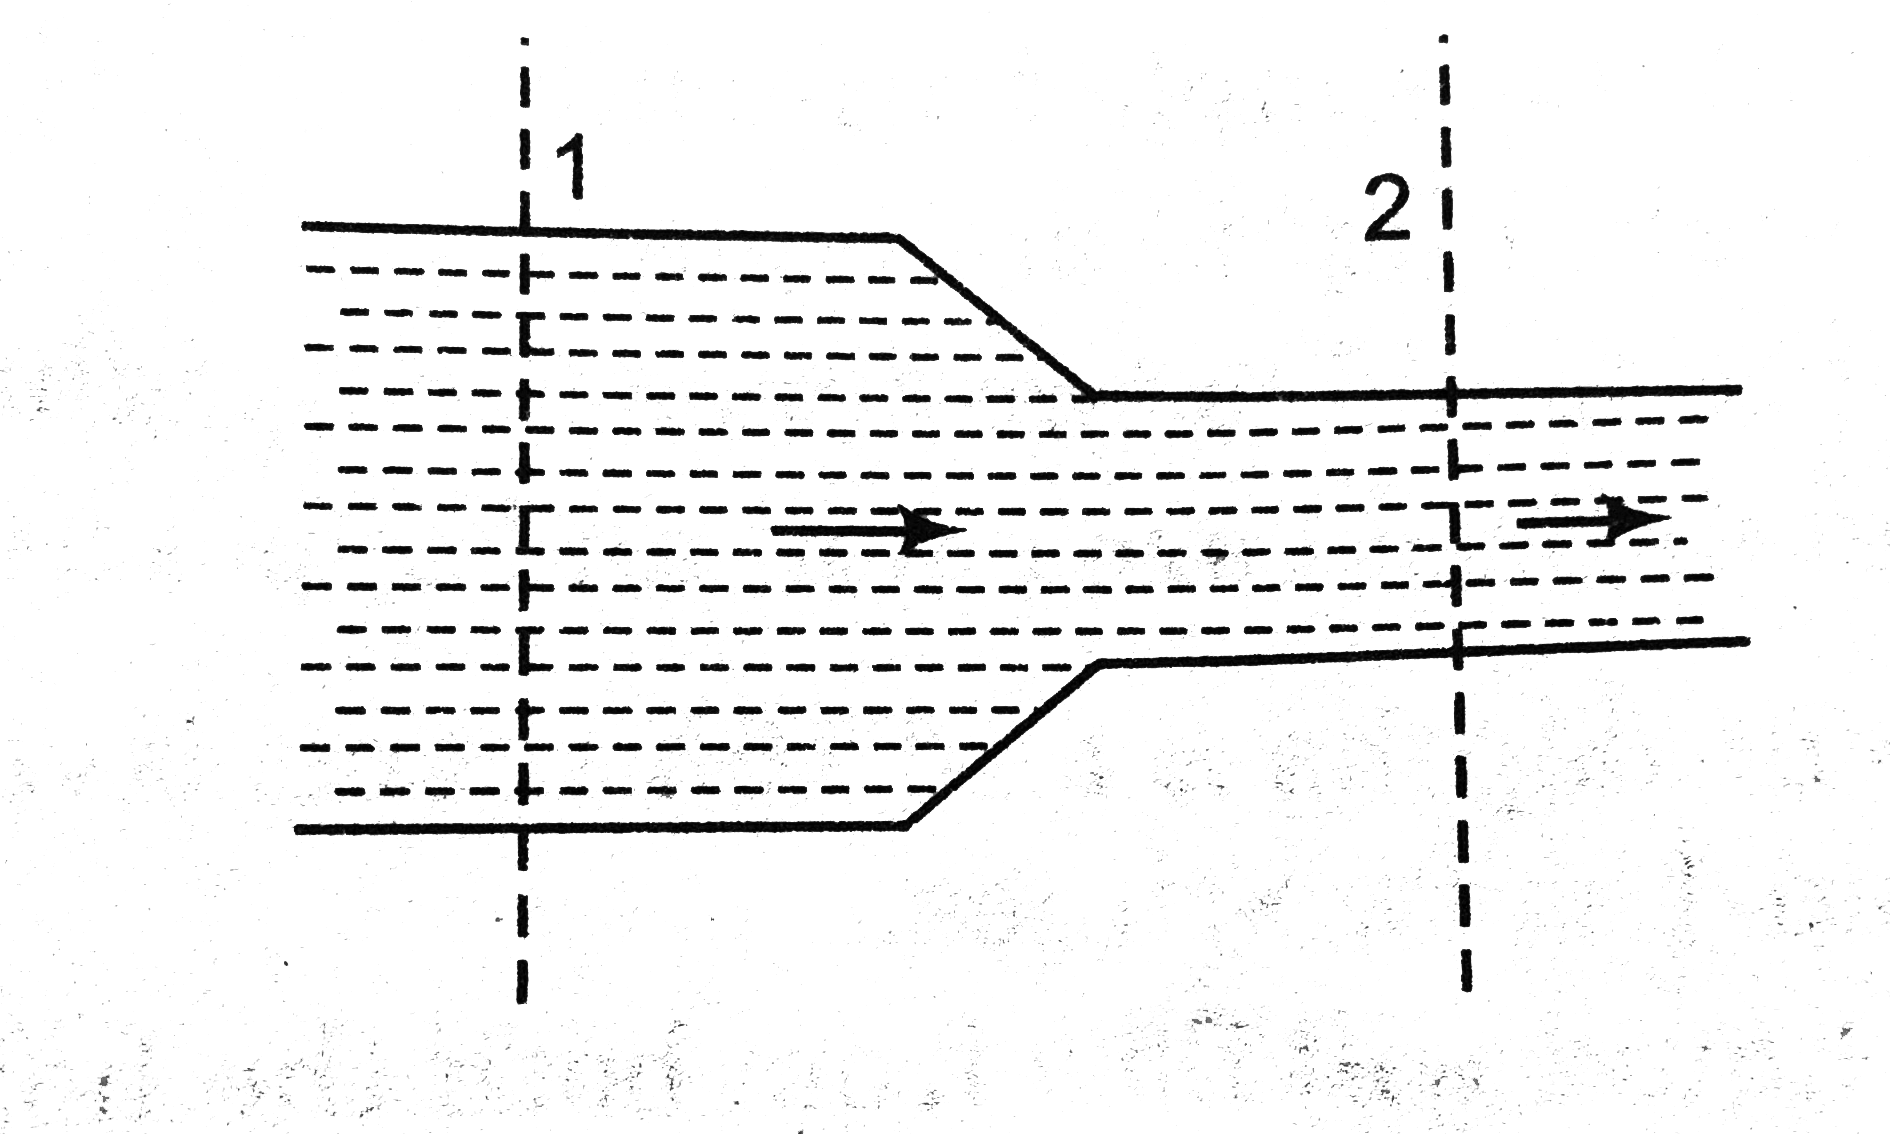 View Solution
