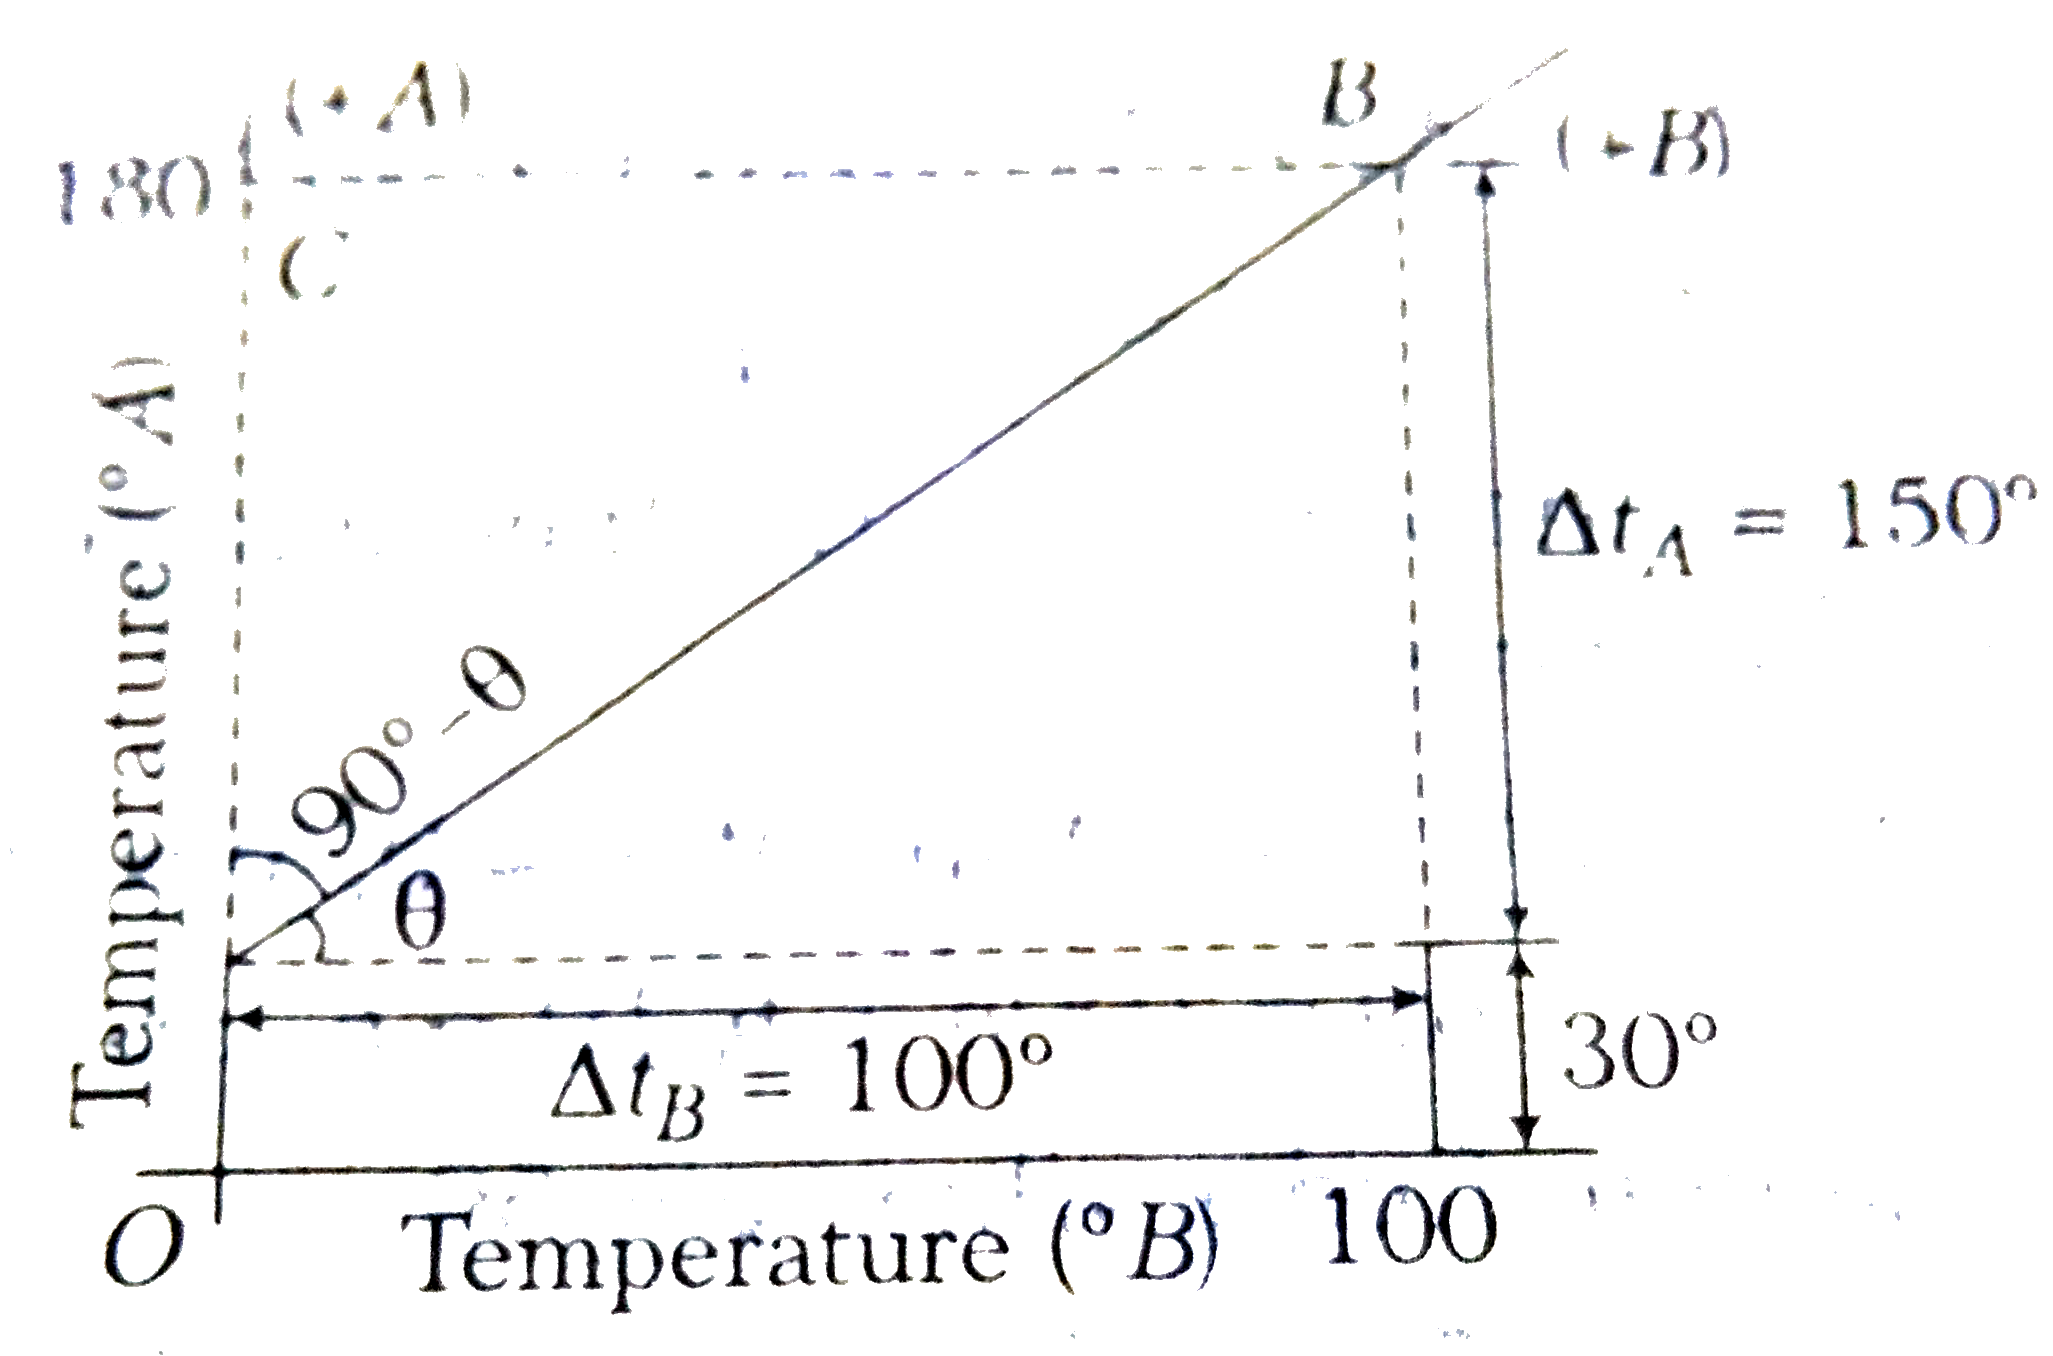
The graph between two temperature scales A and B is shown in Fig. Between upper fixed point and lower fixed point there are 150 equal divisions on scales A and 100 on scale B. The relation between the temperature in two scales is given by_
_S01_001_Q01.png)
tA−180100=tB150
tA−30150=tB100
tA−180150=tA100
tB−40100=tA180
The correct Answer is:C
It is clerar form the graph that lowest point for scale A is 30∘ and lowest point for scale B is 0∘. Highest point for the scale A is 180∘ and for scale B is 100∘. Hence, correct relation is
tA−(LFP)A(UFP)A−(LPF)A=tB−(LFP)B(UFP)B−(LFP)B

⇒ tA−30180−30=tB−O100−0⇒tA−30150=tB100
where, LFP → lower fixed poing
UFP → Upper fixed point
Topper's Solved these Questions
- BOOK - DC PANDEYCHAPTER - THERMOMETRY THERMAL EXPANSION AND KINETIC THEORY OF GASESEXERCISE - B medical entrance special format questions14videos
THERMOMETRY THERMAL EXPANSION AND KINETIC THEORY OF GASES
- BOOK - DC PANDEYCHAPTER - THERMOMETRY THERMAL EXPANSION AND KINETIC THEORY OF GASESEXERCISE - Match the columns5videos
THERMOMETRY THERMAL EXPANSION AND KINETIC THEORY OF GASES
- BOOK - DC PANDEYCHAPTER - THERMOMETRY THERMAL EXPANSION AND KINETIC THEORY OF GASESEXERCISE - Check point 14.425videos
THERMOMETRY THERMAL EXPANSION AND KINETIC THEORY OF GASES
- BOOK - DC PANDEYCHAPTER - SUPERPOSITION OF WAVESEXERCISE - Level 2 Subjective8videos
SUPERPOSITION OF WAVES
- BOOK - DC PANDEYCHAPTER - THERMOMETRY,THERMAL EXPANSION & KINETIC THEORY OF GASESEXERCISE - Level 2 Subjective9videos
THERMOMETRY,THERMAL EXPANSION & KINETIC THEORY OF GASES
Similar Questions
Knowledge Check
- Question 1 - Select One
The lower fixed point on the Celsius scale is
Amelting point of iceBboiling point of waterCmelting point of mercuryDmean of melting point and boiling point of water. - Question 2 - Select One
The difference between lower fixed point and upper fixed point is divided into_______parts on a Celsius scale
A100B273C180D50 - Question 3 - Select One
Ice point and steam point on a particular scale reads 10∘and80∘ respectively . The temperature on .∘F Scale when temperature on new scale is 45∘ is
A50∘FB112∘FC122∘FD138∘F
What are two fixed points on a temperature scale?
View SolutionFind the temperature equivalent to 20∘C in kelvin scale, if the relation between kelvin and celsius scale is given by K = C + 273.
View SolutionFind the temperature equivalent to 20∘C in kelvin scale, if the relation between kelvin and celsius scale is given by K = C + 273.
View SolutionWrite the relation between Kelvin scale and Celsius scale of temperature.
View SolutionDirections: In the following questions, a statement of assertion is followed by a statement of reason.
Assertion : The most common scales used to measure the temperature are celsius scale and fahrenheit scale.
Reason : The interval between upper fixed point and lower fixed point of these scales is divided into 100 equal parts.
Mark the correct choice as:View Solution

