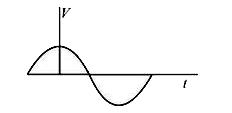
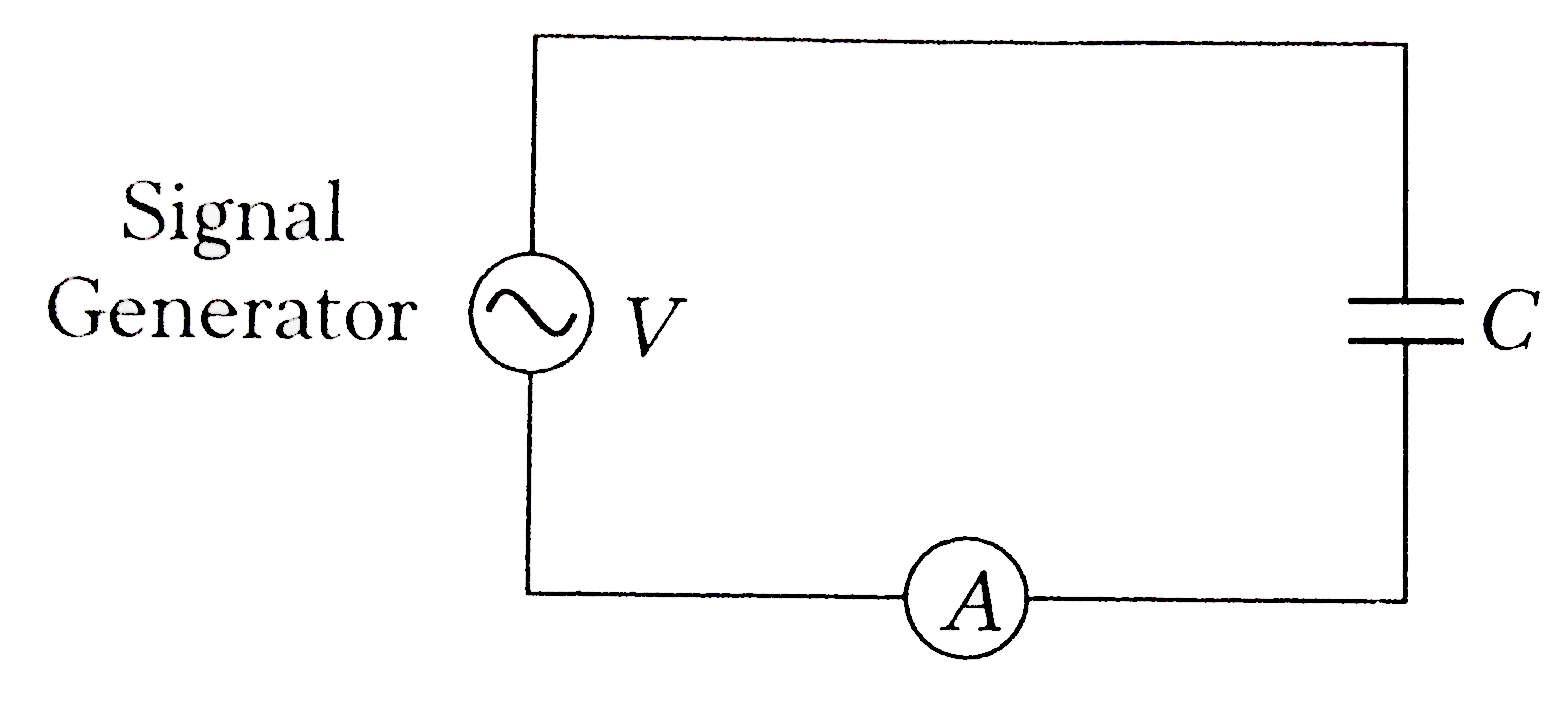
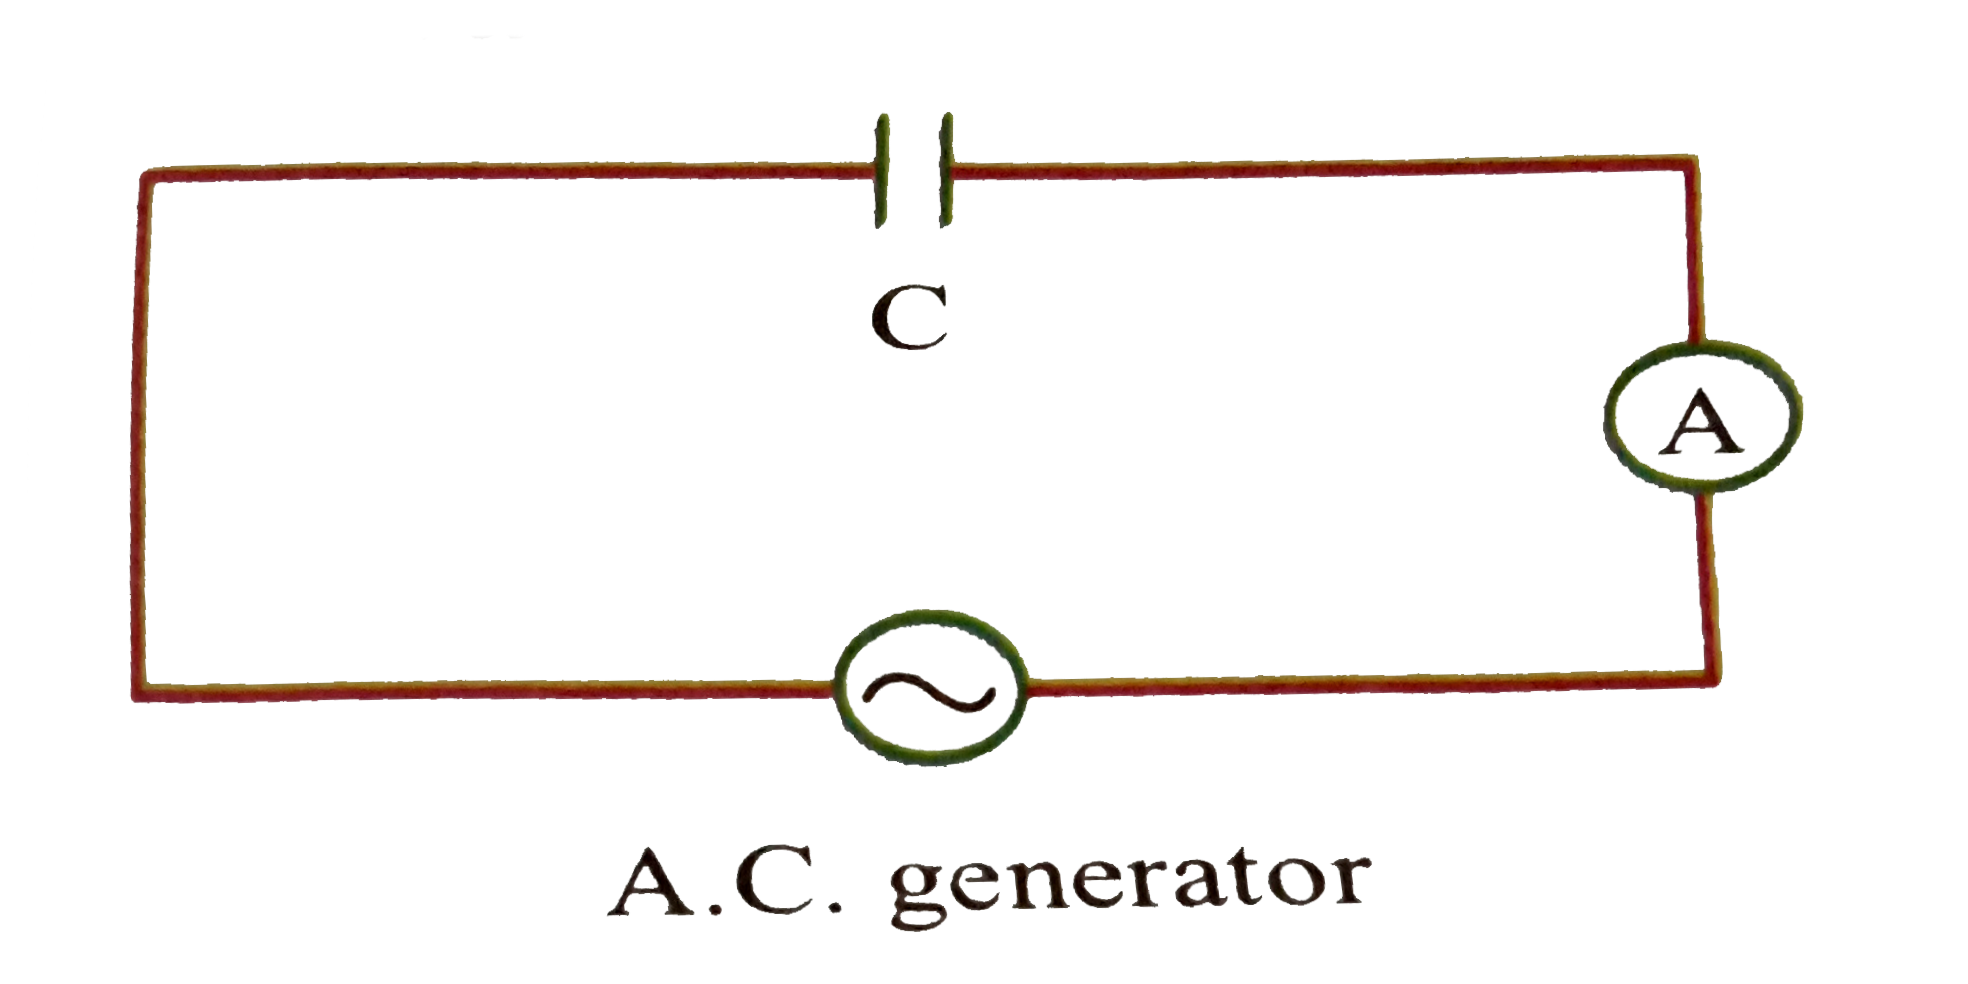
A constant voltage at different frequencies is applied across a capacitance. C as shown in the figure. Which of the following graphs correctly depicts the varitaion of current with frequency?
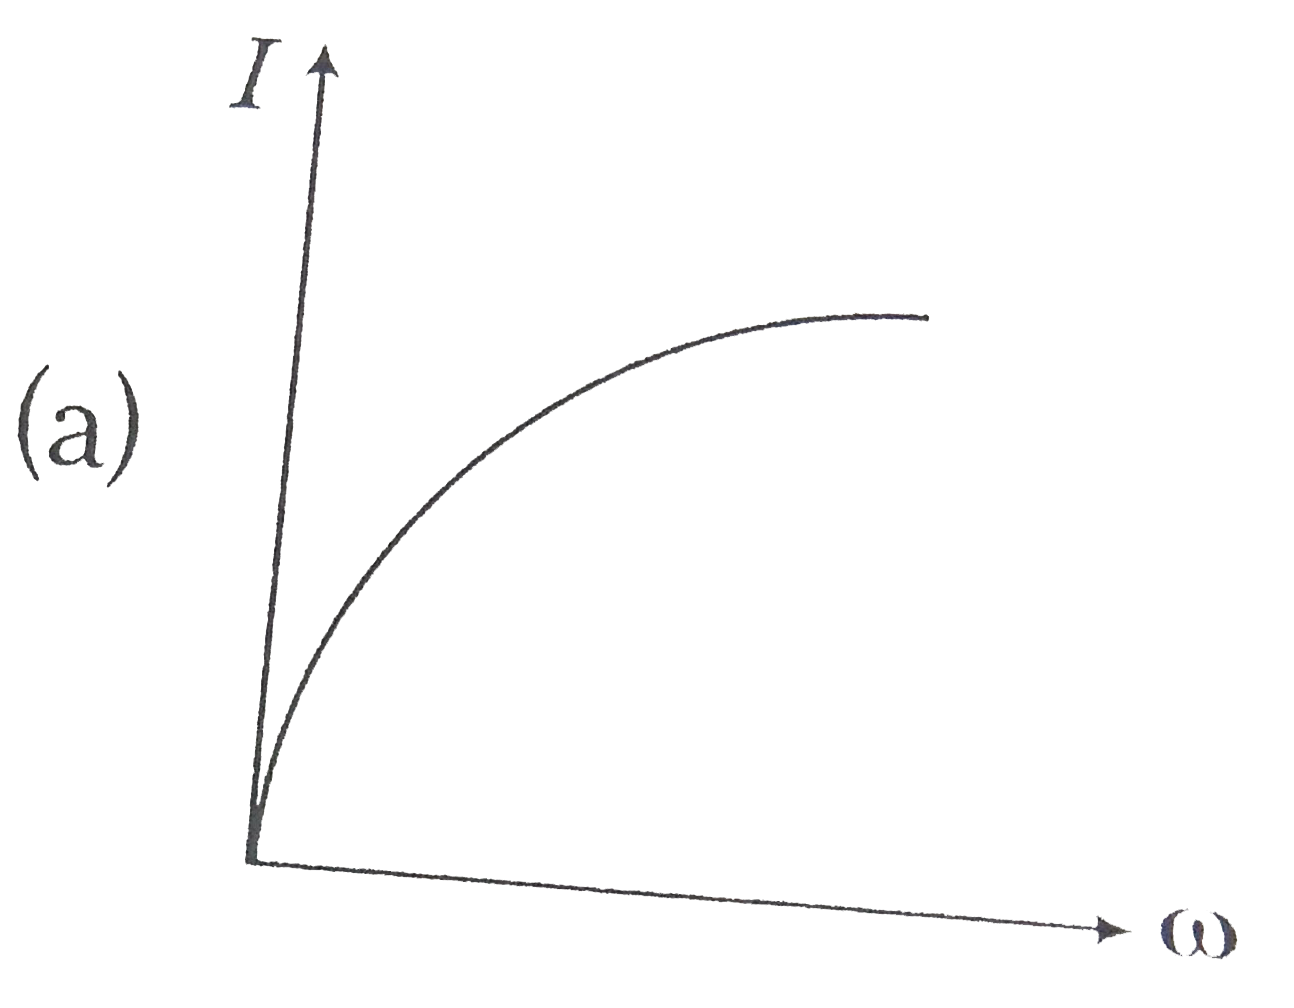
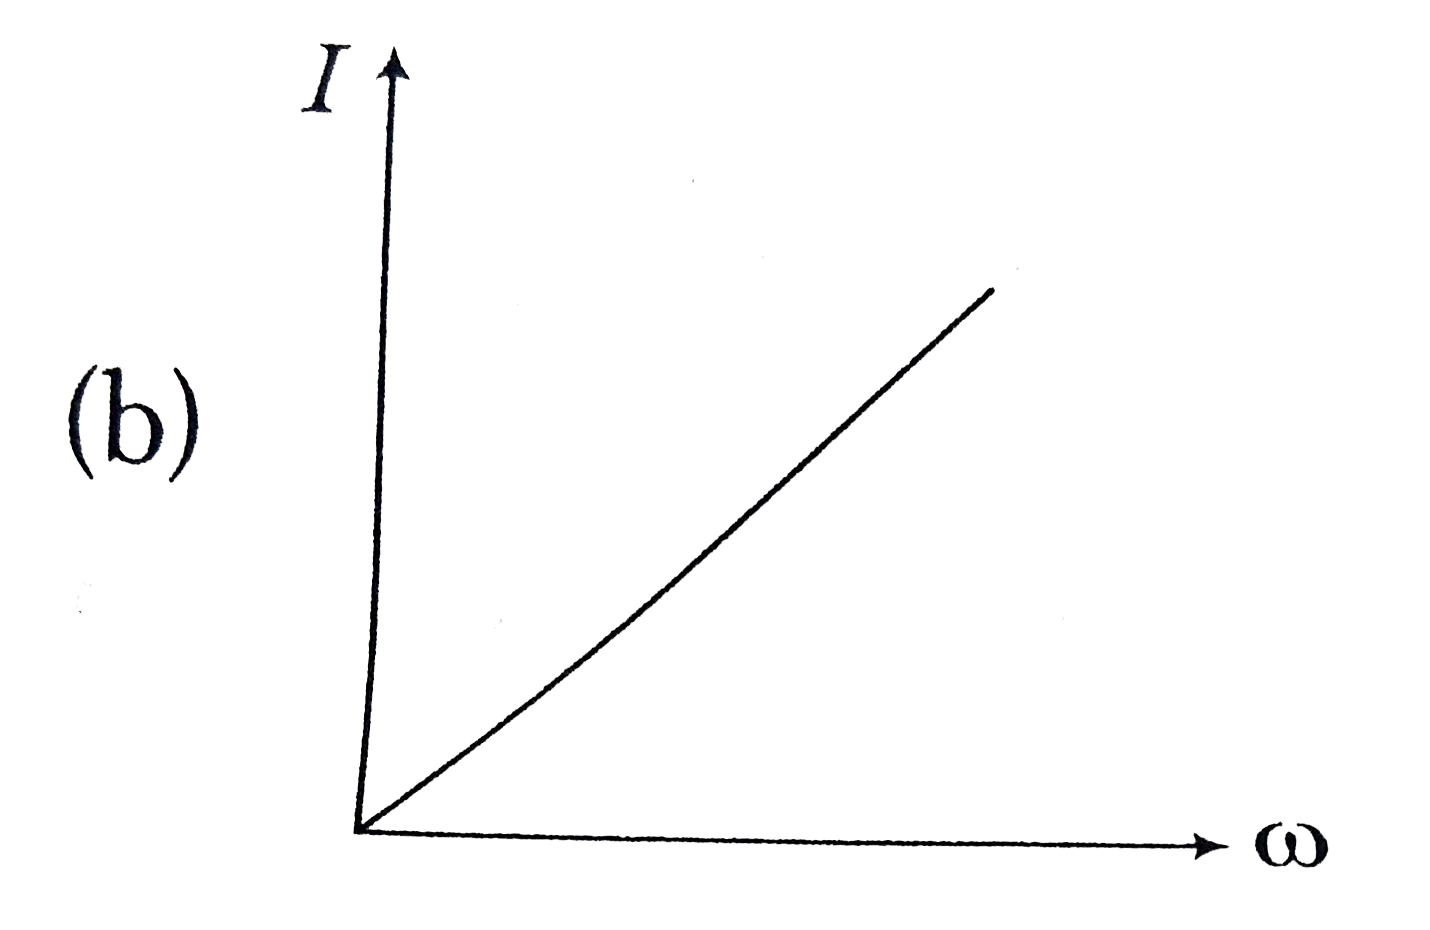
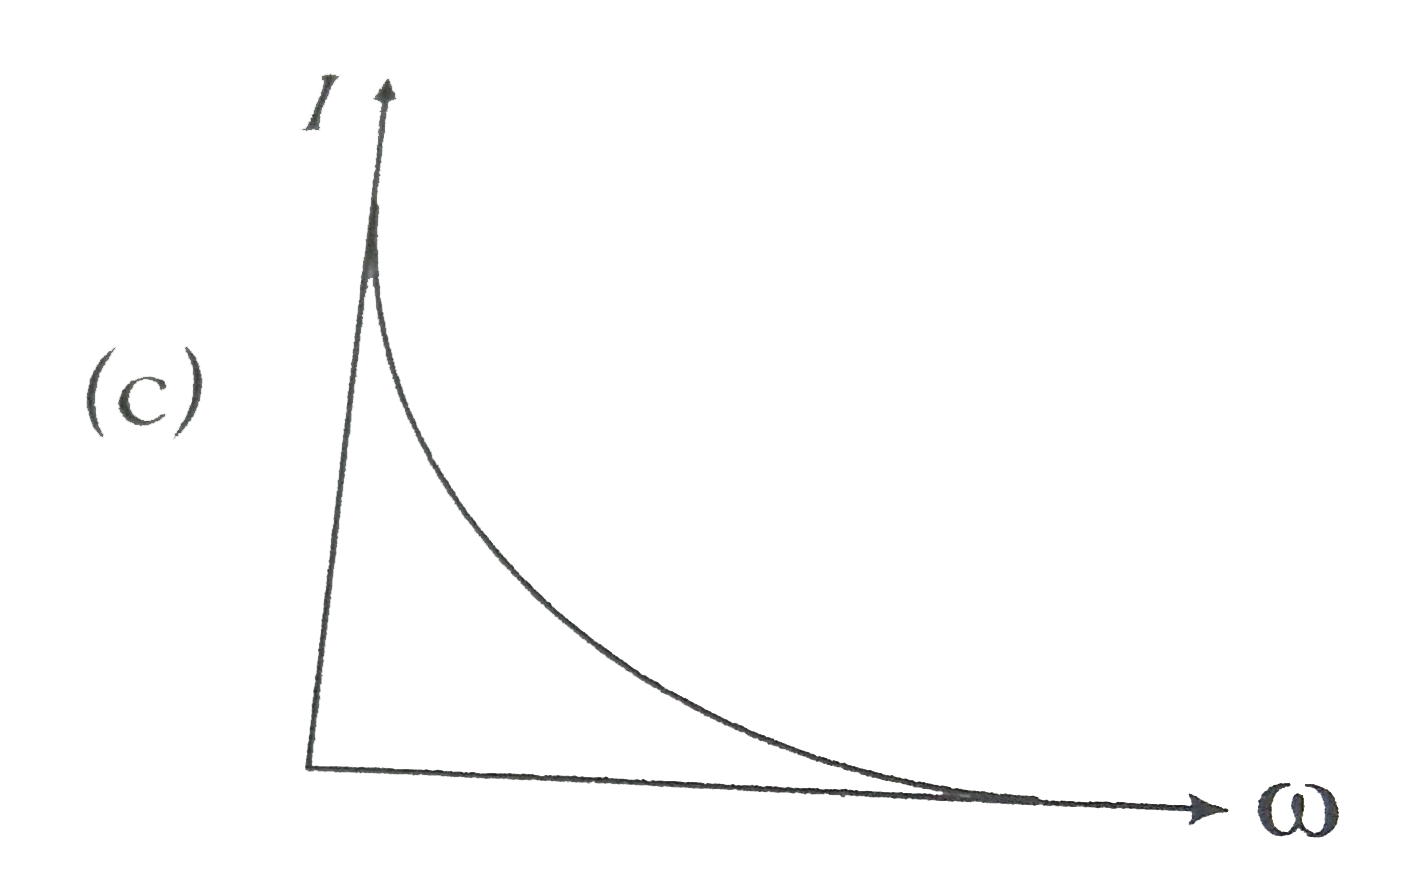
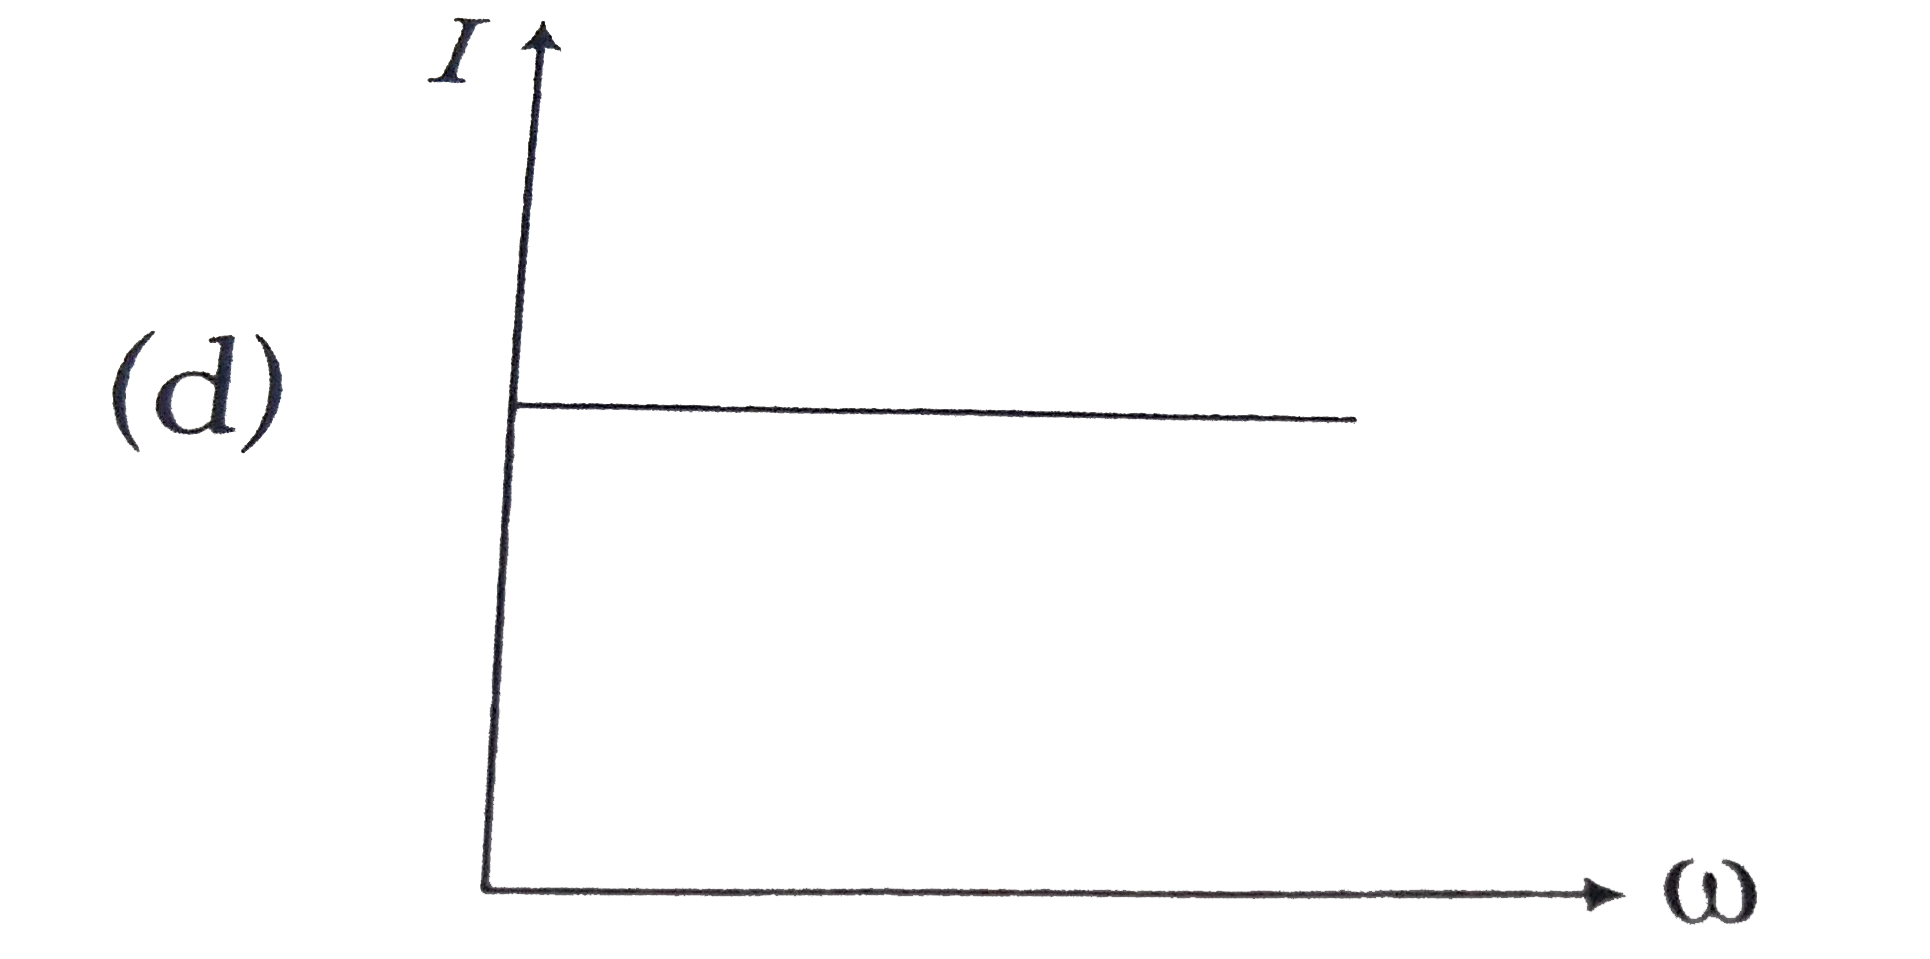
The correct Answer is:B
For capacitivie circuits, XC=1ωC
I=1LC=1√10−3×10×10−6
ω=1√10−8=104
∴XL=ωL=104×10−3=10Ω
Similar Questions
Knowledge Check
A constant voltage at different frequencies is applied across a capacitance C as shown in the figure.
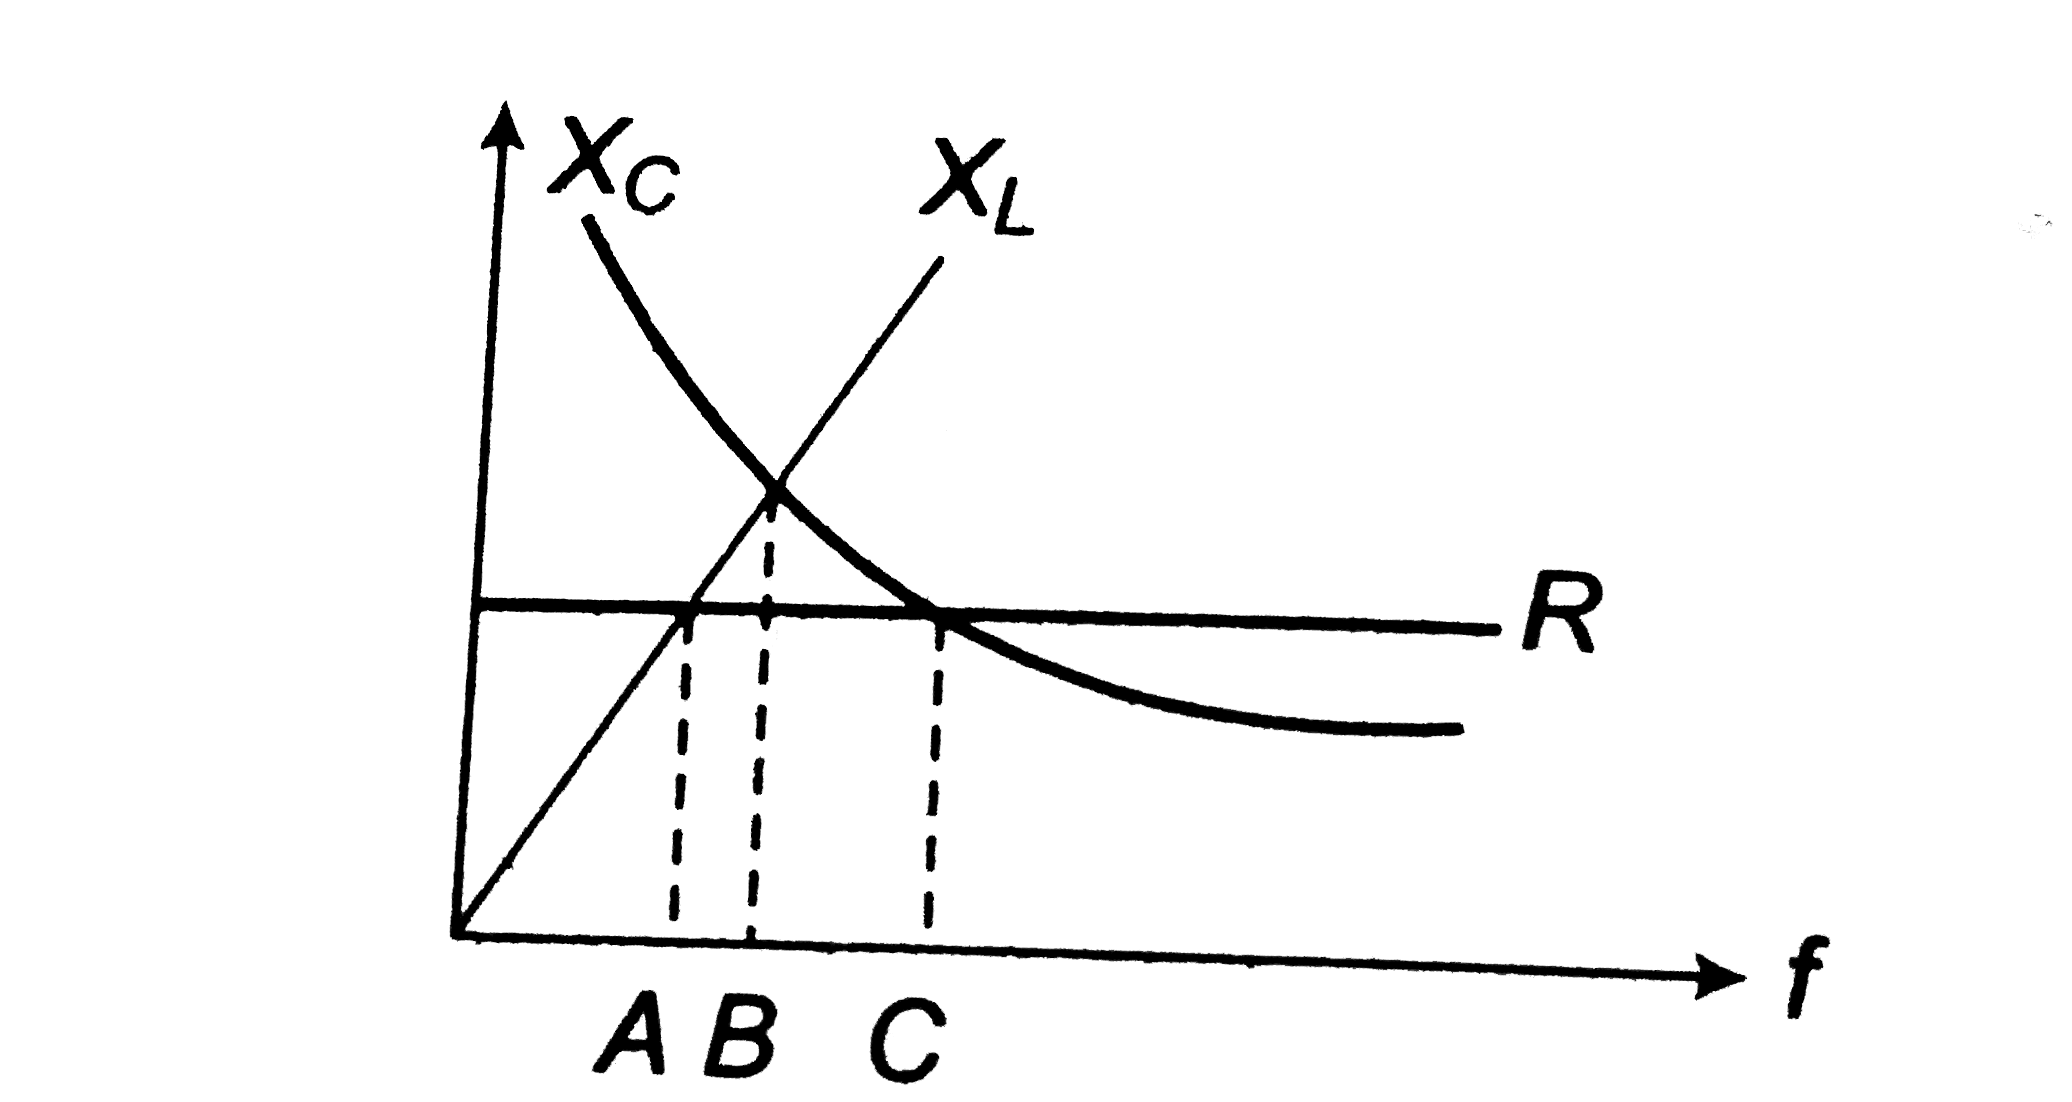
Which of the following graphs correctly depicts the variation of current with frequency?A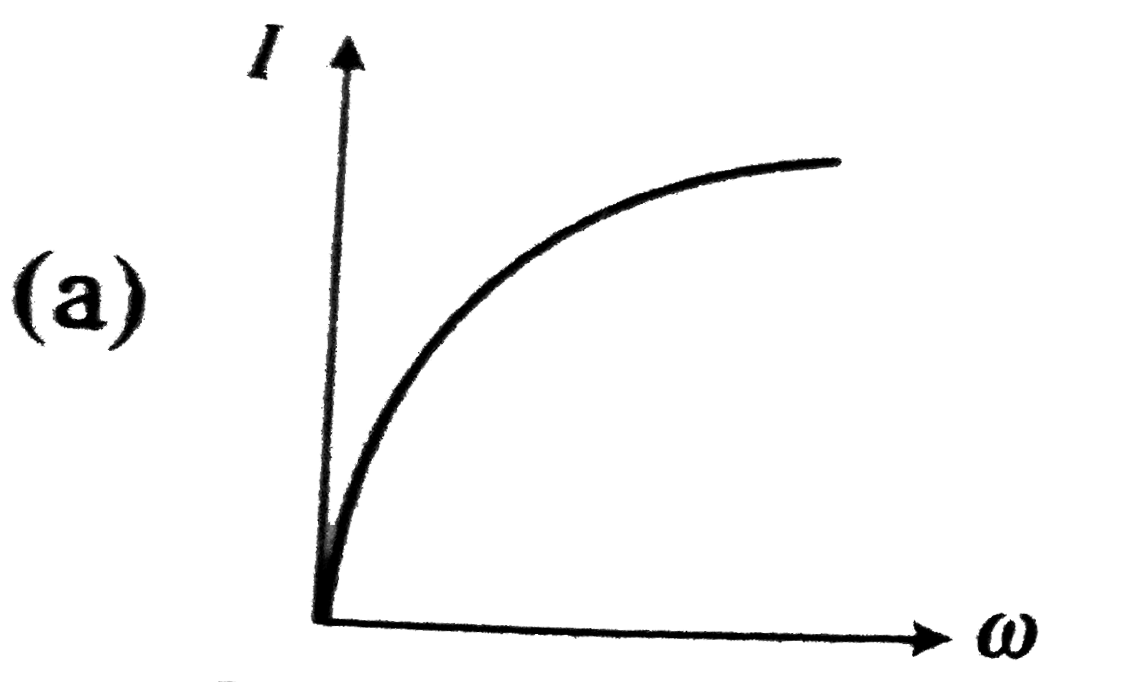 B
B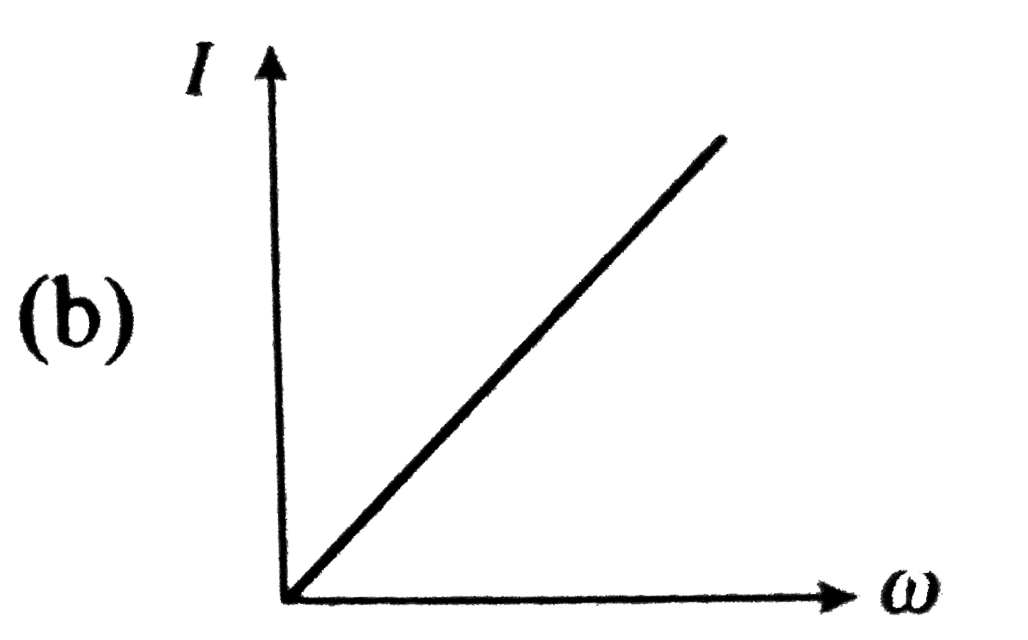 C
C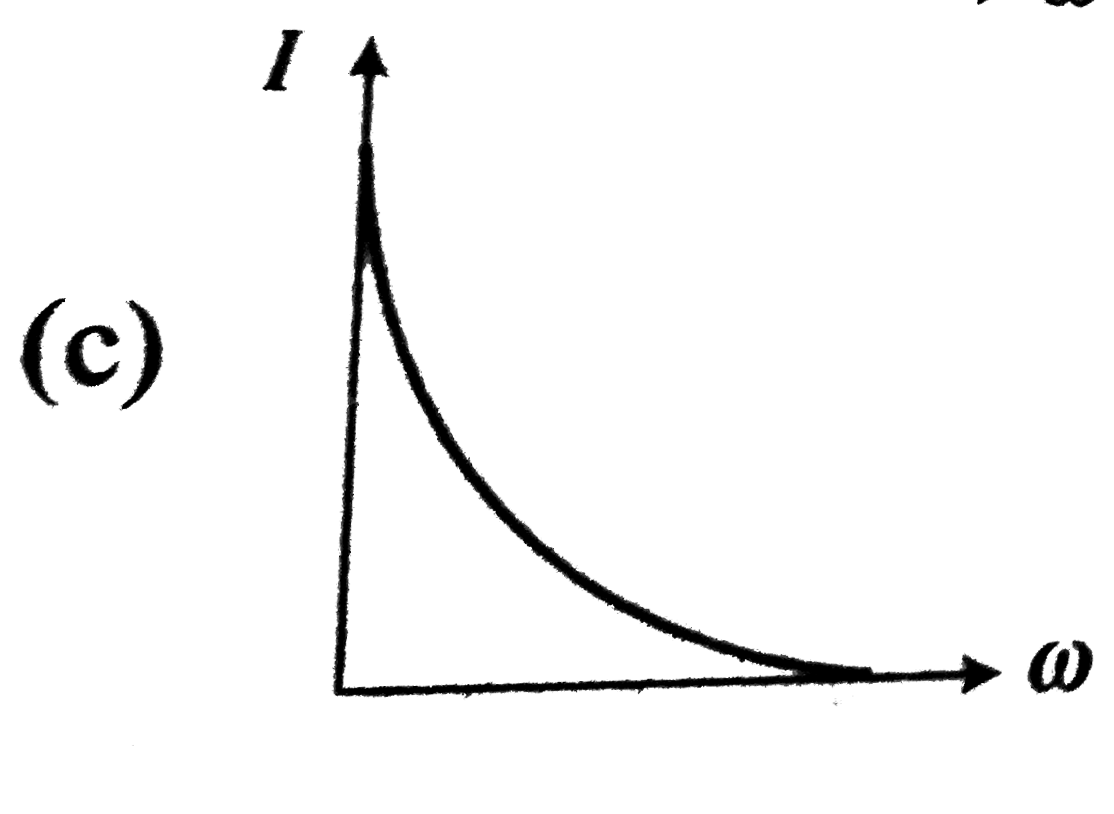 D
D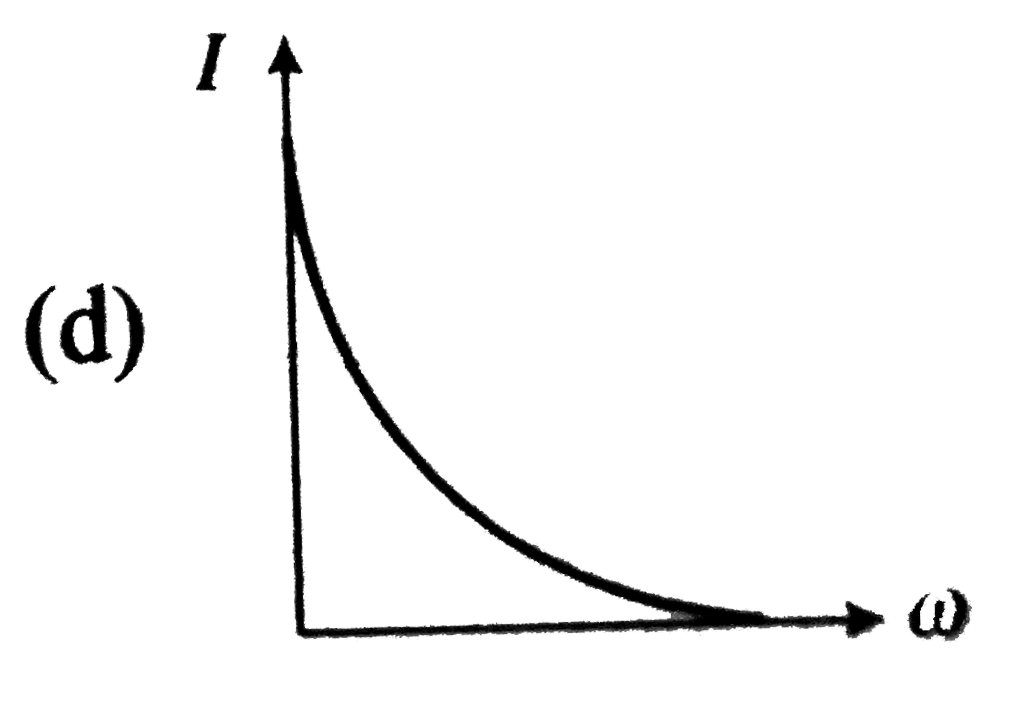
A constant voltage at different frequencies is applied across a capacitance C as shown in the figure. Which of the following graphs correctly depicts the variation of current with frequency
 A
A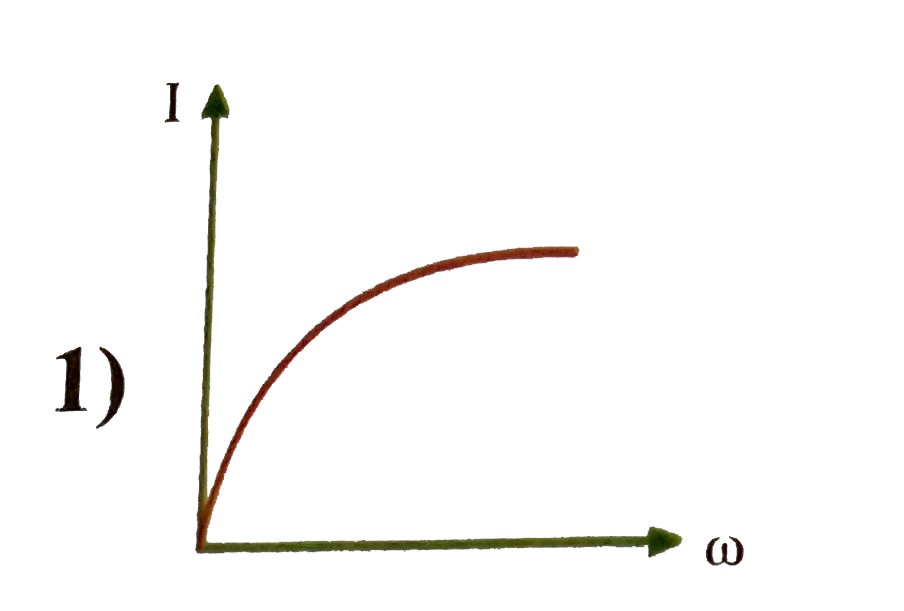 B
B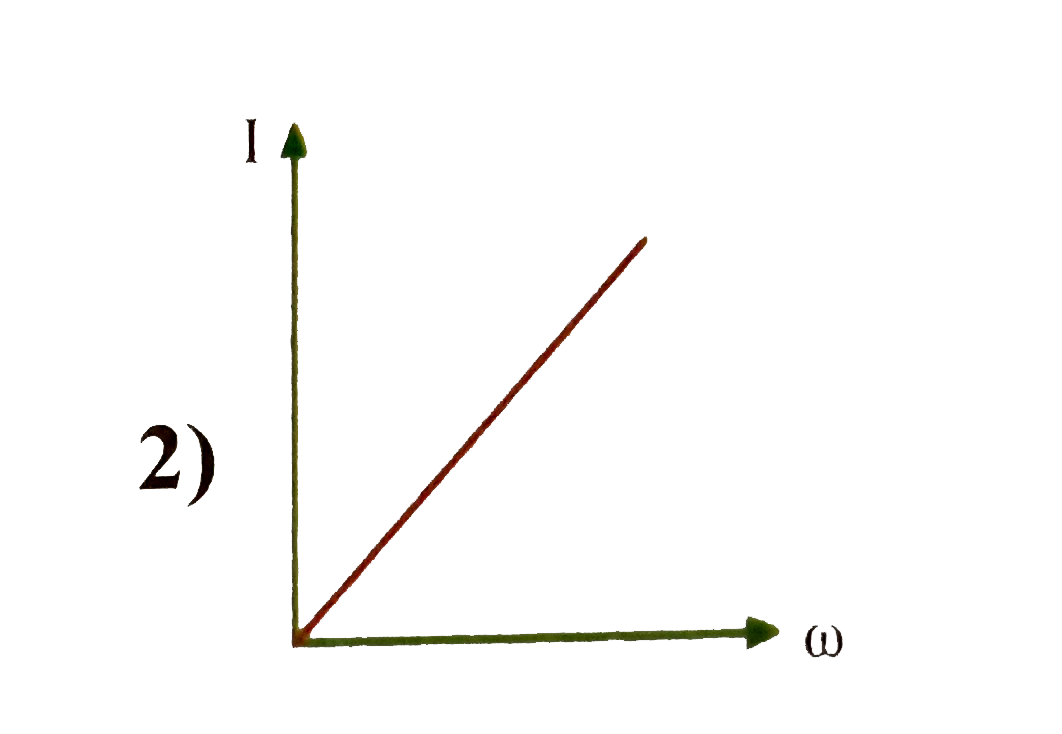 C
C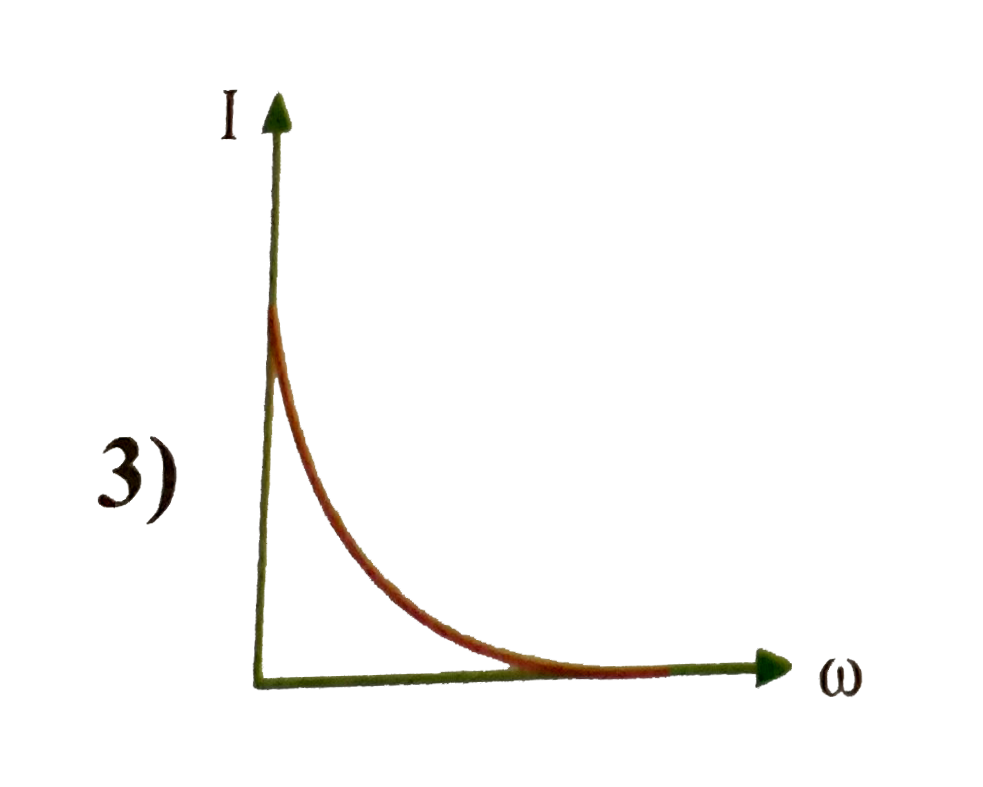 D
D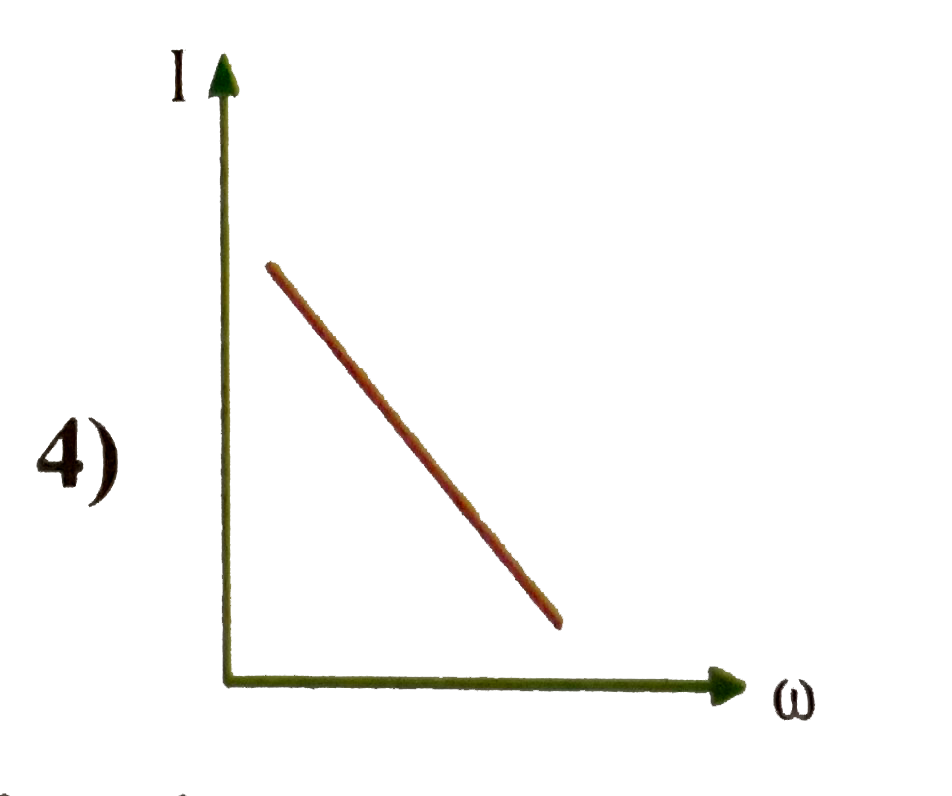
A variable frequency alternating voltage of constant magnitude is applied across a capacitor. Which of the following graph shows the variation of current set up in the circuit with frequency v?
A B
B C
C D
D
The current I in an inductance coil varies with time according to the graph given in the figure.
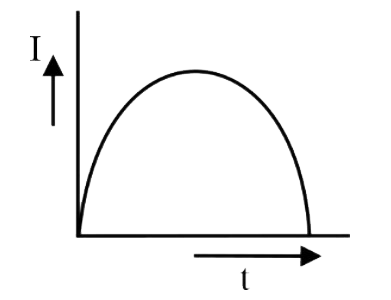
Which one of the following graphs gives the variation of voltage with time across the inductor?
View SolutionIdentify the graph which correctly reperesents the variation of capacitive reactance XC with frequency
View SolutionIdentify the graph which correctly reperesents the variation of capacitive reactance XC with frequency
View SolutionDifferent voltages are applied across a P−N junction and the currents are measured for each value. Which of the following graphs is obtained between voltage and current?
View SolutionThe current I in an inductance coil varies with time according to the graph given in the figure.

Which one of the following graphs gives the variation of voltage with time across the inductor?
View Solution

