Determine median value of the following series using graphic method :
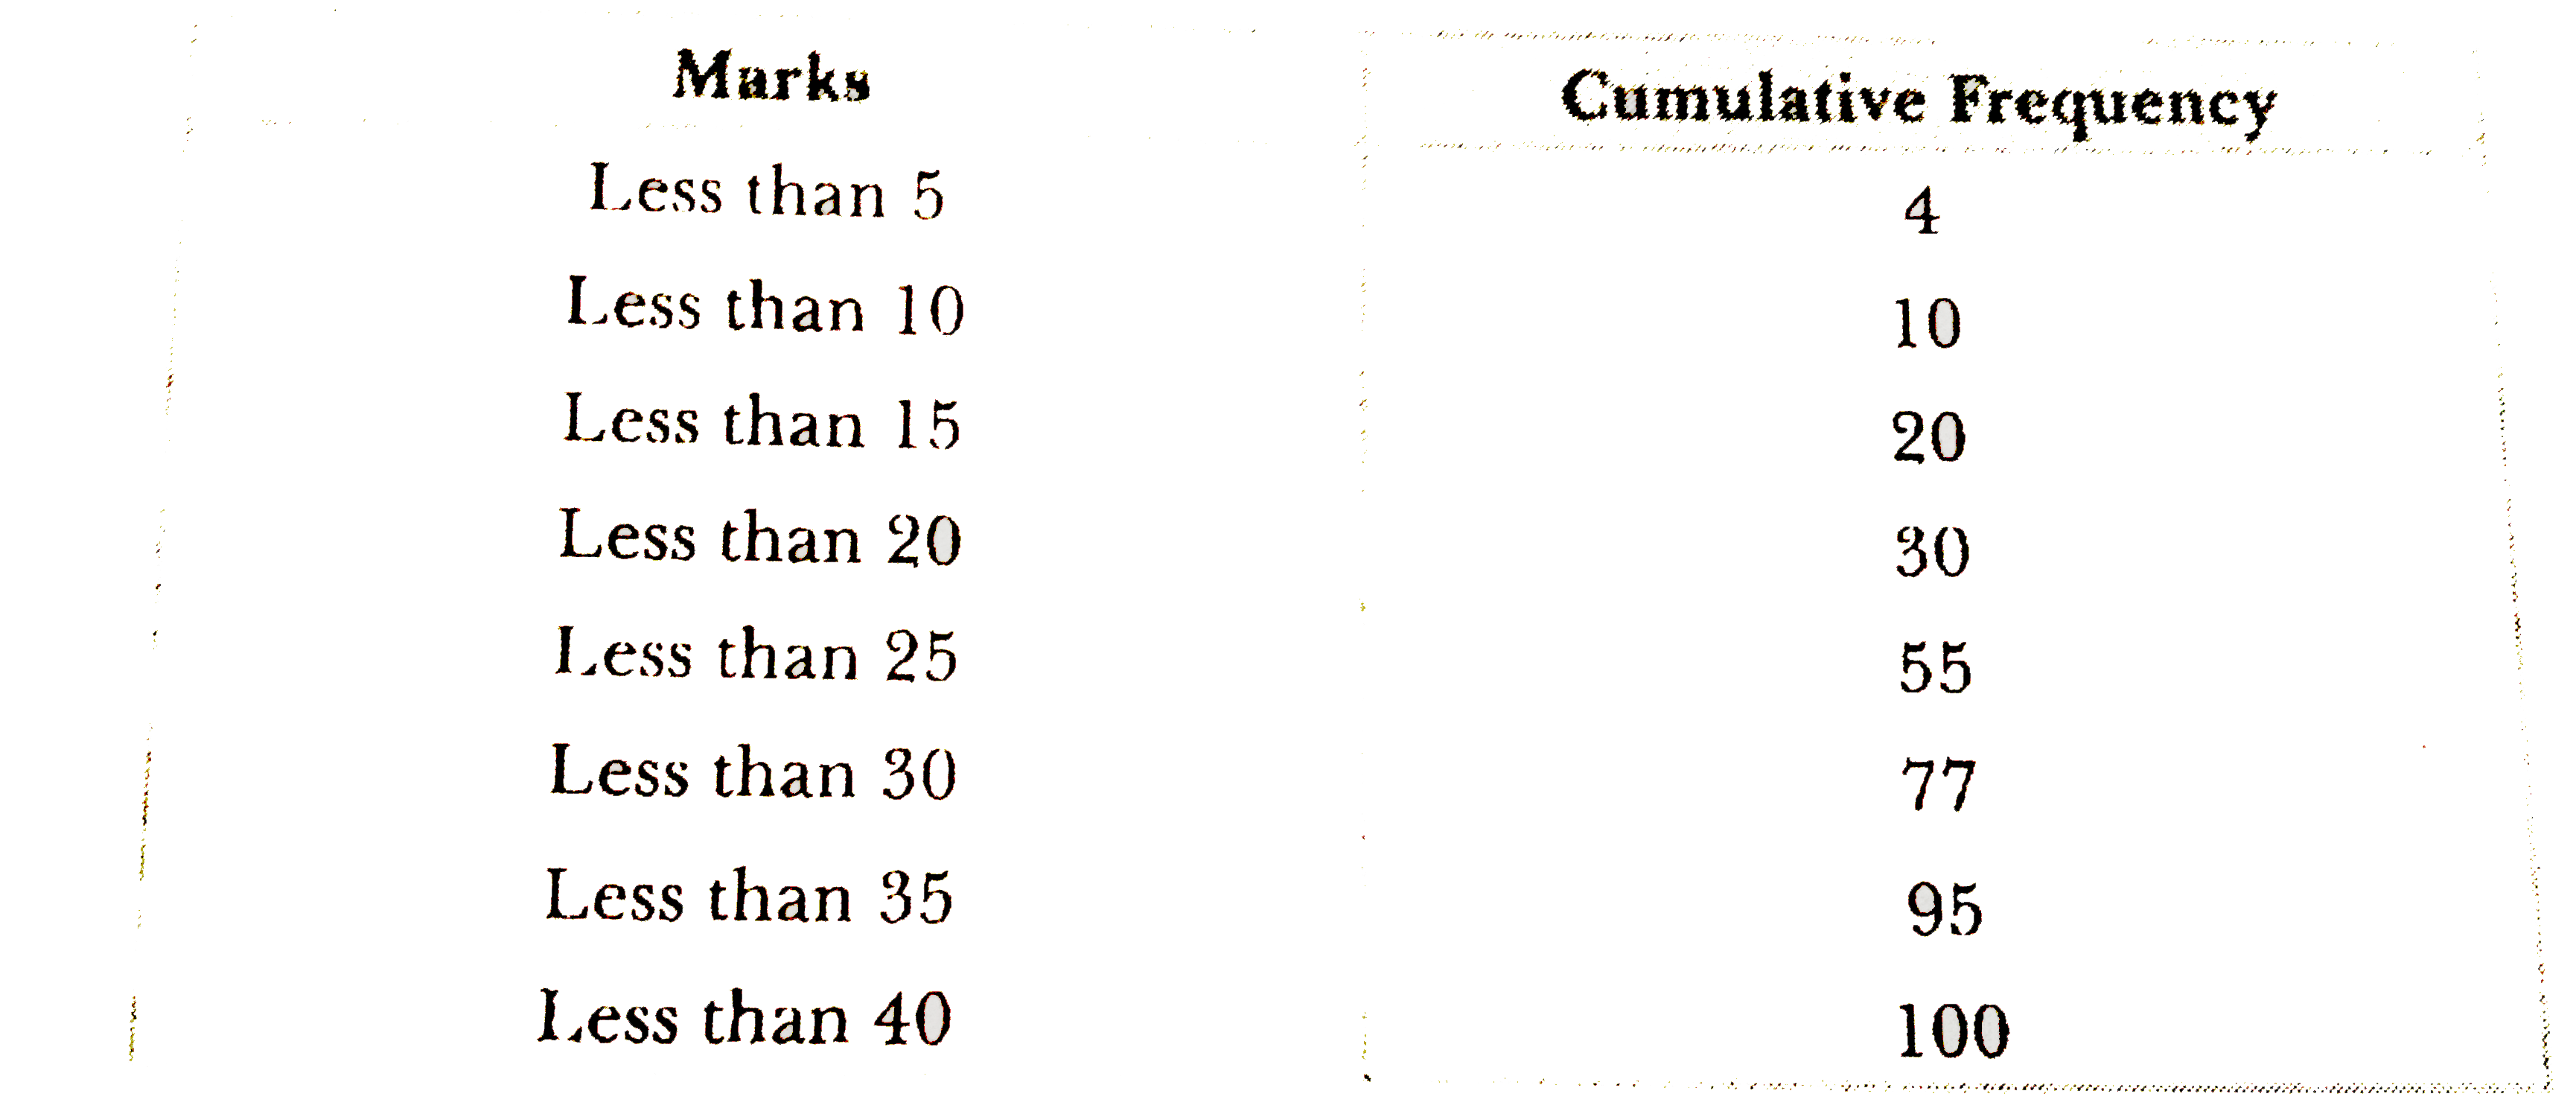
Marks0−55−1010−1515−2020−2525−3030−3535−40Number of students 4 6 10 10 22 25 18 5
Using 'Less then ogive approach , the calculation of the median value involves the following steps :
(i) concert the series into a less than cumulative frequency distribution and graph the data as under :

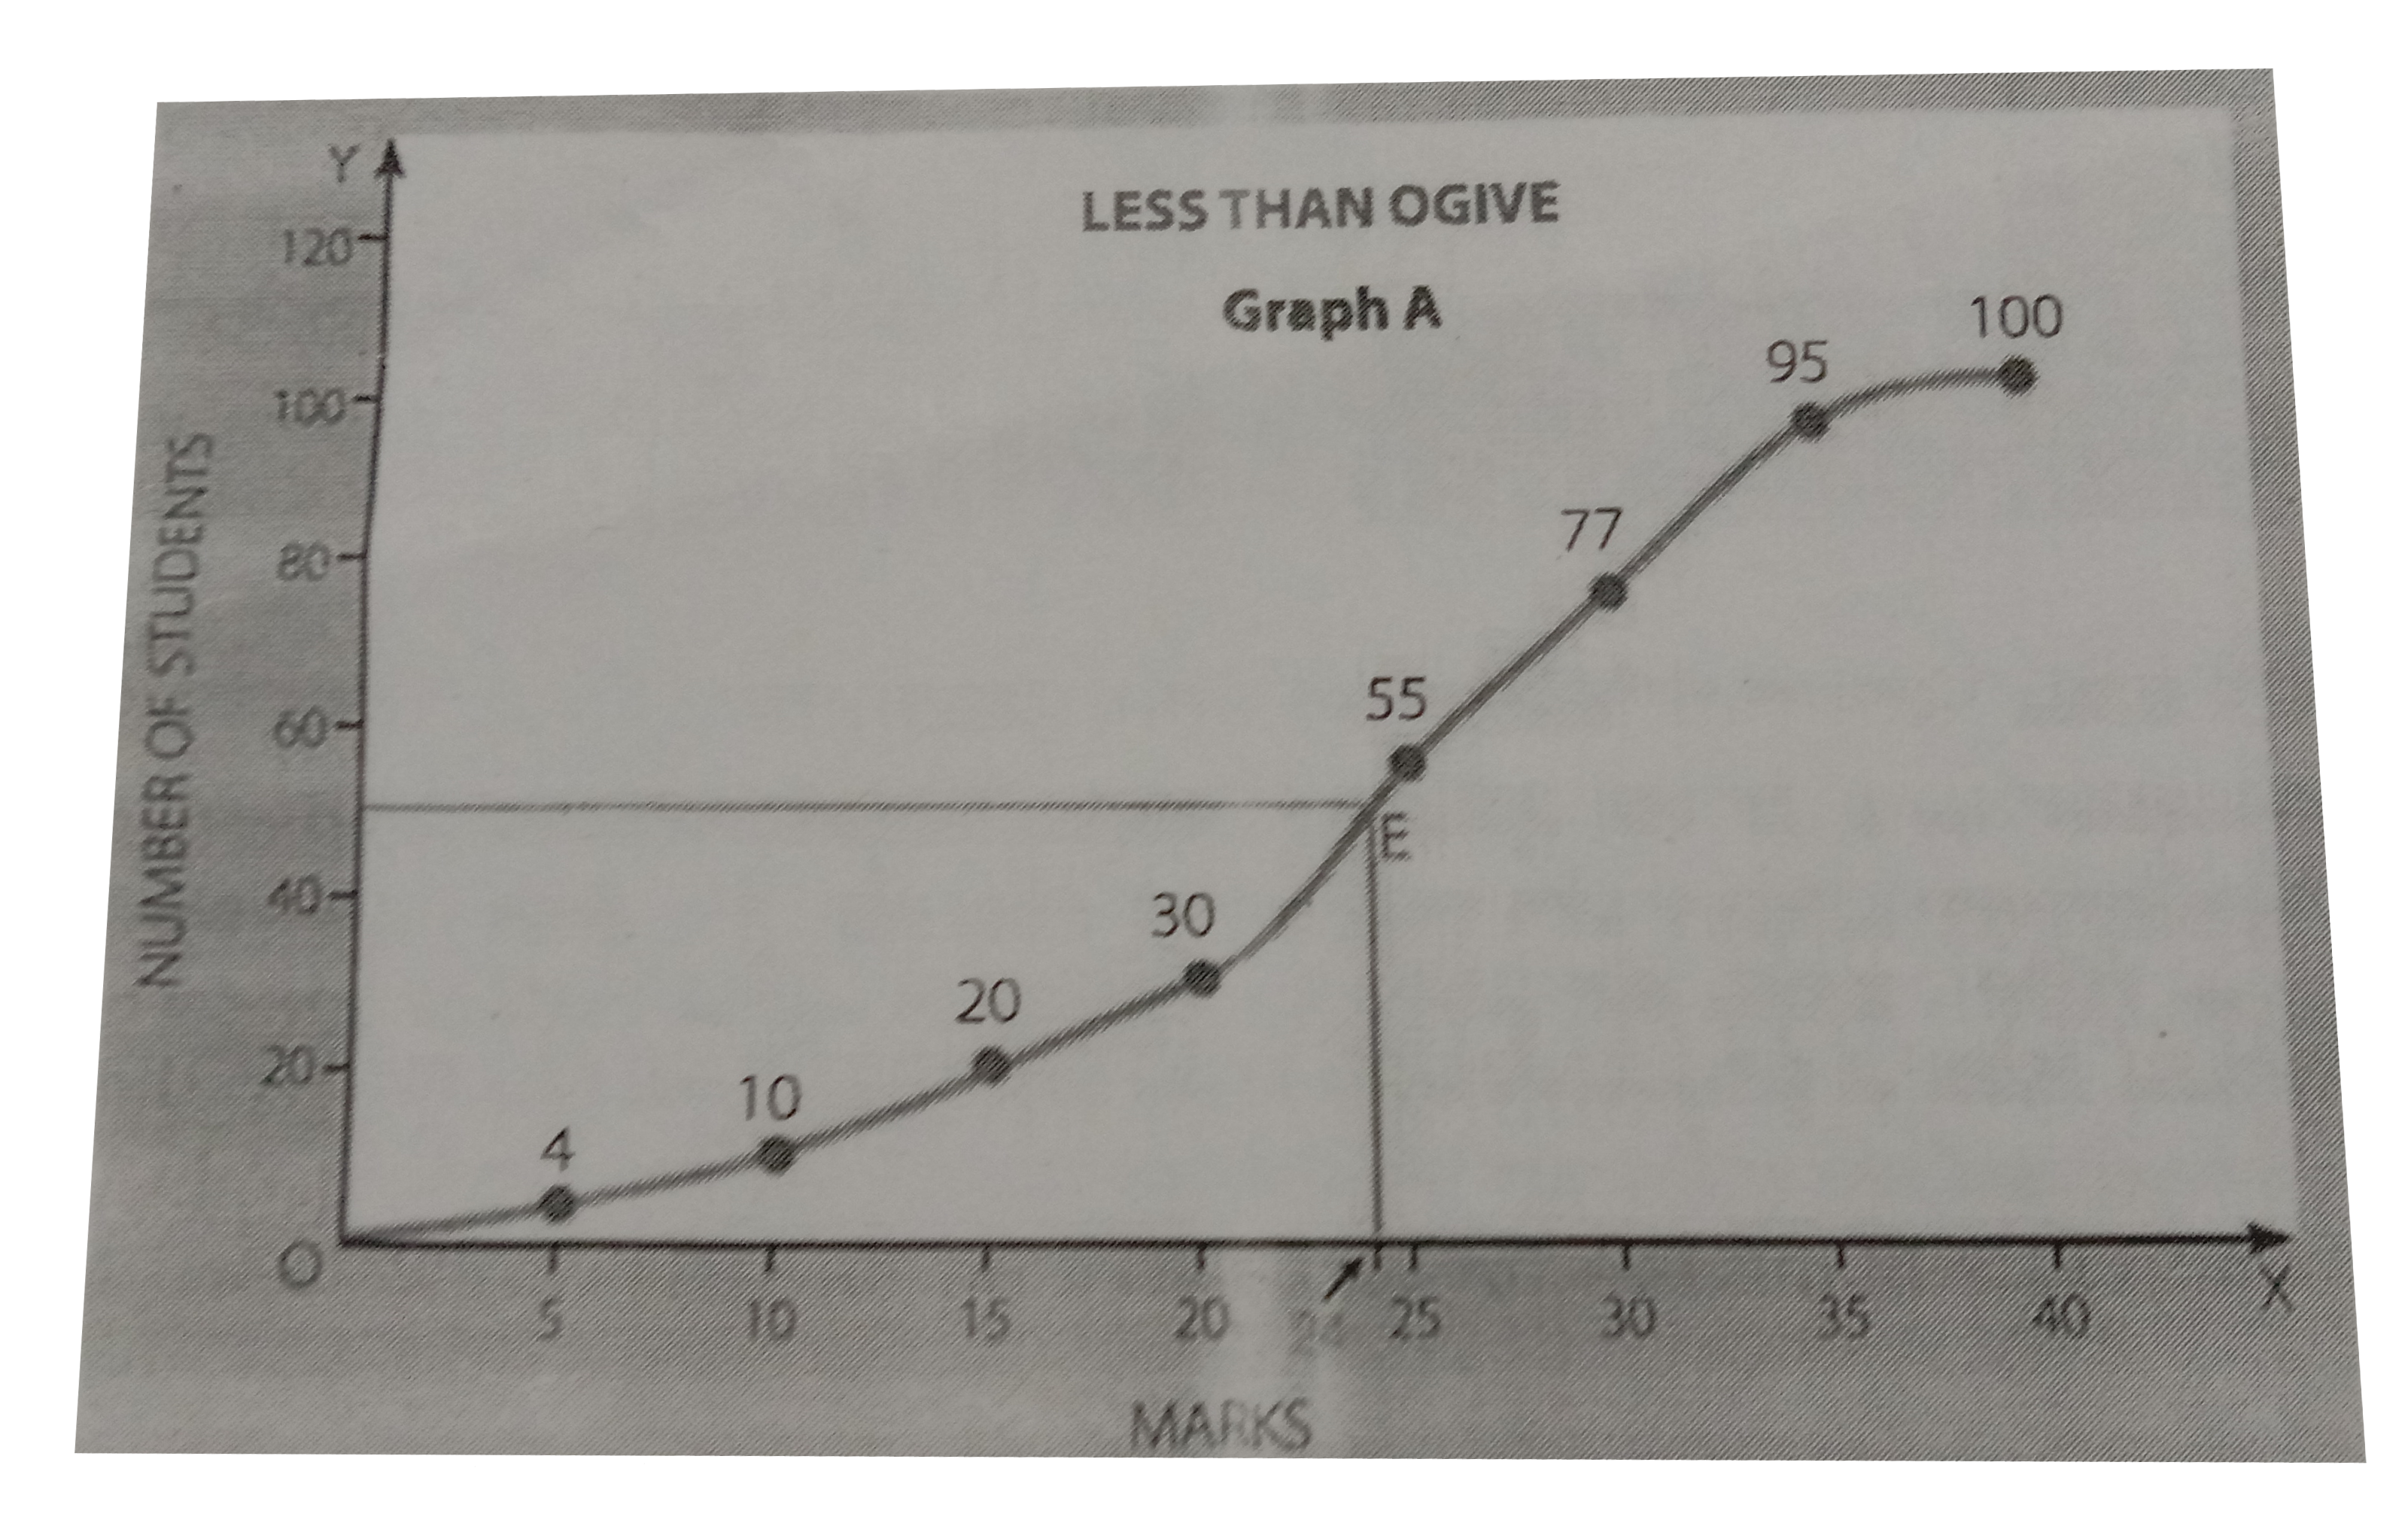
(ii) Find out (N2) th item and mark it on the Y-axis . In the above illustration (N2) th item is 1002=50.
(iii) Draw a perpendicular from 50 to the right to cut the cumulative point E where cumulative frequency curve (ogive) at point E.
(iv) From the point E where cumulative frequency curve (ogive) is cut , draw a perpendicular on X- axis . The point at which it touches X- axis will be the median value if the series ,as shown in Graph A :

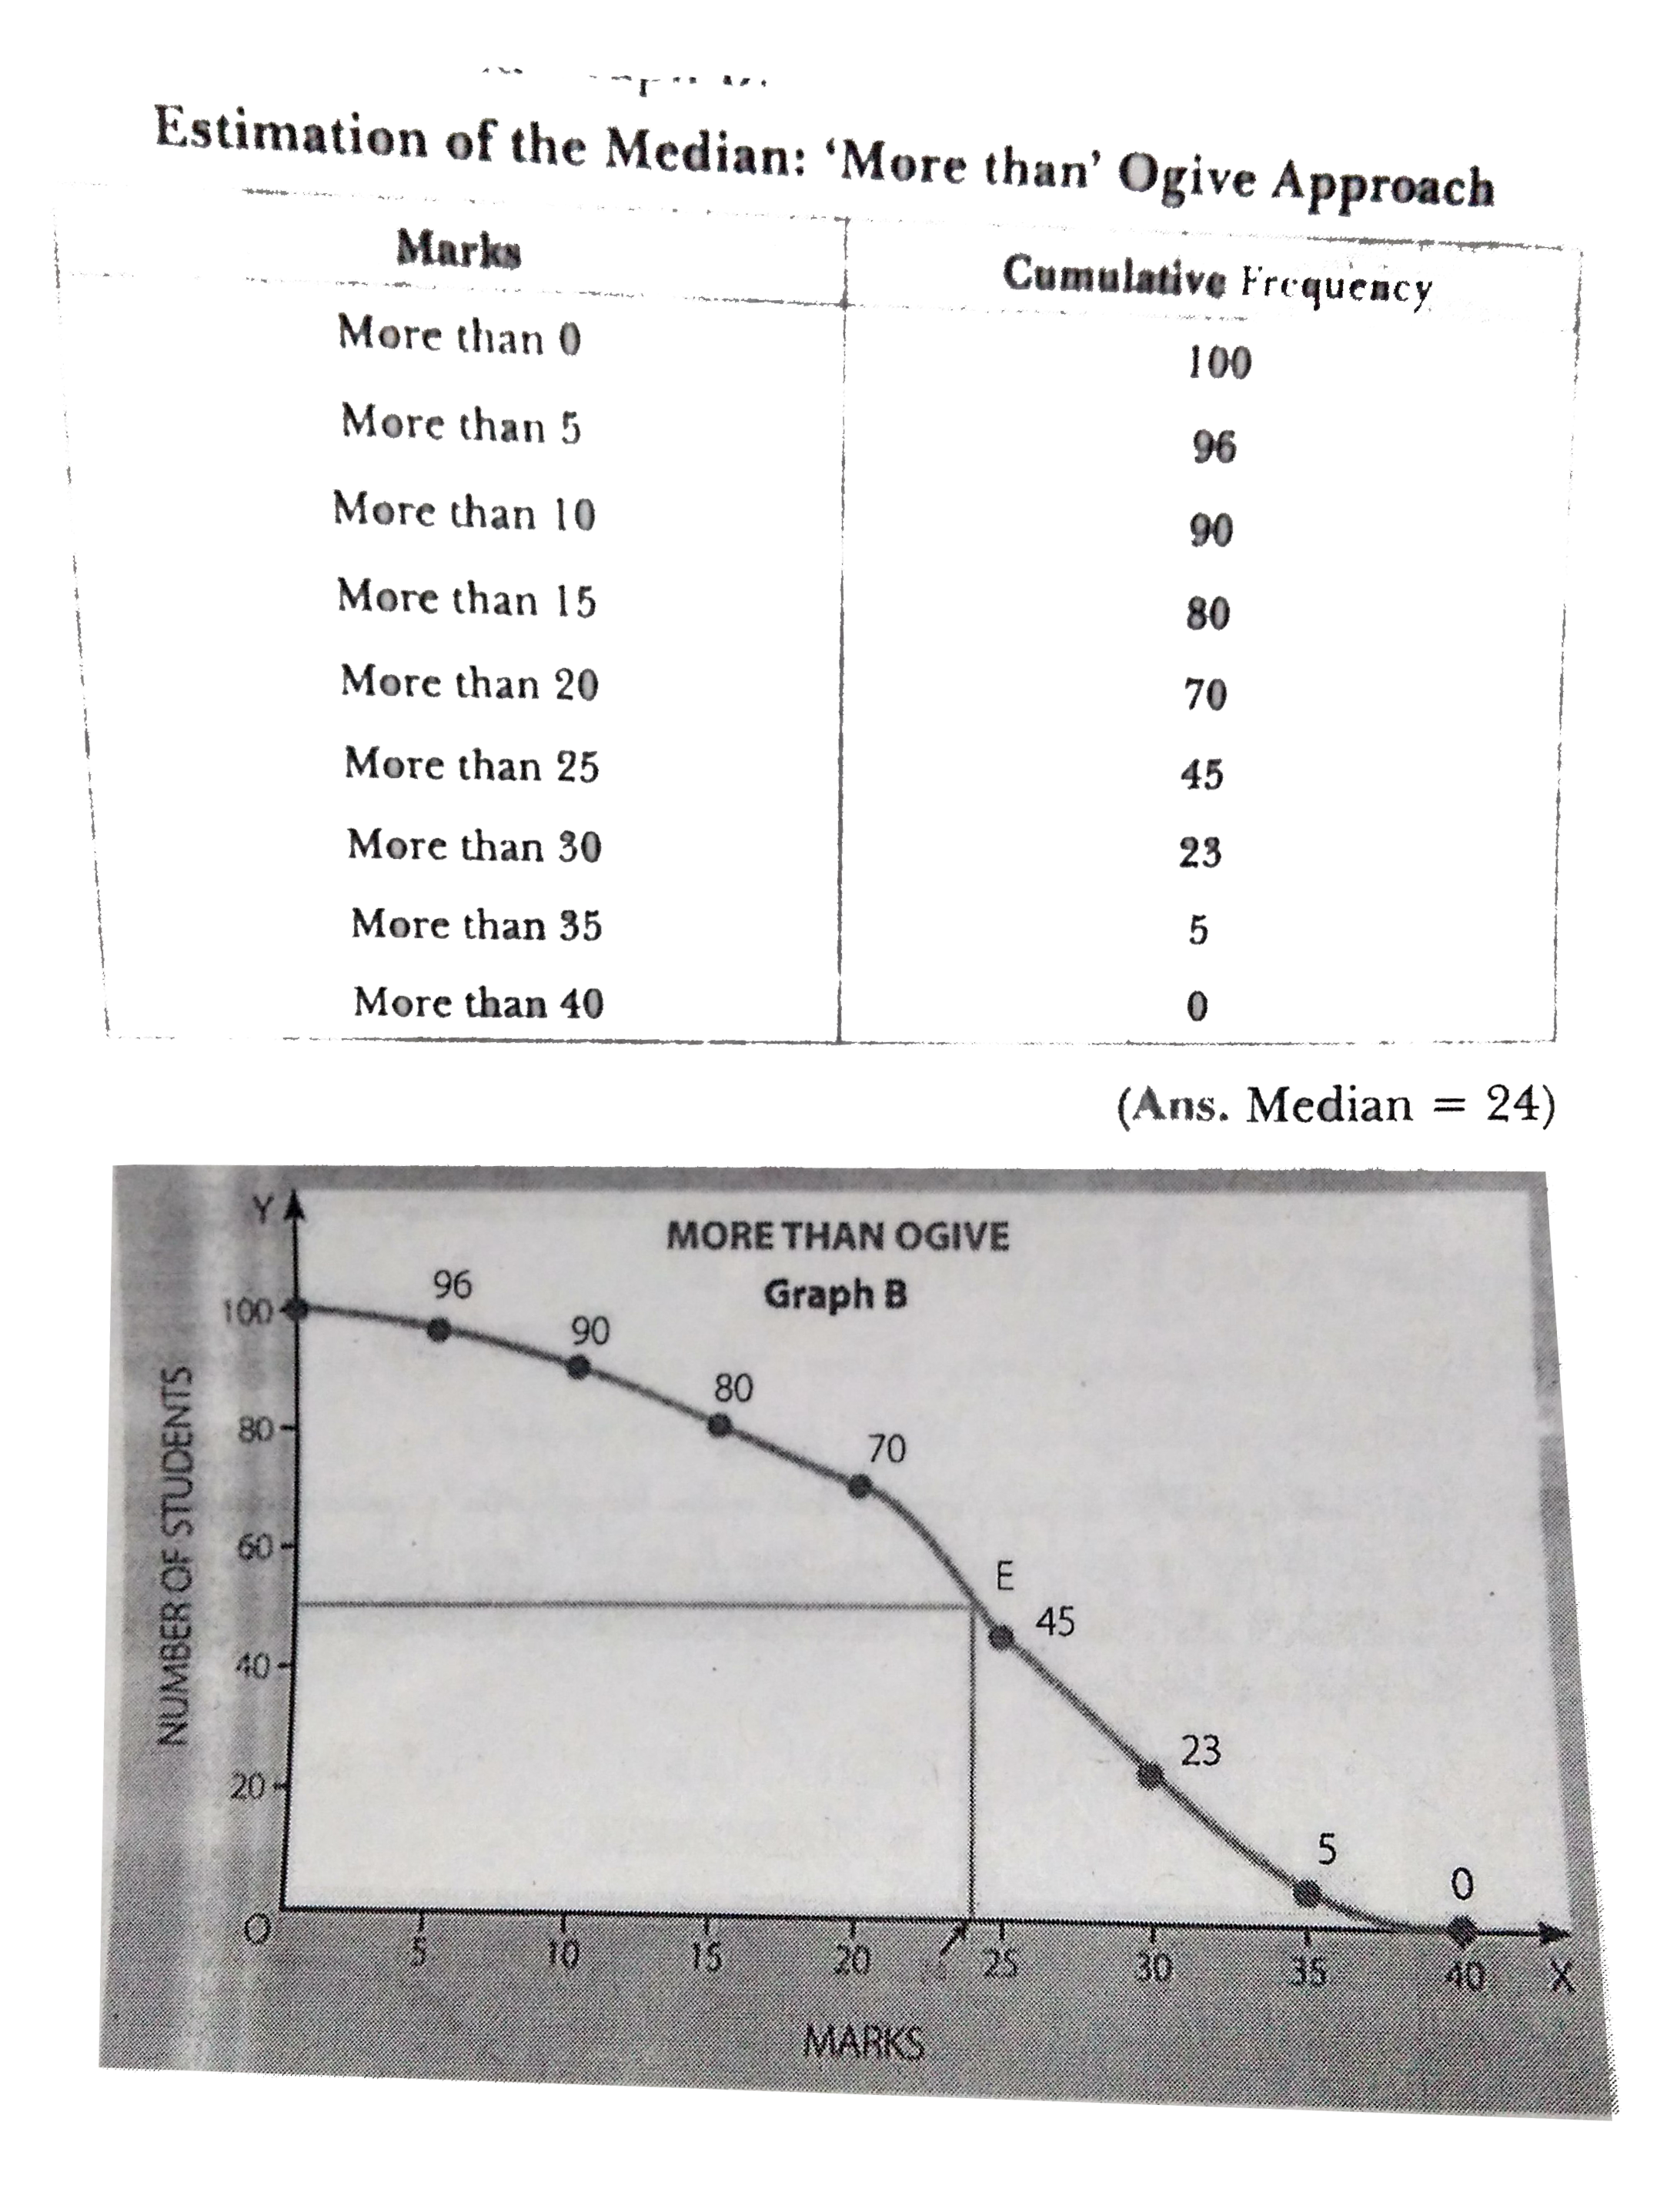
Using 'more' than ogive approach , the calculation of the median involves the similar procedure , as should be evident from the following table and Graph B :

Median = 24

Median = 24
Topper's Solved these Questions
- BOOK - TARUN JAIN & VK OHRICHAPTER - MEASURES OF CENTRAL TENDENCY MEDIAN AND MODEEXERCISE - Miscellaneous Illustrations30videos
MEASURES OF CENTRAL TENDENCY MEDIAN AND MODE
- BOOK - TARUN JAIN & VK OHRICHAPTER - MEASURES OF CENTRAL TENDENCY MEDIAN AND MODEEXERCISE - Objective Type Questios26videos
MEASURES OF CENTRAL TENDENCY MEDIAN AND MODE
- BOOK - TARUN JAIN & VK OHRICHAPTER - MEASURES OF CENTRAL TENDENCY - ARITHMETIC MEANEXERCISE - Illustration72videos
MEASURES OF CENTRAL TENDENCY - ARITHMETIC MEAN
- BOOK - TARUN JAIN & VK OHRICHAPTER - MEASURES OF DISPERSIONEXERCISE - Learning by doing30videos
MEASURES OF DISPERSION
Similar Questions
The following table gives the marks obtained by some students.
Calculate the median marks obtained by the students.
Marks0−55−1010−1515−2020−2525−3030−3535−4040−45Number of Students 6 12 17 30 10 10 8 5 2View SolutionThe marks obtained by 100 students of a school are given below.
Marks0−55−1010−1515−2020−2525−3030−3535−40No . of Students 4 6 10 10 25 22 18 5
Find out Q1,Q3,D6andP95.View Solution
Knowledge Check
- Question 1 - Select One
The value of Q3 for the following distribution is
Marks group:5−1010−1515−2020−2525−3030−3535−4040−45No of Student:5615105421A15B21.5C25D25.5
Calculate the median value , given the following statistical information :
Age20−2525−3030−3535−4040−4545−5050−5555−60Number of Students 50 70 100 180 150 120 70 60View SolutionFind out mode from the following data :
Class Interval5−1010−1515−2020−2525−3030−3535−40Number of Childern 4 5 3 2 6 7 3View SolutionCalculate the median from the following series :
Age (Years)55−6050−5545−5040−4535−4030−3525−3020−25Number of Students 7 13 10 15 30 33 28 14View SolutionGiven the following data , find out median :
Age20−2525−3030−3535−4040−4545−5050−5555−60Number of Students 50 70 100 180 150 120 70 60View SolutionCaculate the mode from the following data :
Wages (Rs.)0−55−1010−1515−2020−2525−3030−35Number of Workers 3 7 15 30 20 10 5View SolutionLocate the median graphically from the following data :
Marks0−1010−2020−3030−4040−50Number of Students 10 20 30 20 10View SolutionCalculate mode of the following sercies :
Class Interval0−55−1010−1515−2020−2525−3030−35Frequency 1 2 10 4 10 9 2View Solution

