Locate the median graphically from the following data :
Marks0−1010−2020−3030−4040−50Number of Students 10 20 30 20 10
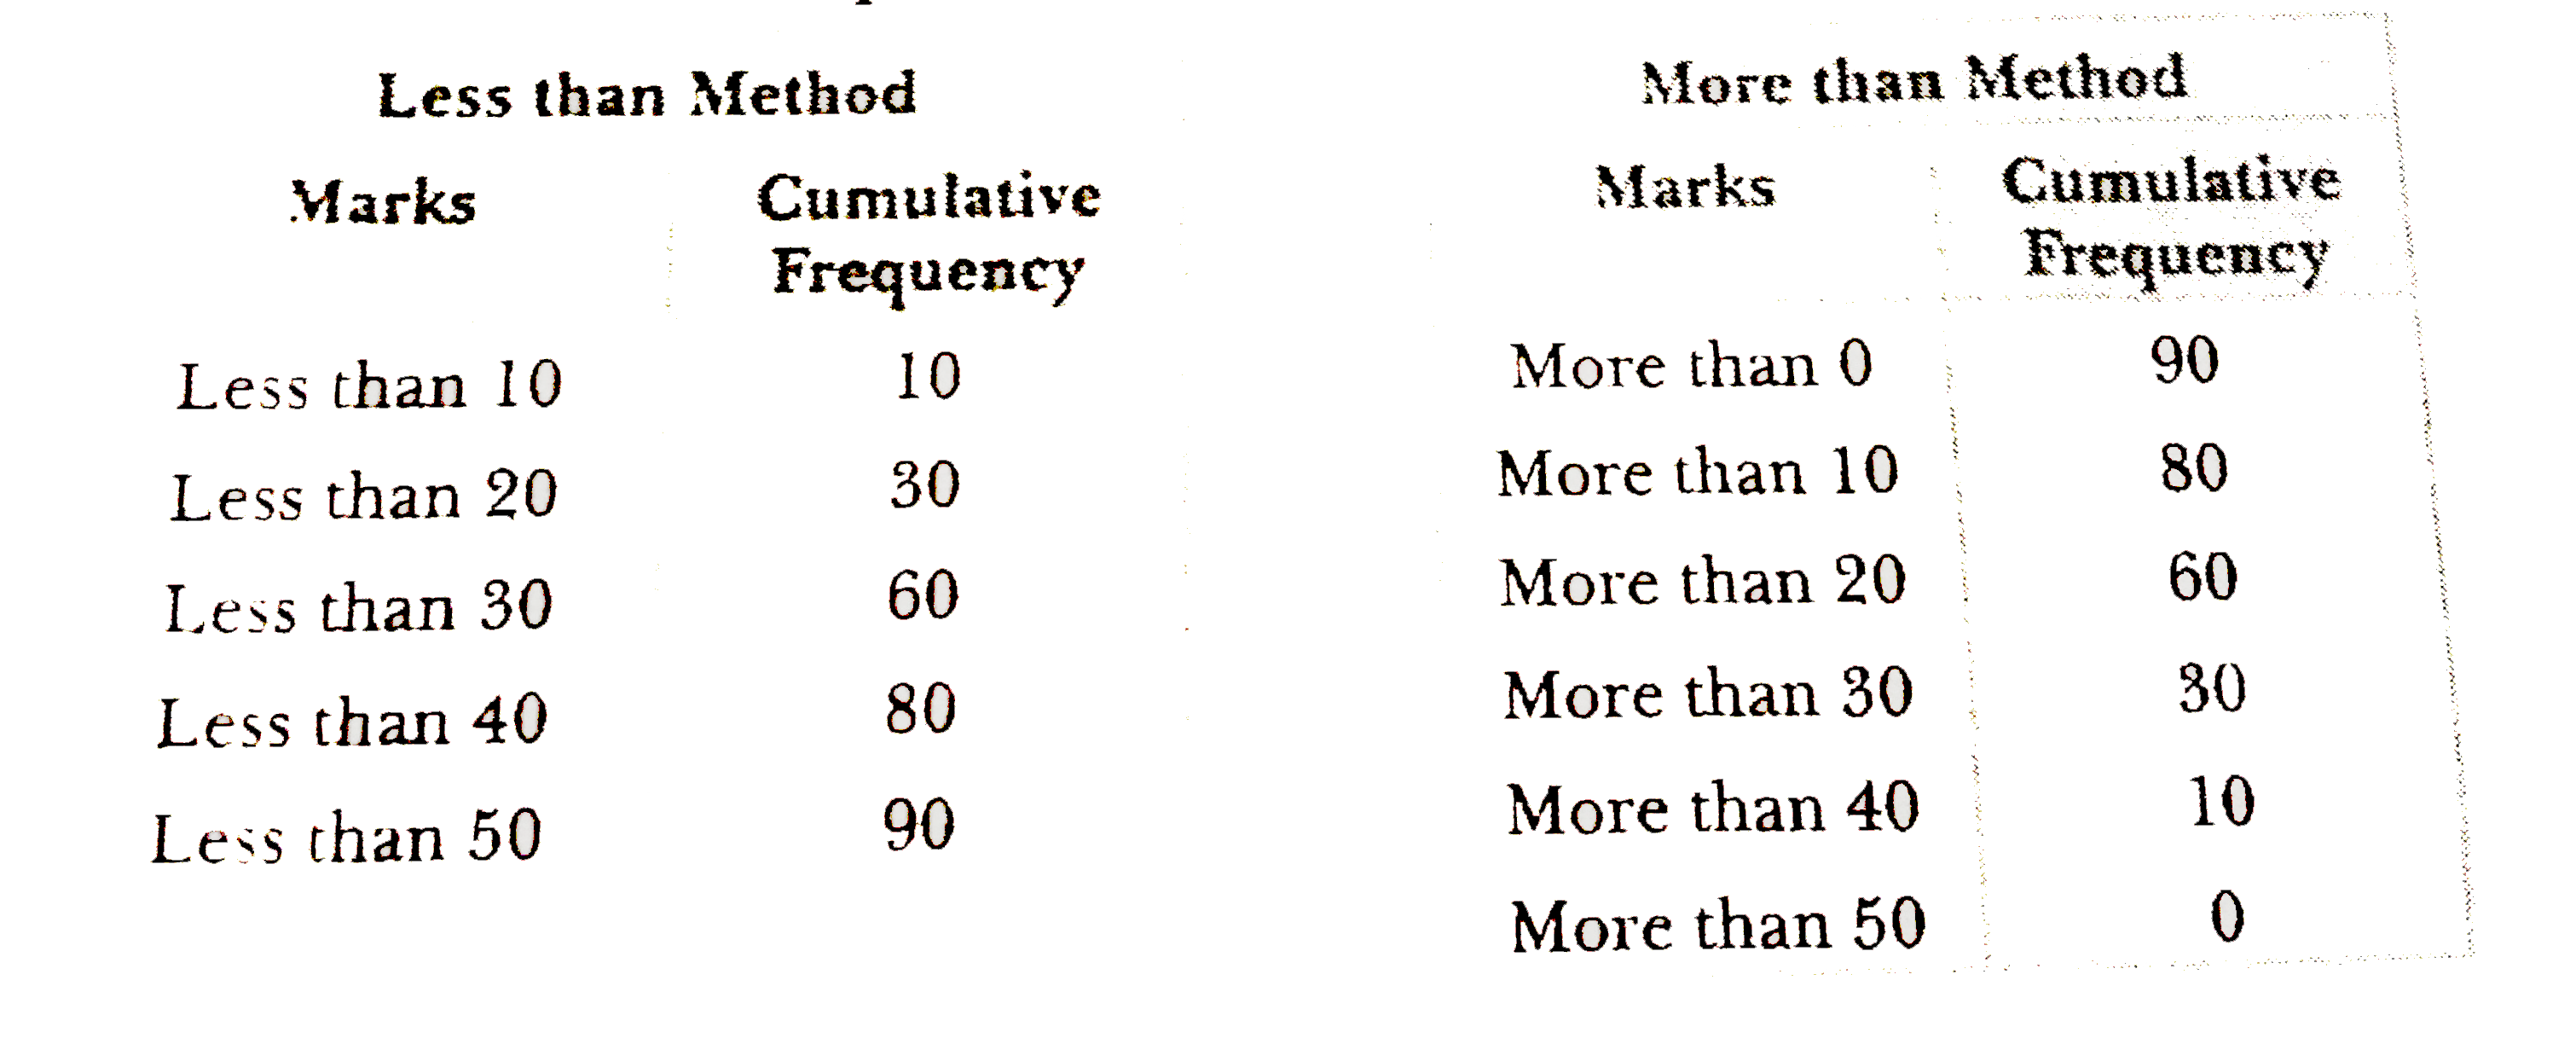
Firstly we convert the given distribution into less and more than ' cumulative frequencies distribution .

Method I : Using the less than ogive and more than ogive method , the median is computed graphicallya as follows :
 <br> M= Size of <span class=) ((N)/(2))thitem<br>=Sizeof((90)/(2))thitem<br>=SIizeof45thitem<br>Itlies∈theerval20−30.<br>MethodII:Bymak∈guseof⊥htheogivecurves→≥ther,themedianiscomputedgraϕcallyasfollows:<br>( ## TRJ_ECO_XI_C01_S01_050_S03.png" width="80%">
((N)/(2))thitem<br>=Sizeof((90)/(2))thitem<br>=SIizeof45thitem<br>Itlies∈theerval20−30.<br>MethodII:Bymak∈guseof⊥htheogivecurves→≥ther,themedianiscomputedgraϕcallyasfollows:<br>( ## TRJ_ECO_XI_C01_S01_050_S03.png" width="80%">
It is clear from the above figure that less than ogive curve and more than ogive curve meet each other at point E. The value of median is 25.
Median 25.
Topper's Solved these Questions
- MEASURES OF CENTRAL TENDENCY MEDIAN AND MODEBOOK - TARUN JAIN & VK OHRICHAPTER - MEASURES OF CENTRAL TENDENCY MEDIAN AND MODEEXERCISE - Objective Type Questios
26 Videos
- MEASURES OF CENTRAL TENDENCY MEDIAN AND MODEBOOK - TARUN JAIN & VK OHRICHAPTER - MEASURES OF CENTRAL TENDENCY MEDIAN AND MODEEXERCISE - Concept - based Objective Questions
7 Videos
- MEASURES OF CENTRAL TENDENCY MEDIAN AND MODEBOOK - TARUN JAIN & VK OHRICHAPTER - MEASURES OF CENTRAL TENDENCY MEDIAN AND MODEEXERCISE - NCERT Questions (With Hints to Answers)
5 Videos
- MEASURES OF CENTRAL TENDENCY - ARITHMETIC MEANBOOK - TARUN JAIN & VK OHRICHAPTER - MEASURES OF CENTRAL TENDENCY - ARITHMETIC MEANEXERCISE - Illustration
72 Videos
- MEASURES OF DISPERSIONBOOK - TARUN JAIN & VK OHRICHAPTER - MEASURES OF DISPERSIONEXERCISE - Learning by doing
30 Videos
Similar Questions
Find out median marks from the following data :
Marks0−1010−2020−3030−4040−50Number of Students 8 30 40 12 10
View SolutionCaculate the median and mode from the following data :
Marks0−1010−2020−3030−4040−5050−6060−7070−80Number of Students 2 18 30 45 35 20 6 3
View SolutionFind the missing frequency in the following distribution if N=100 and M=30.
Marks0−1010−2020−3030−4040−5050−60Number of Students 10 ? 25 30 ? 10
View SolutionObtain the mean , median and mode of the following data :
Marks0−1010−2020−3030−4040−5050−6060−7070−80Number of Students 5 7 15 25 20 15 8 5
View SolutionCalculate the mean marks from the following data:
Marks20−2525−3030−3535−4040−4545−5050−55No. of Students 10 12 8 20 11 4 5
View SolutionCalculate the mean marks from the following data:
Marks20−2525−3030−3535−4040−4545−5050−55No. of Students 10 12 8 20 11 4 5
View SolutionCalculate mode from the following data :
Class Interval0−1010−2020−3030−4040−50Frequency 2 5 7 5 2
View SolutionCalculate median of the following of data :
Class Interval0−55−1010−2020−3030−5050−7070−100Number of Students 12 15 25 40 42 14 8
View SolutionCalculate the mean devation from the mean the following data:
Marks0−1010−2020−3030−4040−50No. of stu.5815166
View SolutionCaculate mode of the following data :
Marks0−55−1010−2020−4040−6060−8080−9090−100Number of Students 5 7 9 25 30 24 8 6
View Solution
