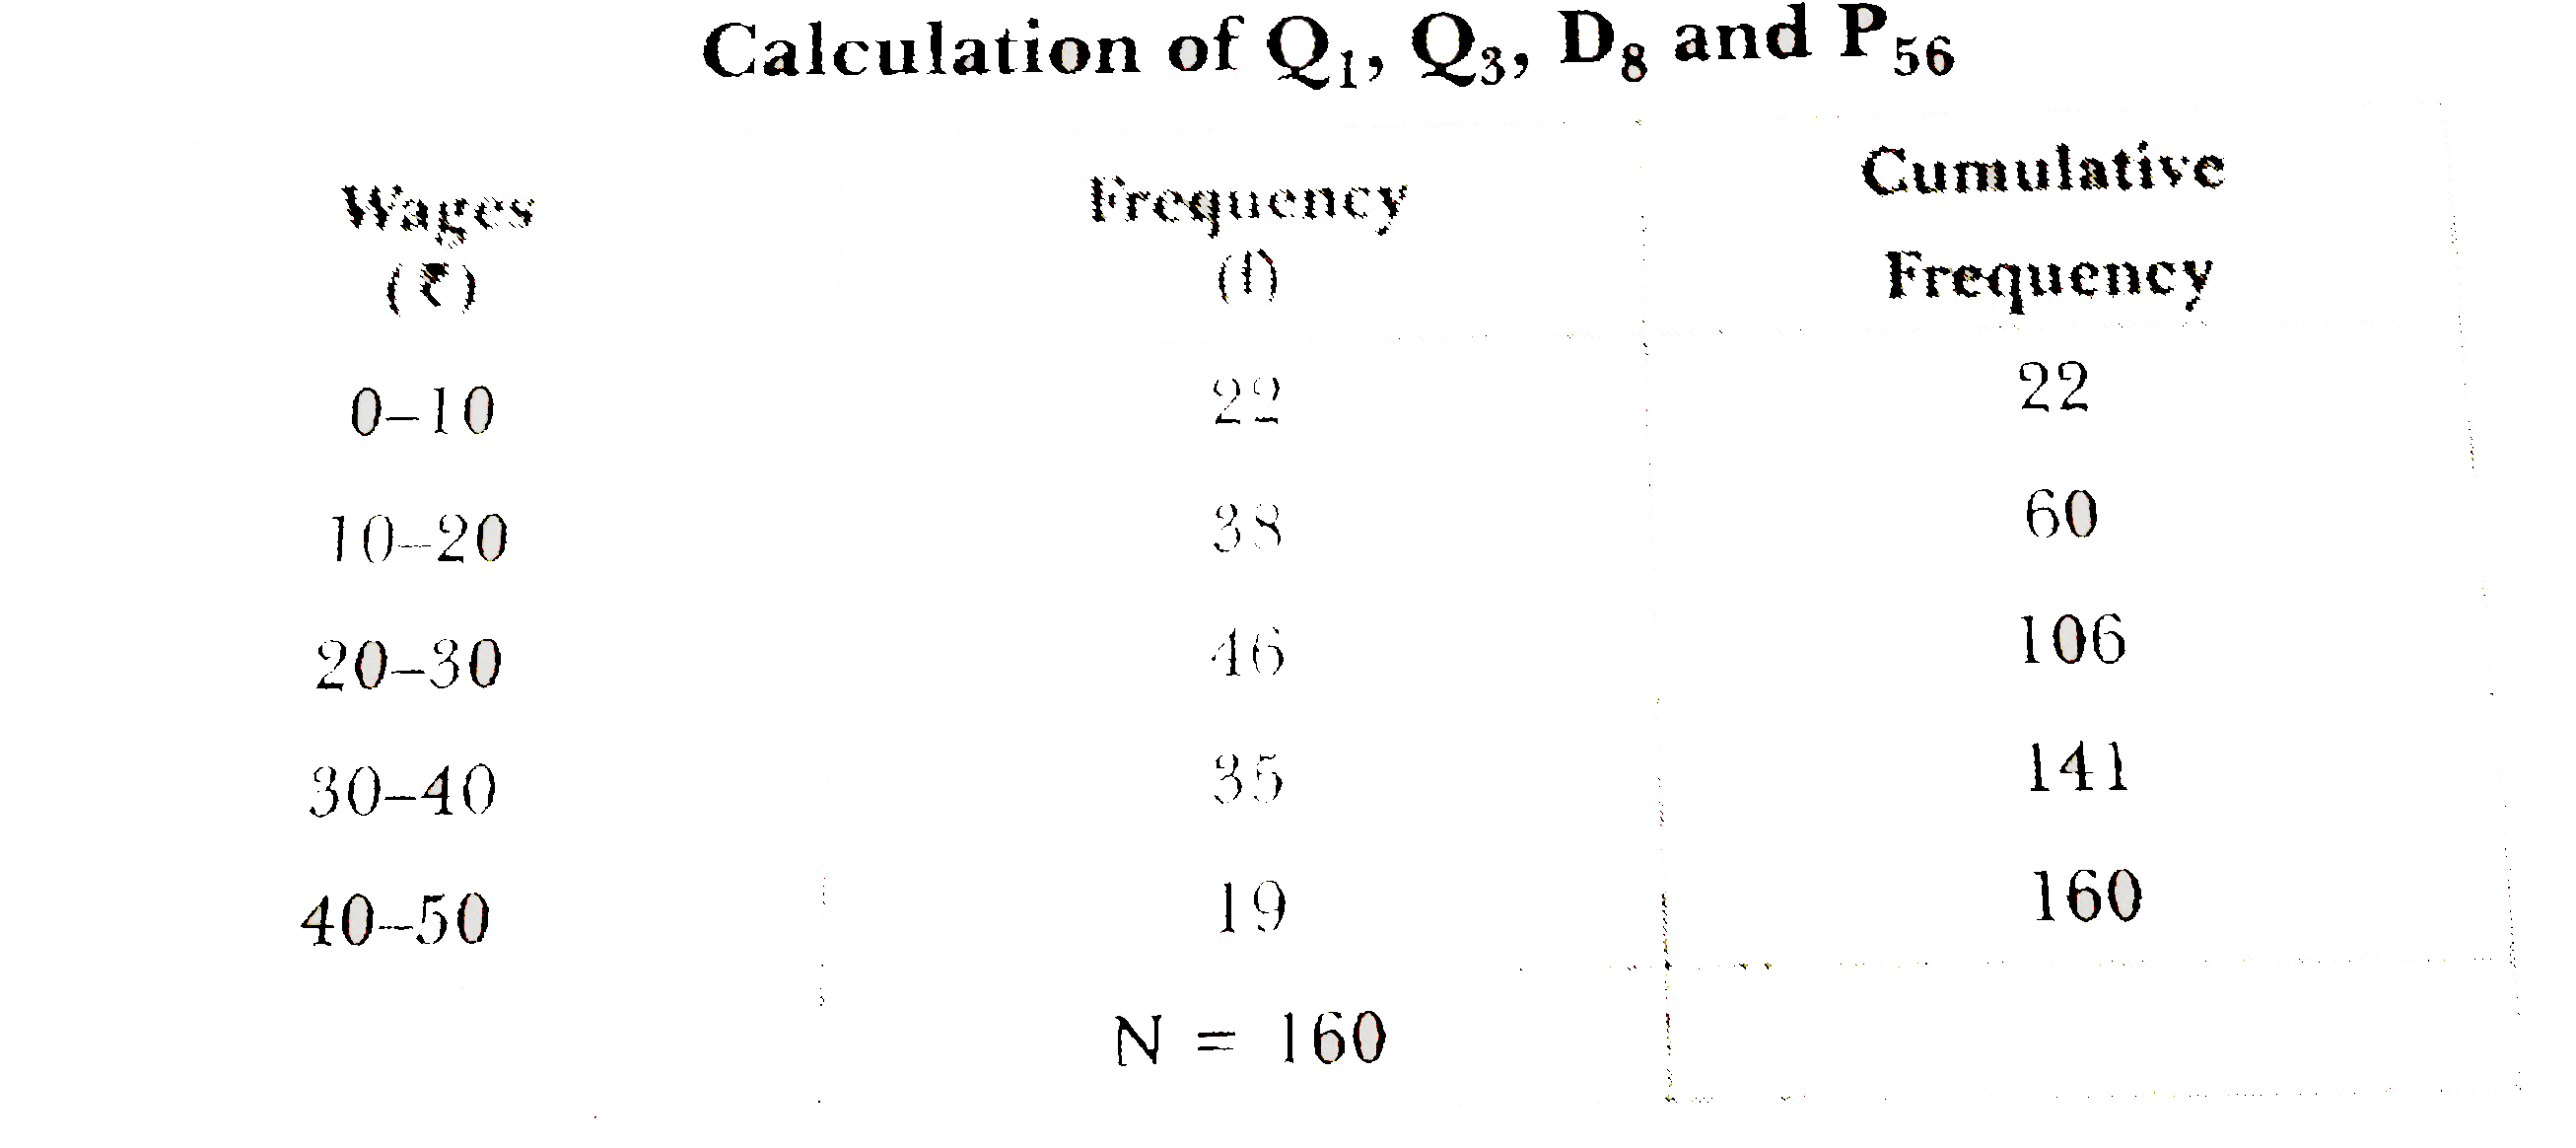
Calculate the values of Q1,Q3,D8andP85 - from the following data :
Wages (Rs.)0−1010−2020−3030−4040−50Number of Workers 22 38 46 35 19

Q1 = Size of (N4)th item = Size of (1604)th item
= Size of 40th item.
Q1 lies in 60th cumulative frequency . The class interval corresponding to cumulative frequency is 10-20.
Thus, Q1=l1+N2−c.f.f×i
=10+1604−2238×10
=10+40−2238×10=10+1838×10
10+4.74=14.74 Q3 = Size of 3(N4) th item = Size of 3(1604) th item
= Size of 120th item
Q3 lies in 141 th cumulative frequency . the class interval corresponding to this cumulative frequency is 30-40.
Thus, Q3=l1+3(N4)−c.f.f×i
=30+3(1604)−16035×10
=30+120−10635×10=30+1435×10
=30+4=34
D8=Size of 8(N10) item
= Size of 8(16010) th item
= Size of 128 th item
D8 lies in 14th cumulative frequency . the class interval corresponding to this cumulative frequency is 30-40.
Thus , D8=l1+8(N10)−c.f.f×i
=30+8(16010)−10635×10=30+128−10635×10
=30+2235×10
=30+6.29
=36.29
P56 = Size of 56(N100) th item
Size of 89.6th item
P56 lies in 106th cumulative frequency . the class interval corresponding to this cumulative frequency is 20-30.
Thus , P56=l1+56(N100)−c.f.f×i
=20+56(160100)−6046×10
=20+89.6−6046×10
=20+29.646×10
=20+6.43
=26.43
Thus , Q1=14.74,Q3=34,D8=36.29,P56=26.43.
Topper's Solved these Questions
- MEASURES OF CENTRAL TENDENCY MEDIAN AND MODEBOOK - TARUN JAIN & VK OHRICHAPTER - MEASURES OF CENTRAL TENDENCY MEDIAN AND MODEEXERCISE - Miscellaneous Illustrations
30 Videos
- MEASURES OF CENTRAL TENDENCY MEDIAN AND MODEBOOK - TARUN JAIN & VK OHRICHAPTER - MEASURES OF CENTRAL TENDENCY MEDIAN AND MODEEXERCISE - Objective Type Questios
26 Videos
- MEASURES OF CENTRAL TENDENCY - ARITHMETIC MEANBOOK - TARUN JAIN & VK OHRICHAPTER - MEASURES OF CENTRAL TENDENCY - ARITHMETIC MEANEXERCISE - Illustration
72 Videos
- MEASURES OF DISPERSIONBOOK - TARUN JAIN & VK OHRICHAPTER - MEASURES OF DISPERSIONEXERCISE - Learning by doing
30 Videos
Similar Questions
Find out median value of the following distribution:
Wege Rate (Rs.)0−1010−2020−3030−4040−50Number of Workers 22 38 46 35 20
View SolutionFind out median marks from the following data :
Marks0−1010−2020−3030−4040−50Number of Students 8 30 40 12 10
View SolutionCaculate the mode from the following data :
Wages (Rs.)0−55−1010−1515−2020−2525−3030−35Number of Workers 3 7 15 30 20 10 5
View SolutionLocate the median graphically from the following data :
Marks0−1010−2020−3030−4040−50Number of Students 10 20 30 20 10
View SolutionCalculate mode from the following data :
Class Interval0−1010−2020−3030−4040−50Frequency 2 5 7 5 2
View SolutionFind out median of the following series :
Wage Rate (Rs.)25−3020−2515−2010−155−100−5Number of Workers 5 10 20 5 8 2
View SolutionCaculate the median and mode from the following data :
Marks0−1010−2020−3030−4040−5050−6060−7070−80Number of Students 2 18 30 45 35 20 6 3
View SolutionFind out mode from the following data :
Class Interval5−1010−1515−2020−2525−3030−3535−40Number of Childern 4 5 3 2 6 7 3
View SolutionCalculate median of the following of data :
Class Interval0−55−1010−2020−3030−5050−7070−100Number of Students 12 15 25 40 42 14 8
View SolutionCalculate the arithmetic mean (AM) of the following data:
Salaries of Employees0−1010−2020−3030−4040−50(in thousand rupees)Number of Employees 4 13 8 9 6
View Solution
