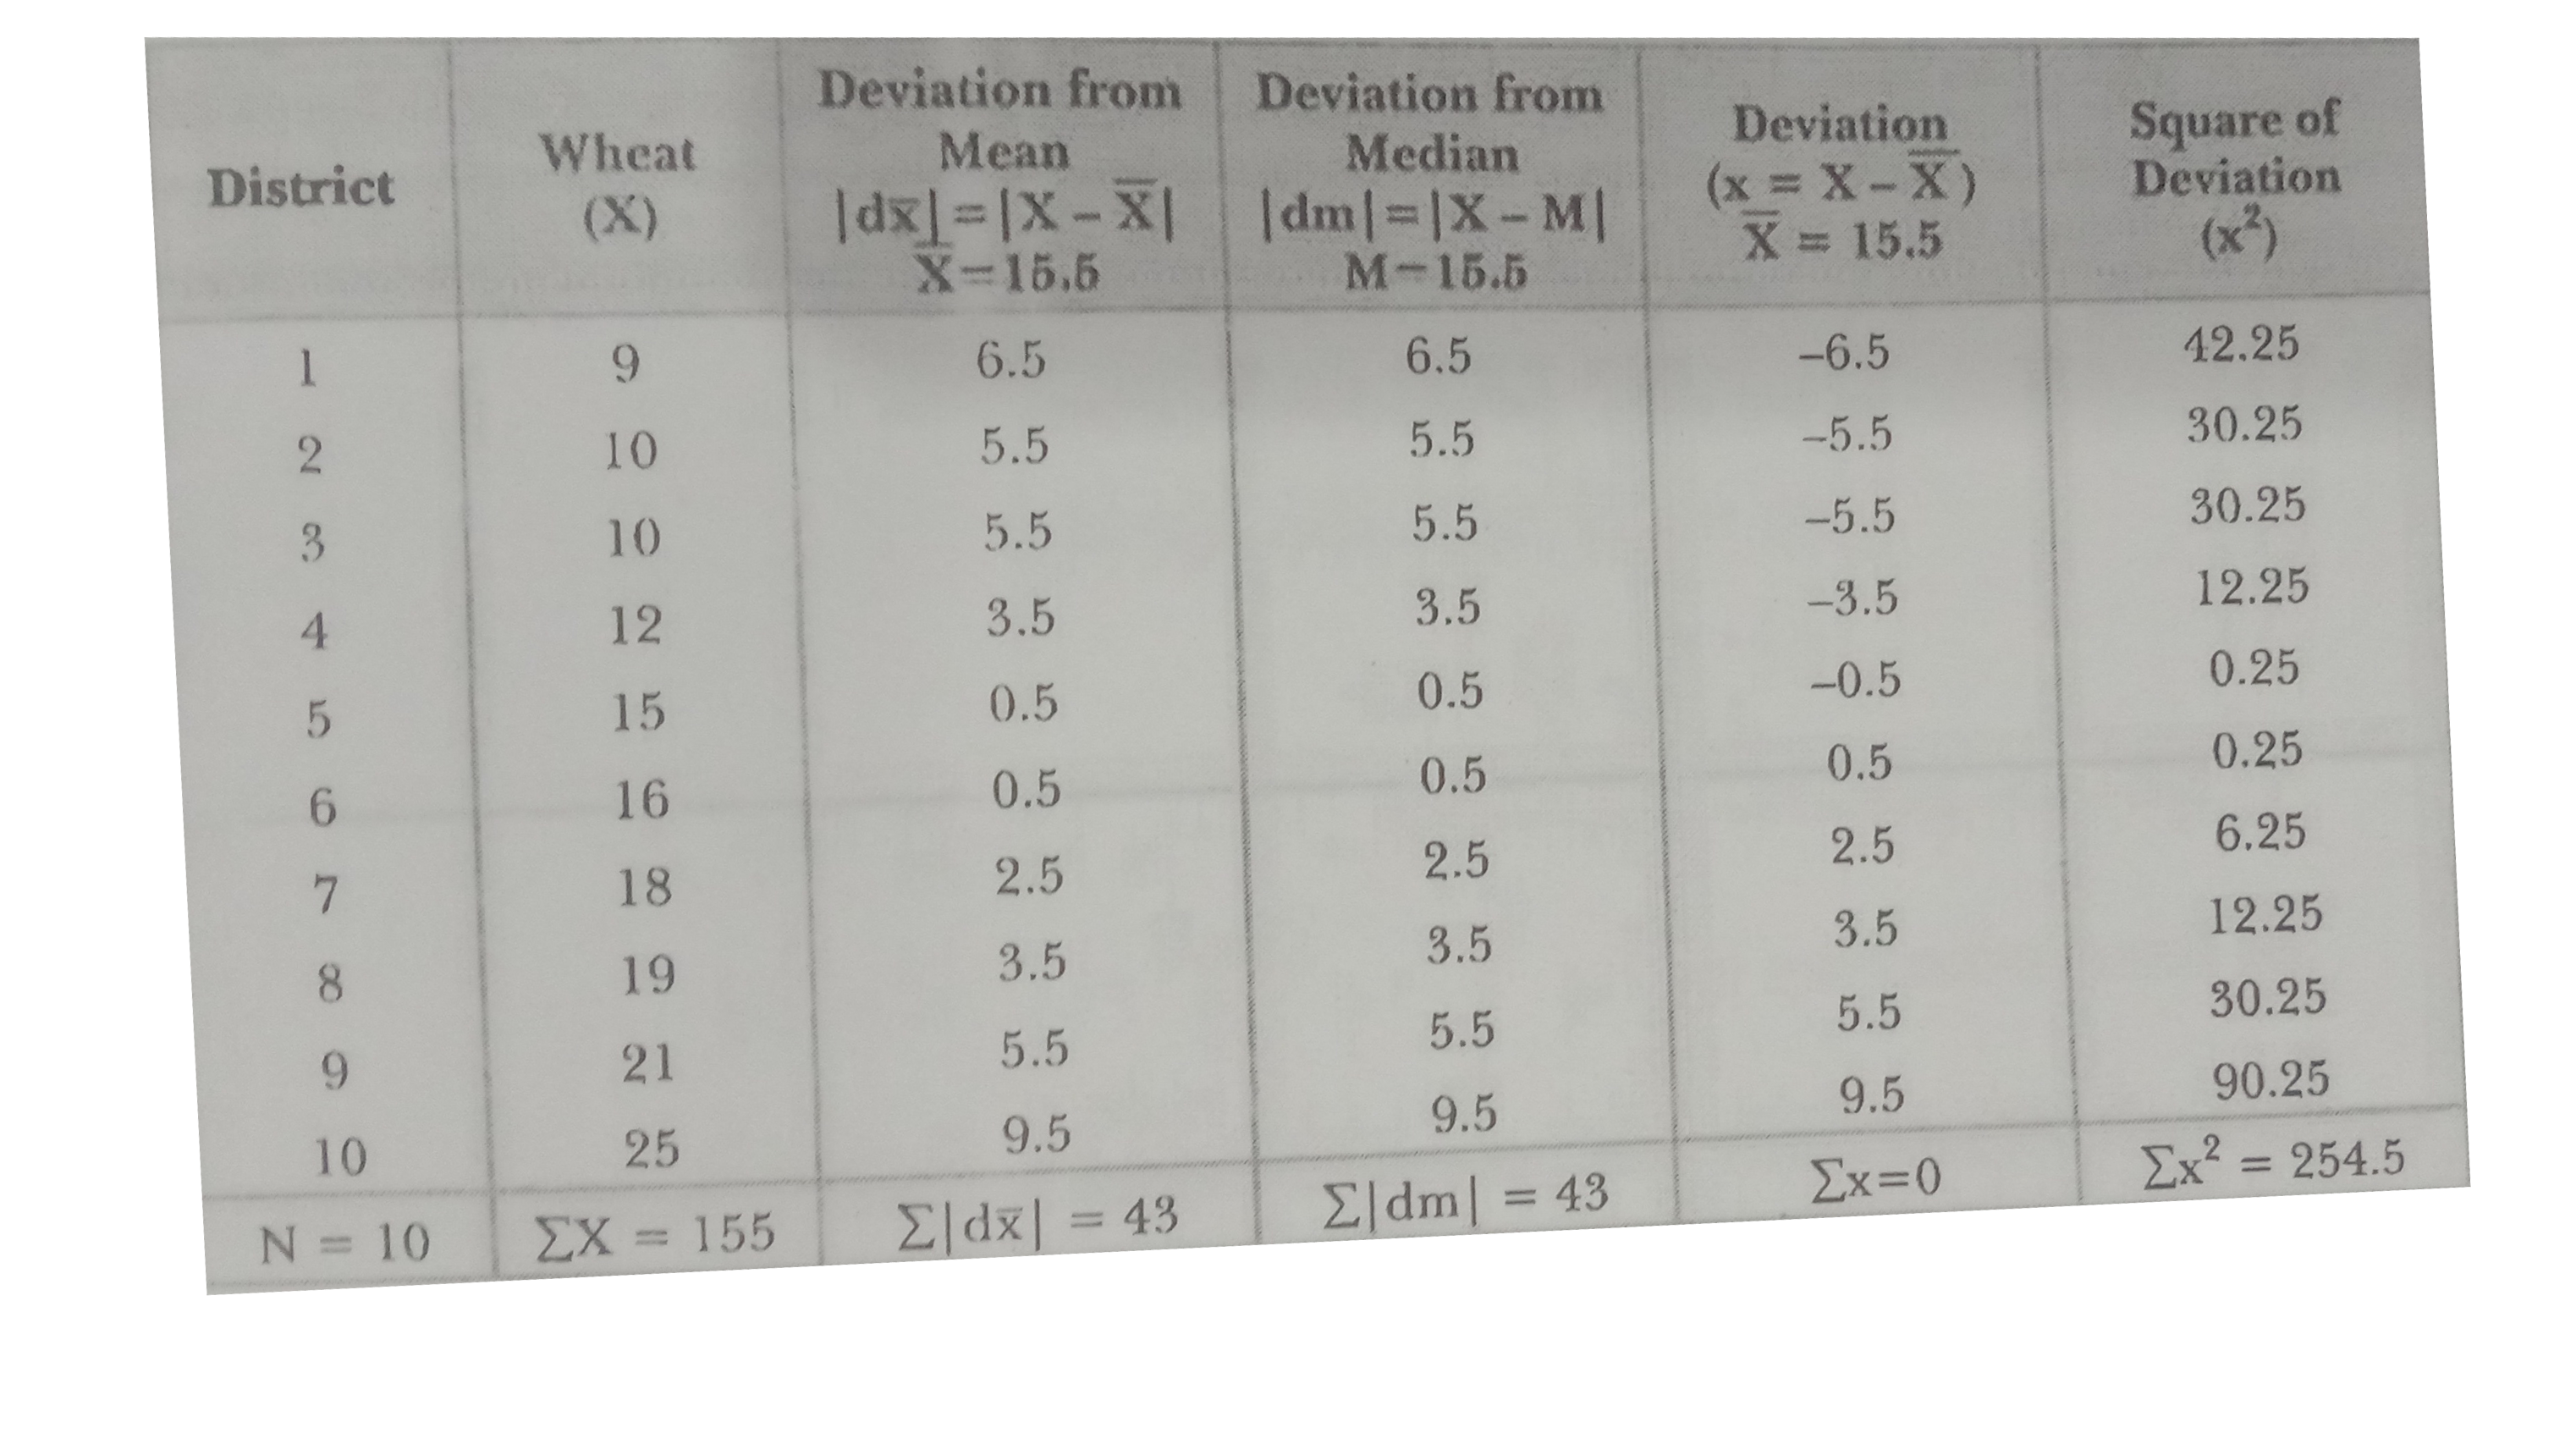
The yield of wheat and rice per acre for 10 districts of a state is as under:

Calculate for each crop,
(i) Range
(ii) Q.D.
(iii) Mean Deviation about Mean
(iv) Mean deviation about Median
(v) Standard Deviation
(vi) Which crop has greater variations?
(vii) Compare the values of different measures for each crop.
[ Case of Wheat:
Firstly arrange the data in ascending order:

(i) Range (R )=H-L
Here, H=25, L=9
∴ R=25-9=16
(ii) Q1=Size of (N+14)th item
=Size of (10+14)th item
=Size of 2.75th item
=Size of 2nd item+34(Size of 3rd item−Size of 2nd item)
=10+34(10−10)
=10+0=10
Q3=Size of 3(N+14)th item
=Size of 3(10+14)thitem
=Size of 8.25th item
=Size of 8th item +14(Size of 9th item−Size of 8th item)
=19+14(21−19)=19+24=19.5
Quartile Deviation=Q3−Q12=19.5−102=9.52=4.75
(iii) Mean (¯¯¯X)=∑XN=15510=15.5
Mean Deviation from Mean (MD¯¯¯X)=∑|dx|N=4310=4.3
(iv) Median (M)=Size of (N+12)th item
=Size of (10+12)th item=Size of 5.5th item
=Size of 5th item+Size of 5th item)2
=15+162=312=15.5
Mean Deviation from Median (MDm)=∑|dm|N=4310=4.3
(v) Standard Deviation (σ)=√∑x2N=√254.510=√25.45=5.04
(vi) Coefficient of Variation (CV)=σ¯¯¯X×100=5.0415.5×100=32.52]
[Note: Students are advised to repeat this exercise using data for the rice crop. To assess the degree of variation, compare CV for the two cases.]
Topper's Solved these Questions
- MEASURES OF DISPERSIONBOOK - TARUN JAIN & VK OHRICHAPTER - MEASURES OF DISPERSIONEXERCISE - Learning by doing
30 Videos
- MEASURES OF DISPERSIONBOOK - TARUN JAIN & VK OHRICHAPTER - MEASURES OF DISPERSIONEXERCISE - Essential Practicals
22 Videos
- MEASURES OF CENTRAL TENDENCY MEDIAN AND MODEBOOK - TARUN JAIN & VK OHRICHAPTER - MEASURES OF CENTRAL TENDENCY MEDIAN AND MODEEXERCISE - NCERT Questions (With Hints to Answers)
5 Videos
- ORGANISATION OF DATABOOK - TARUN JAIN & VK OHRICHAPTER - ORGANISATION OF DATAEXERCISE - EXERCISE NCERT
13 Videos
Similar Questions
Consider the following statements :
(i) Mean of 100 observations is 50 and standard deviation is 10. If 5 is added to each observation the new mean and standard deviation are 55, 10.
(ii) Mean of 100 observations is 50 and standard deviation is 10. If each observation is multiplied by 3 then the new mean and standard deviation are 50, 10/3.
The true statements are :
View SolutionMean and standard deviations of 10 observations are 20 and 2 respectively. If p (p≠0) is multiplied to each observation and then q (q≠0) is subtracted then new mean and standard deviation becomes half of original value . Then find q
View Solution
Knowledge Check
Let −x and M.D. be the mean and the mean deviations about −x of n observations xi,i=2……,n If each of the observation is increased by 5, then the new mean and mean deviations about the new mean, respectively are:
A−x,M.D.B−x+5,M.D.C−x,M.D.+5D−x−15,M.D.+5Mean and standard deviations of 10 observations are 20 and 2 respectively. If p (p≠0) is multiplied to each observation and then q (q≠0) is subtracted then new mean and standard deviation becomes half of original value . Then find q
A-10B-20C-5D10Let ¯¯¯X and M.D. be the mean and the mean deviation about ¯¯¯X of n observations xi∀i=1,2,3,.....,n. If each of the observations is increased by 5, then the value of new mean and the mean deviation about the new mean respectively, are
A¯¯¯X+5,M.D.B¯¯¯X+5,M.D.+5C¯¯¯X,M.D.+5D¯¯¯X,M.D.
Let ¯x and M.D be the mean and the mean deviation about ¯x of n observations xp,i=1, 2 . . . . . n . If each of the observation is increased by 5, then the new mean deviation about the new mean, respectively are .
View SolutionAn examination is taken at three centres each of the of which has 100 candidates .
The mean marks and standard devaition for the each centre are given below :

Calculate the mean and standard deviation of all 300 candidates .
View SolutionThe mean and standard deviation of 20 observations are found to be 10 and 2, respectively. One rechecking, it was found that an observation 8 was incorrect. Calculate the correct mean and standard deviation in each of the following cases. (i) If wrong item is omitted (ii) If it is replaced by 12.
View SolutionIn successive measurement, the reading of the period of oscillation of a simple pendulum were found to be 2.63s, 2.56s, 2.71s and 2.80s in an experiment. Calculate (i) mean value of the period oscillation (ii) absolute errer in each measurement (iii) mean absolute error (iv) releative error (v) percentage error and (vi) express the result in proper form.
View Solution
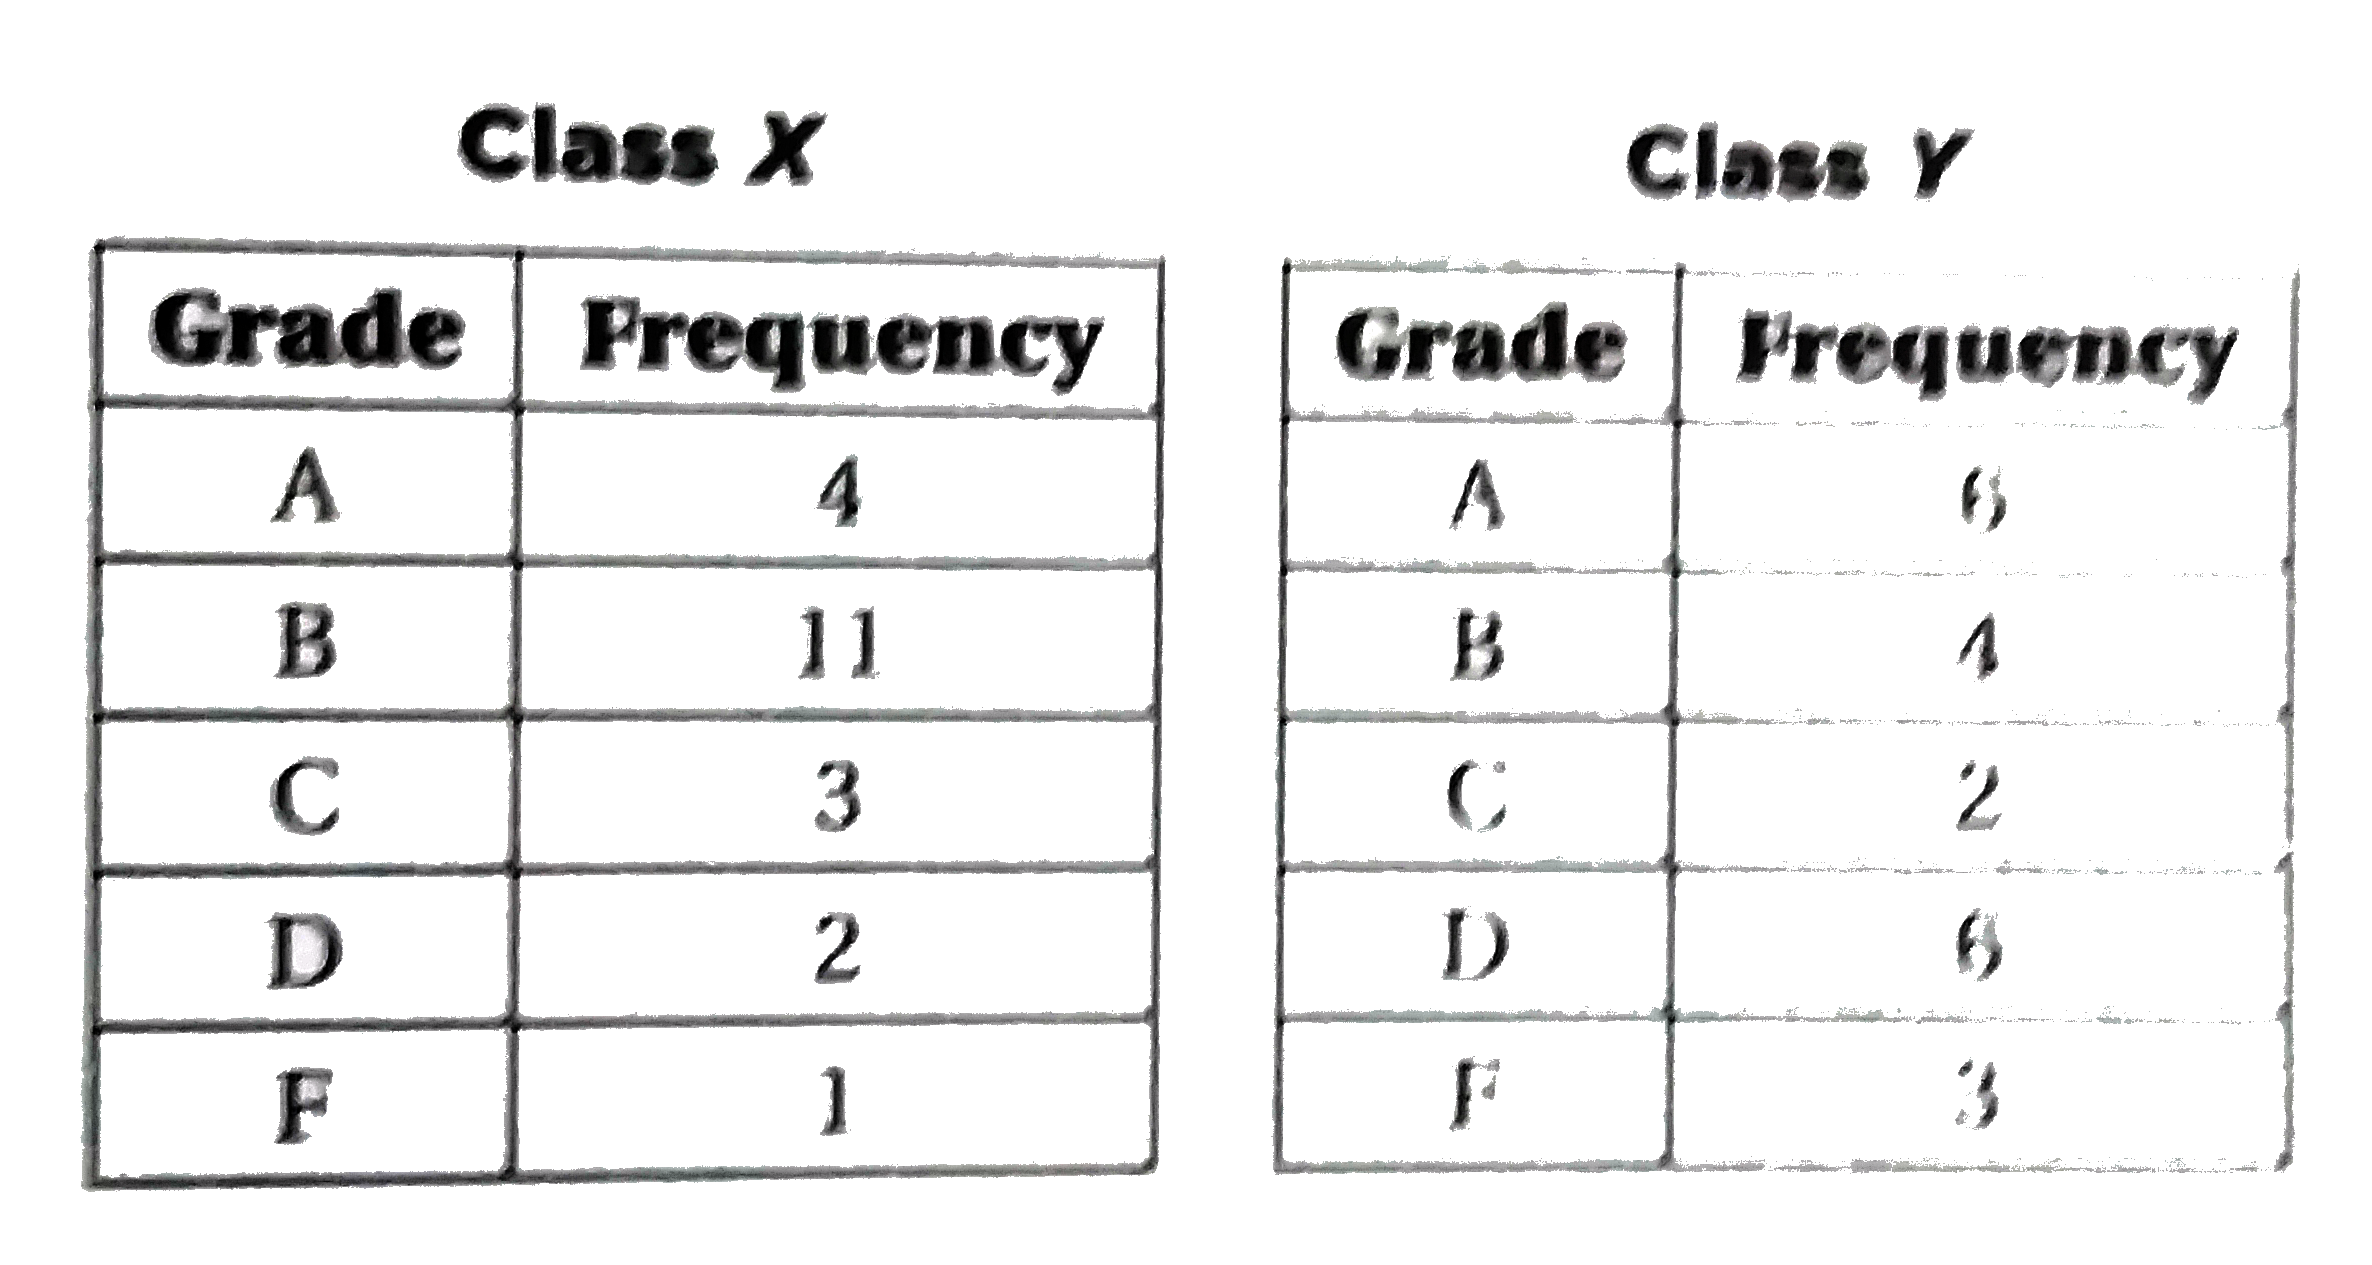
The tables give the distribution of grades for 21 students in two different college mathematics classes. For purposes of making statistical calculations, A=4,B=3,C=2,D=1,andF=0. Which of the following statements is true about the data shown for these two classes?
I. The standard deviation of grades is greater for class X.
II. the standard deviation of grades is greater for class Y.
III. The median letter grade is the same for classes X and Y.
View Solution
