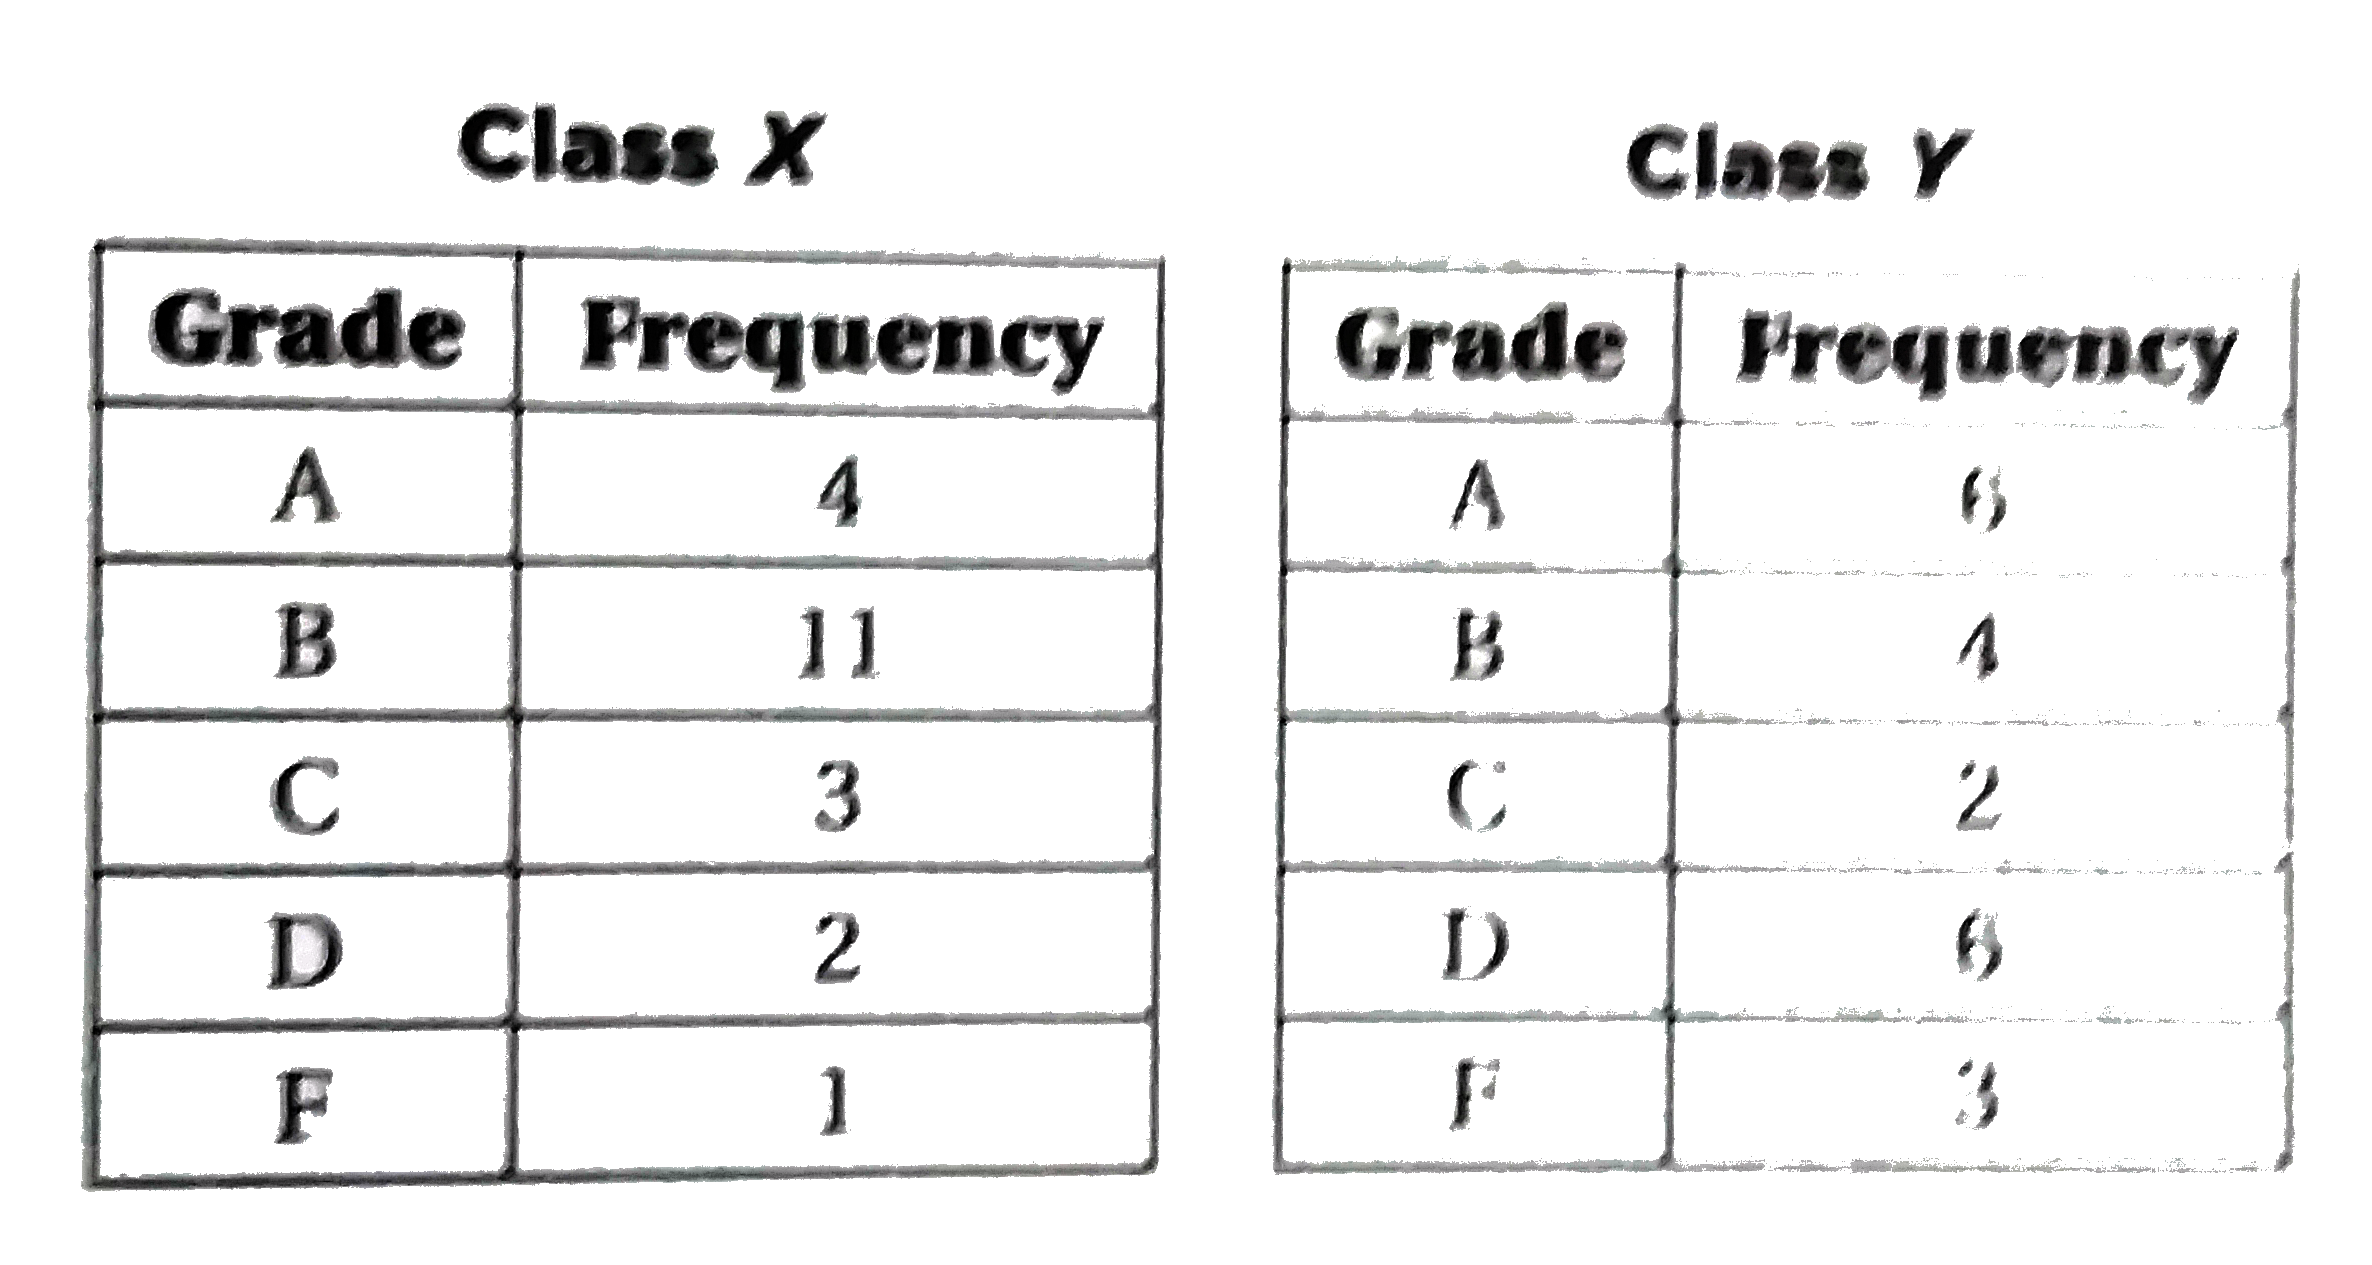
The tables give the distribution of grades for 21 students in two different college mathematics classes. For purposes of making statistical calculations, A=4,B=3,C=2,D=1,andF=0. Which of the following statements is true about the data shown for these two classes?
I. The standard deviation of grades is greater for class X.
II. the standard deviation of grades is greater for class Y.
III. The median letter grade is the same for classes X and Y.
I only
II only
I and III only
II and III only
The correct Answer is:B
Topper's Solved these Questions
- PROBLEM SOLVING AND DATA ANALYSISBOOK - ENGLISH SATCHAPTER - PROBLEM SOLVING AND DATA ANALYSISEXERCISE - Grib-In
40 Videos
- PROBLEM SOLVING AND DATA ANALYSISBOOK - ENGLISH SATCHAPTER - PROBLEM SOLVING AND DATA ANALYSISEXERCISE - Grib-In
40 Videos
- PROBLEM SOLVING AND DATA ANALYSISBOOK - ENGLISH SATCHAPTER - PROBLEM SOLVING AND DATA ANALYSISEXERCISE - EXERICSE
80 Videos
- PROBLEMS IN CONTEXT BOOK - ENGLISH SATCHAPTER - PROBLEMS IN CONTEXT EXERCISE - PRACTICE TEST
10 Videos
Similar Questions
Knowledge Check
In preparing a fifth grade class to take a standardized reading test, the teacher is best advised to
Atell the children the test is very important and they should do the best they canBmark key questions from a previous test and allow the pupils to answer themCcoach the below grade level readers as the rest of the class will do well anywayDgive the pupils practice in answering questions similar to the type that will appear in the test.
The following data gives marks obtained by 7 students of a class. Find out standard deviation of the marks.
40,42,38,44,46,48,50
View SolutionIf two random variables xandy are related by y=−3x+4 and standard deviation of x is 2 then standard deviation of y is (a) −6 (b) 6 (c) 18 (d) 3.50
View SolutionWrite the converse of the following statements: (i)If a number is even then n2 is even (ii)If you do all the exercises in the book, you get an A grade in the class.
View Solution
The test grades of the 26 students in a math class are shown in the chart above. What is the median test grade for the clsss?
View SolutionCalculate the standard deviation for the following data giving the age distribution of persons.

Calculate the mean of these differences and their standard deviation.
View SolutionThe average marks of 10 students in a class was 60 with standard deviation 4. While the average marks of other 10 students was 40 with a standard deviation 6. If all the 20 students are taken together,their standard deviation will be
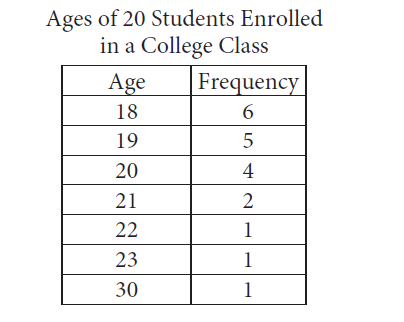
View SolutionAges of 20 Students Enrolled in a College Class

The table above shows the distribution of ages of the 20 students enrolled in a college class. Which of the following gives the correct order of the mean, median, and mode of the ages?
View Solution

