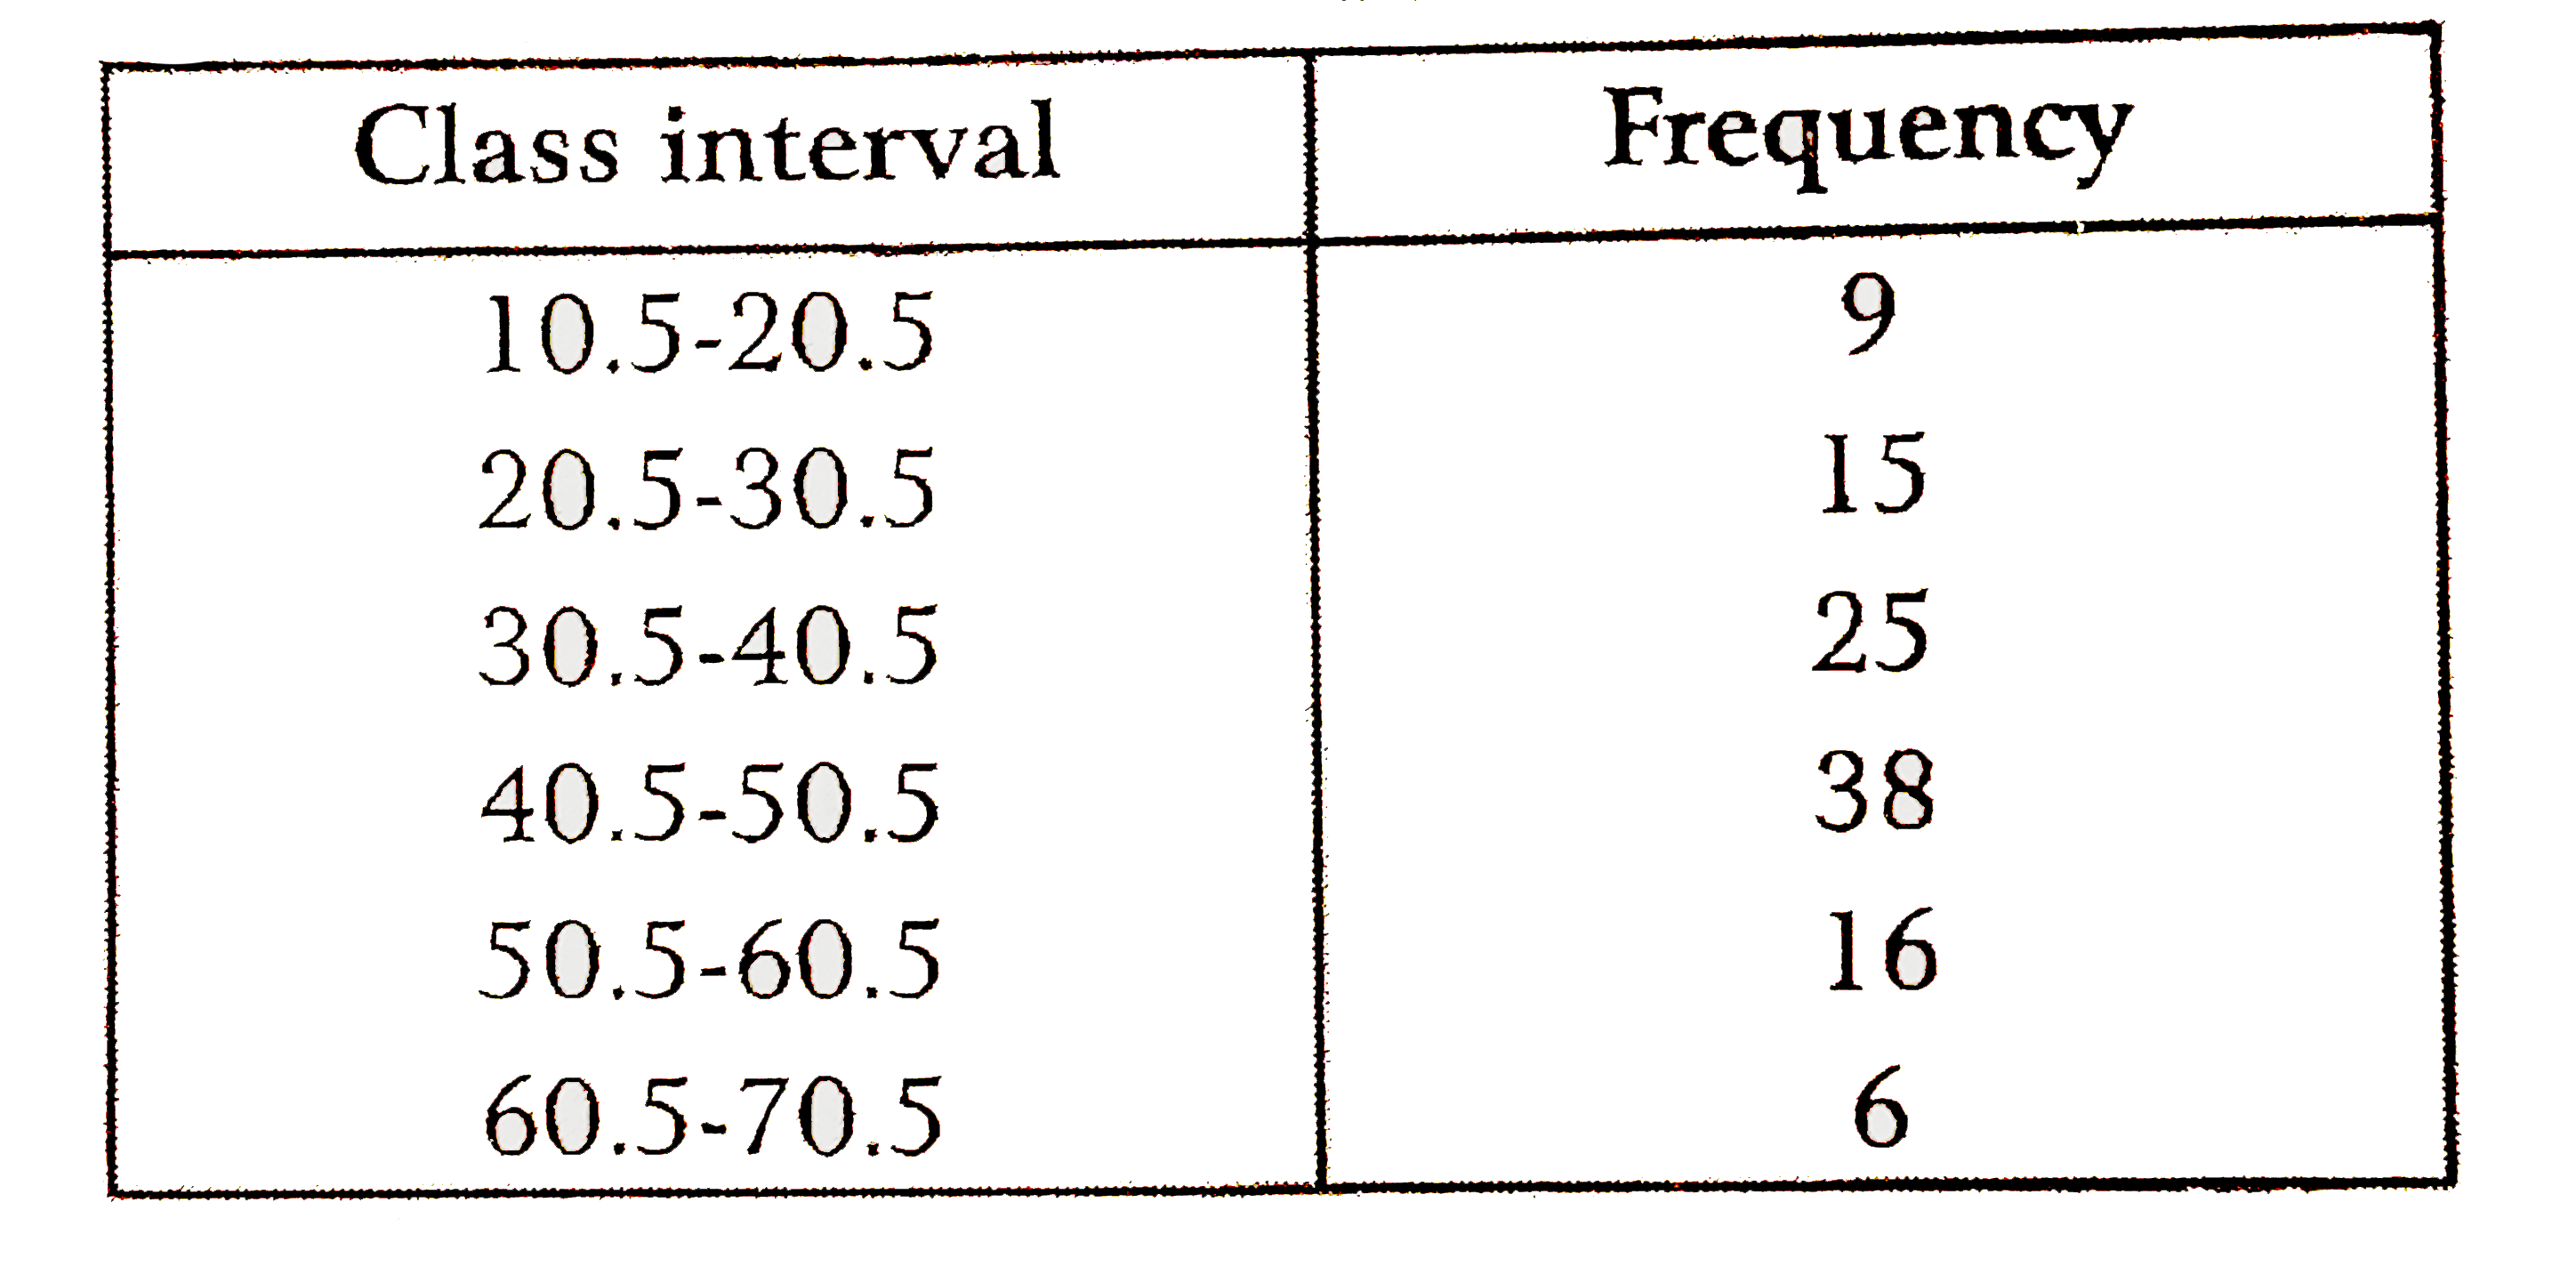
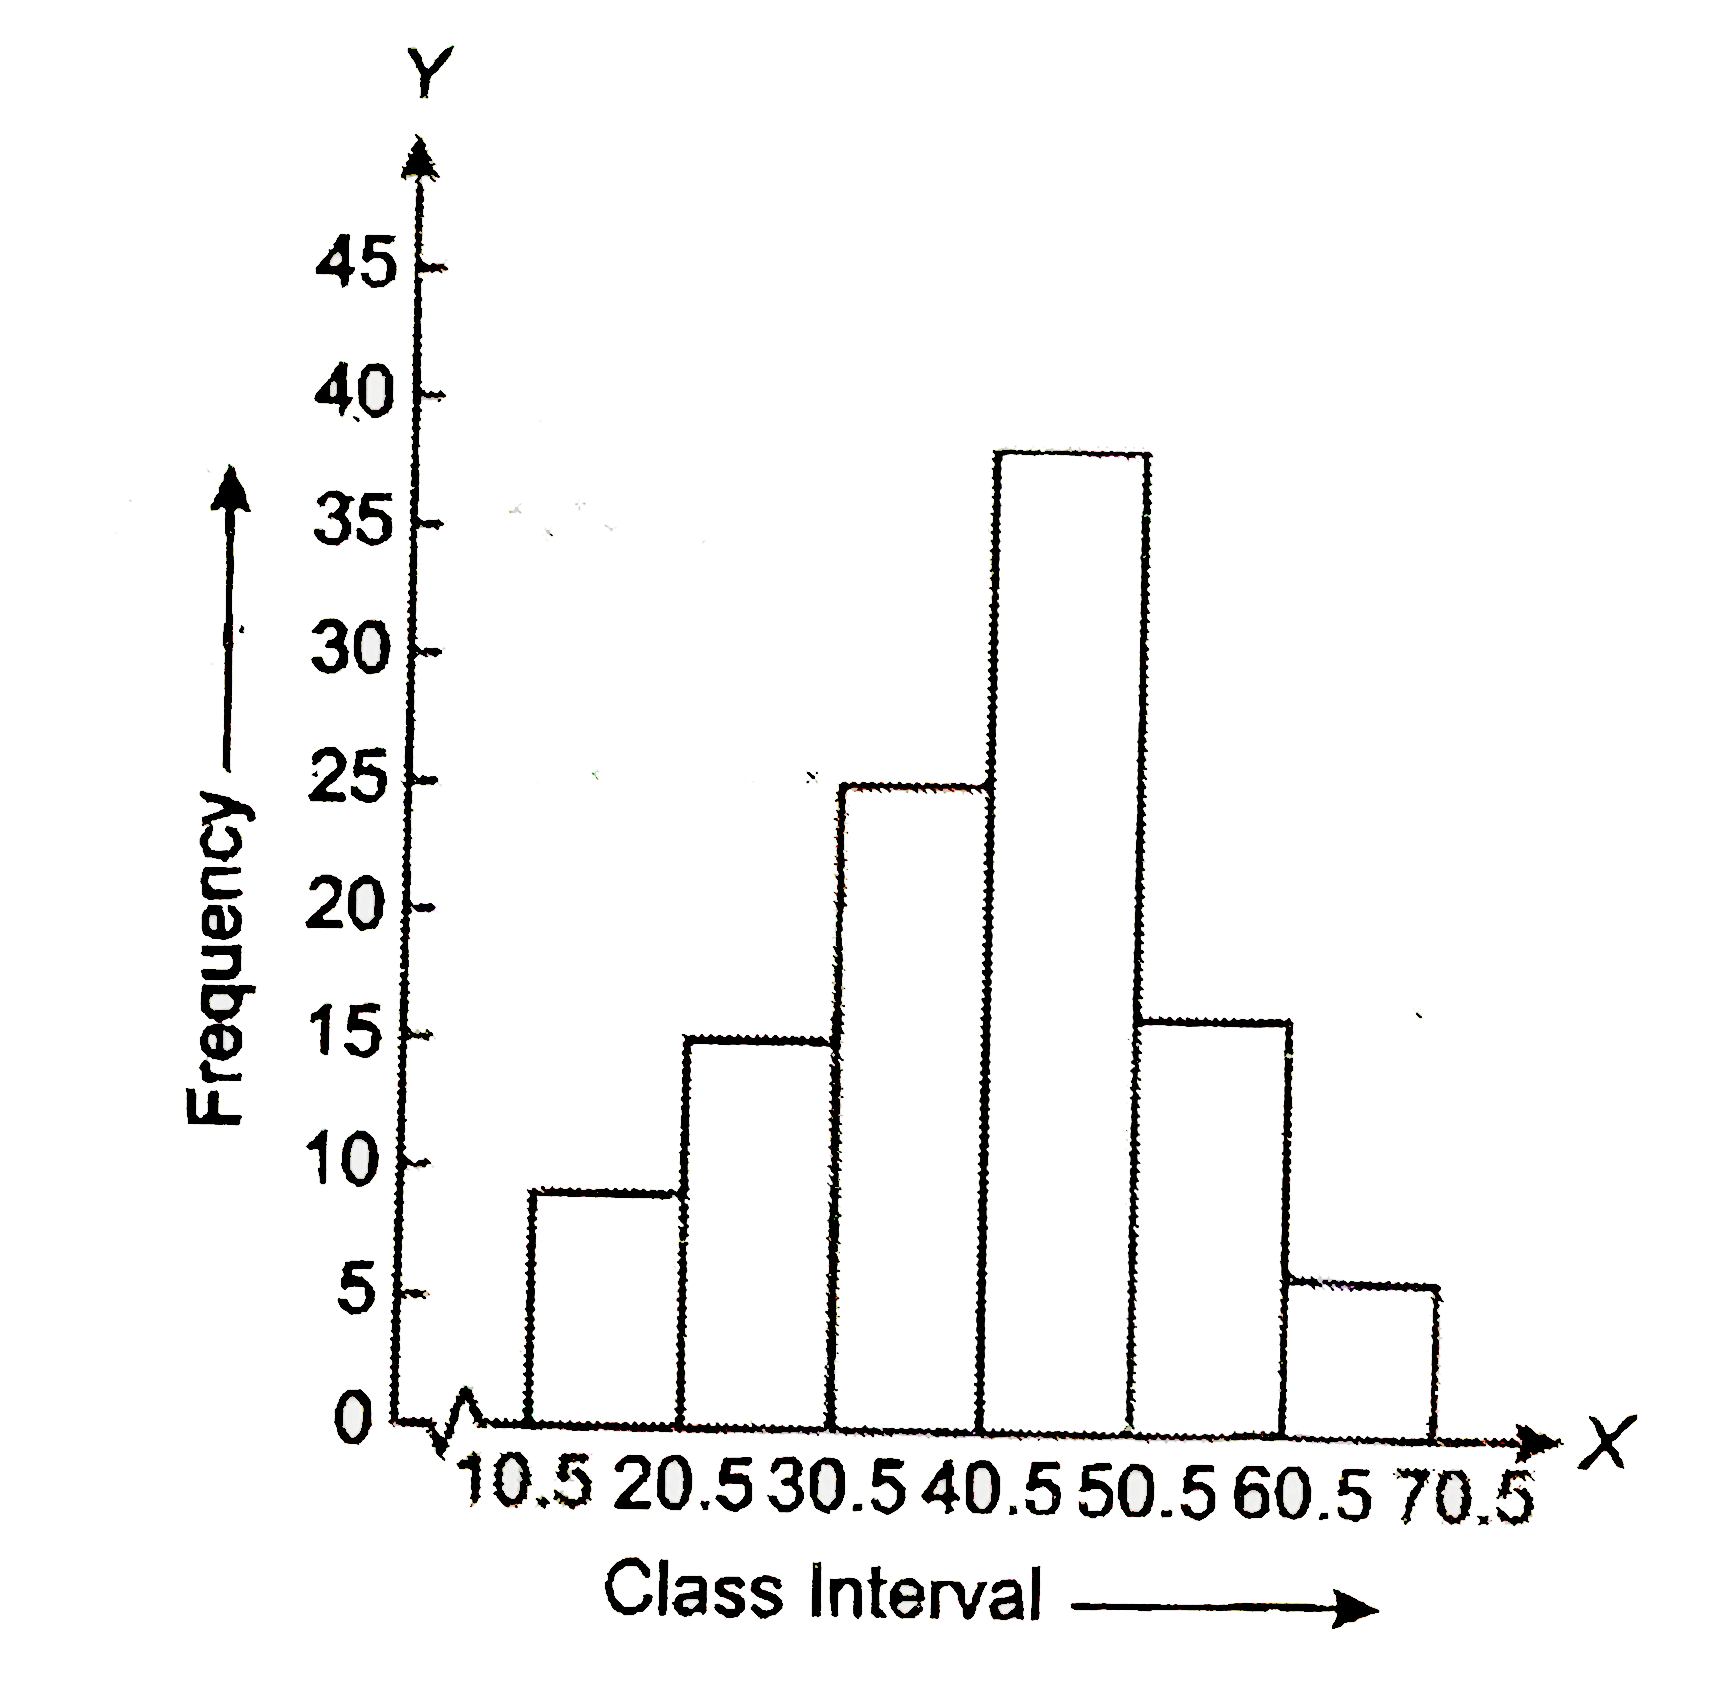
Draw a histogram from the following data:

Text Solution
Given table is in the inclusive form. First we will convert it into the exclusive form. So the frequency table in the exclusive form is as follows:

Scale : Let 1 cm = 10 units on X-axis
1 cm = 5 units on Y-axis

|
Topper's Solved these Questions
- STATISTICSBOOK - NAGEEN PRAKASHANCHAPTER - STATISTICSEXERCISE - Problems From NCERT/exemplar
22 Videos
- STATISTICSBOOK - NAGEEN PRAKASHANCHAPTER - STATISTICSEXERCISE - Exercise 14a
10 Videos
- QUADRILATERALSBOOK - NAGEEN PRAKASHANCHAPTER - QUADRILATERALSEXERCISE - Revision Exercise (long Answer Questions)
5 Videos
- SURFACE AREA AND VOLUMEBOOK - NAGEEN PRAKASHANCHAPTER - SURFACE AREA AND VOLUMEEXERCISE - Revision Exercise (long Answer Questions)
10 Videos
Similar Questions
Draw a histogram for the following data:

View SolutionDraw a histogram for the following data.

View SolutionDraw a histogram for the following data:

View SolutionDraw a histogram for the following data:

View SolutionDraw a histogram for the following data:

View SolutionDraw a histogram for the following data :

View SolutionDraw a histogram for the following data:

View SolutionDraw a histogram of the following data

View SolutionDraw a histogram of the following data.

View SolutionDraw a histogram of the following data :

View Solution
