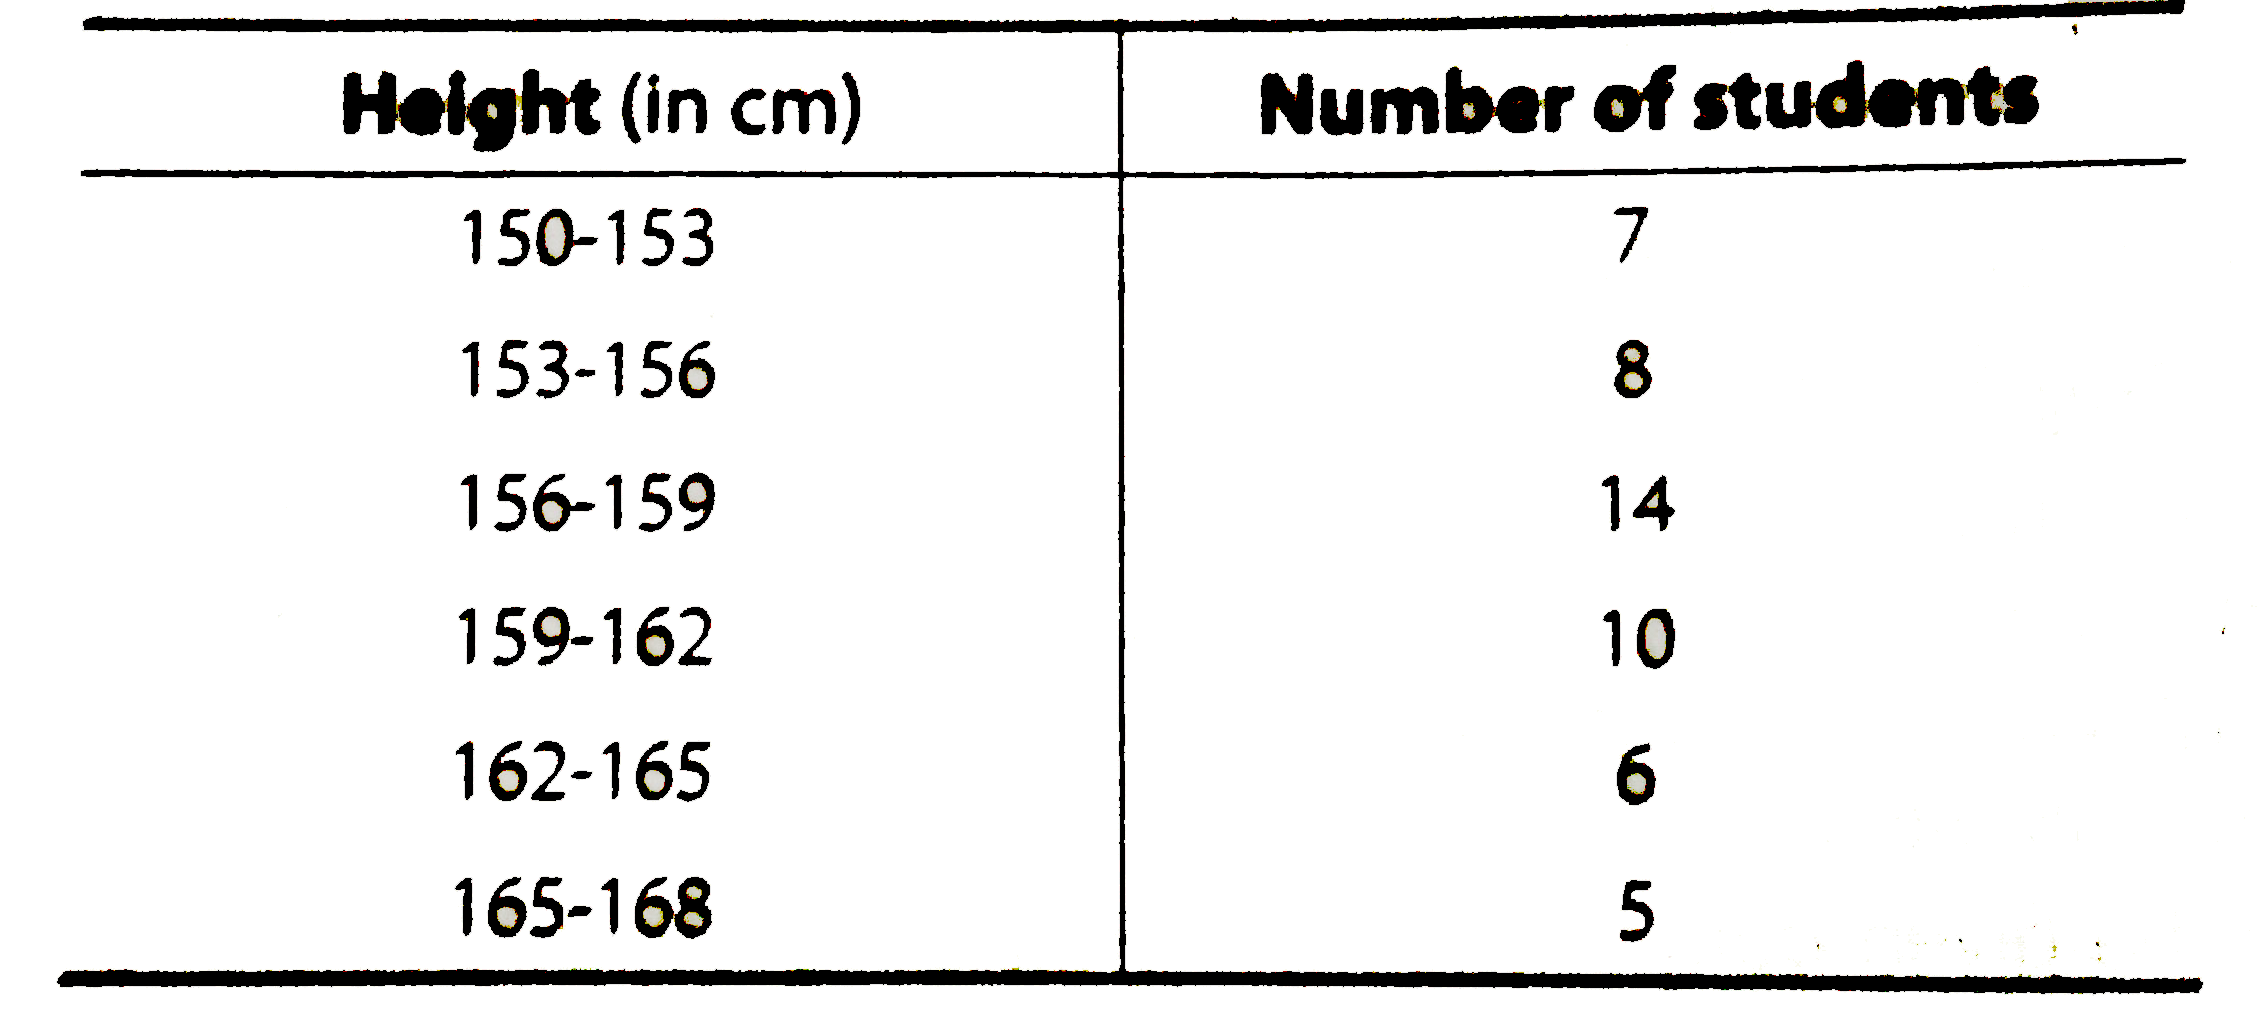
Draw a histogram for the following data :

Step by step video & image solution for Draw a histogram for the following data : by Maths experts to help you in doubts & scoring excellent marks in Class 9 exams.
Topper's Solved these Questions
- BOOK - ICSECHAPTER - STATISTICSEXERCISE - EXERCISE 18 (A)21videos
STATISTICS
- BOOK - ICSECHAPTER - STATISTICSEXERCISE - EXERCISE 18 (B)6videos
STATISTICS
- BOOK - ICSECHAPTER - SOLUTION OF RIGHT TRIANGLESEXERCISE - EXERCISE 2435videos
SOLUTION OF RIGHT TRIANGLES
- BOOK - ICSECHAPTER - STATISTICS AND GRAPH WORK EXERCISE - TOPIC - 2 (4 Marks Questions)14videos
STATISTICS AND GRAPH WORK
Similar Questions
Draw a histogram from the following data:
 View Solution
Draw a histogram of the following data: Class interval: 10-15, 15-20, 20-25, 25-30, 30-35, 35-40, Frequency: 30, 98, 80, 58, 29, 50,
View SolutionConstruct a histogram for the following data: Monthly school fee (in Rs)30−6060−9090−120120−150150−180180−210210−240No. of schools51214181094
View SolutionDraw a histogram for the following
Class interval 11−2021−3031−4041−5051−60 Frequency 5 8 13 10 6View SolutionDraw a histogram of the following distribution.
 View Solution
Draw a histogram for the following frequency distribution and find the mode from the graph :
 View Solution
Draw the histogram for the following
Class mark 2535455565 Frequency 71518128View SolutionDraw a bar graph from the following data:
 View Solution
Construct a histogram for the following distribution:
 View Solution
Draw a histogram to represent the following:

Also draw a frequency polygon with the help of histogramView Solution

