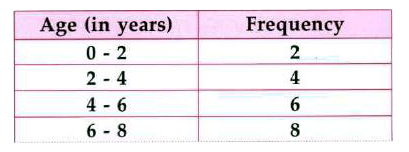
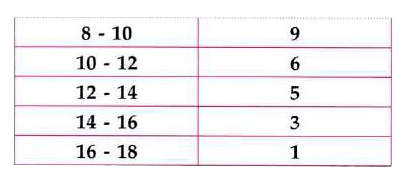
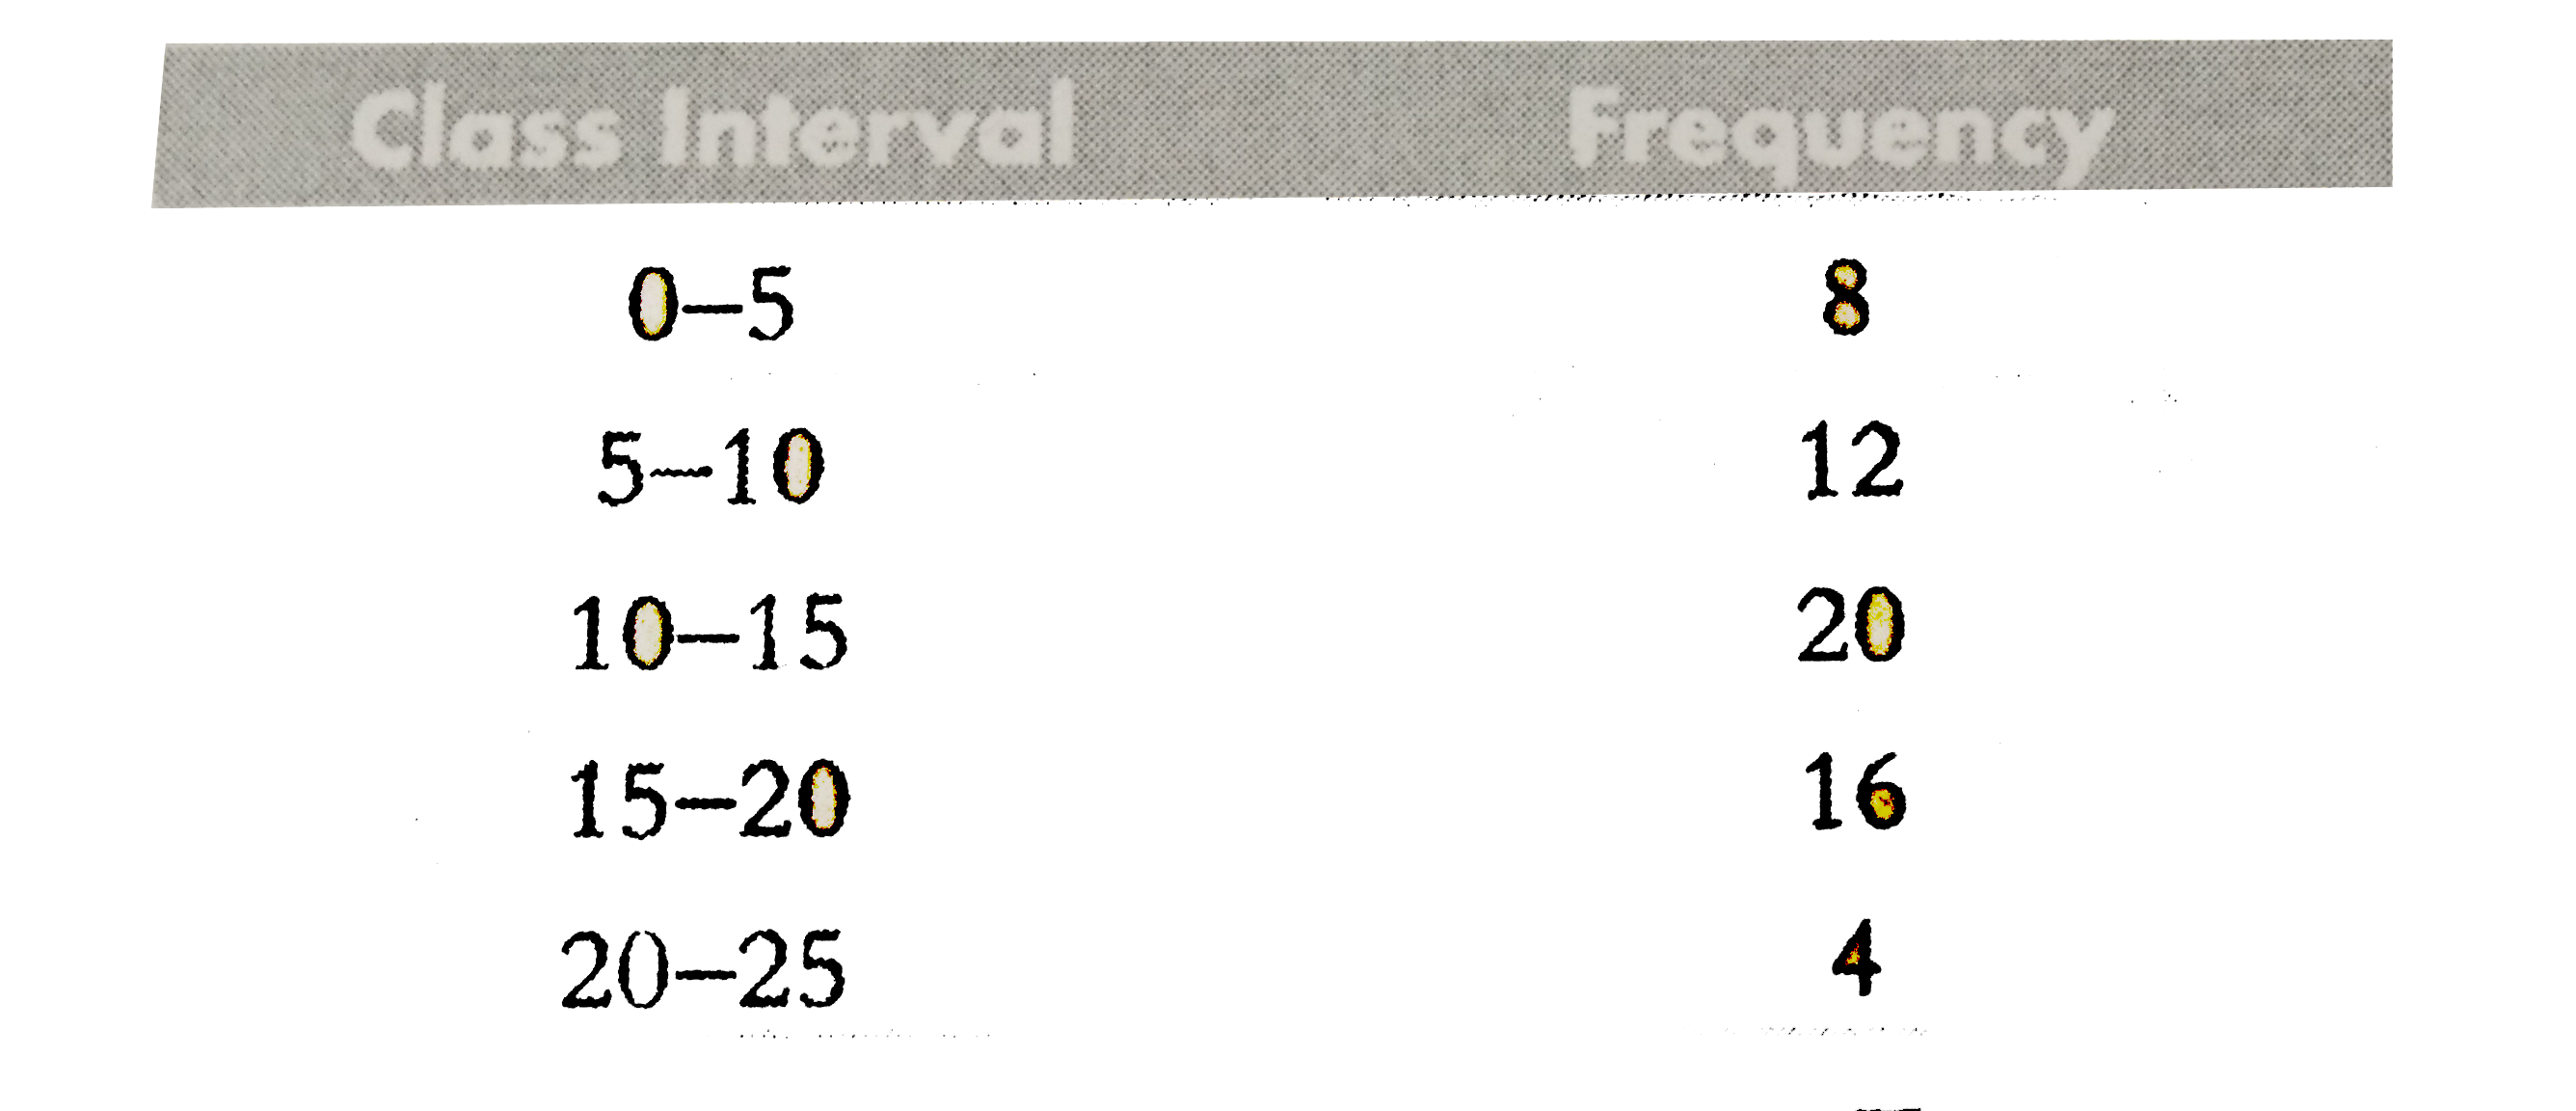
Draw a frequency polygon from the following data, giving the age of doctors working in C.G.H.S. in a city.

Text Solution

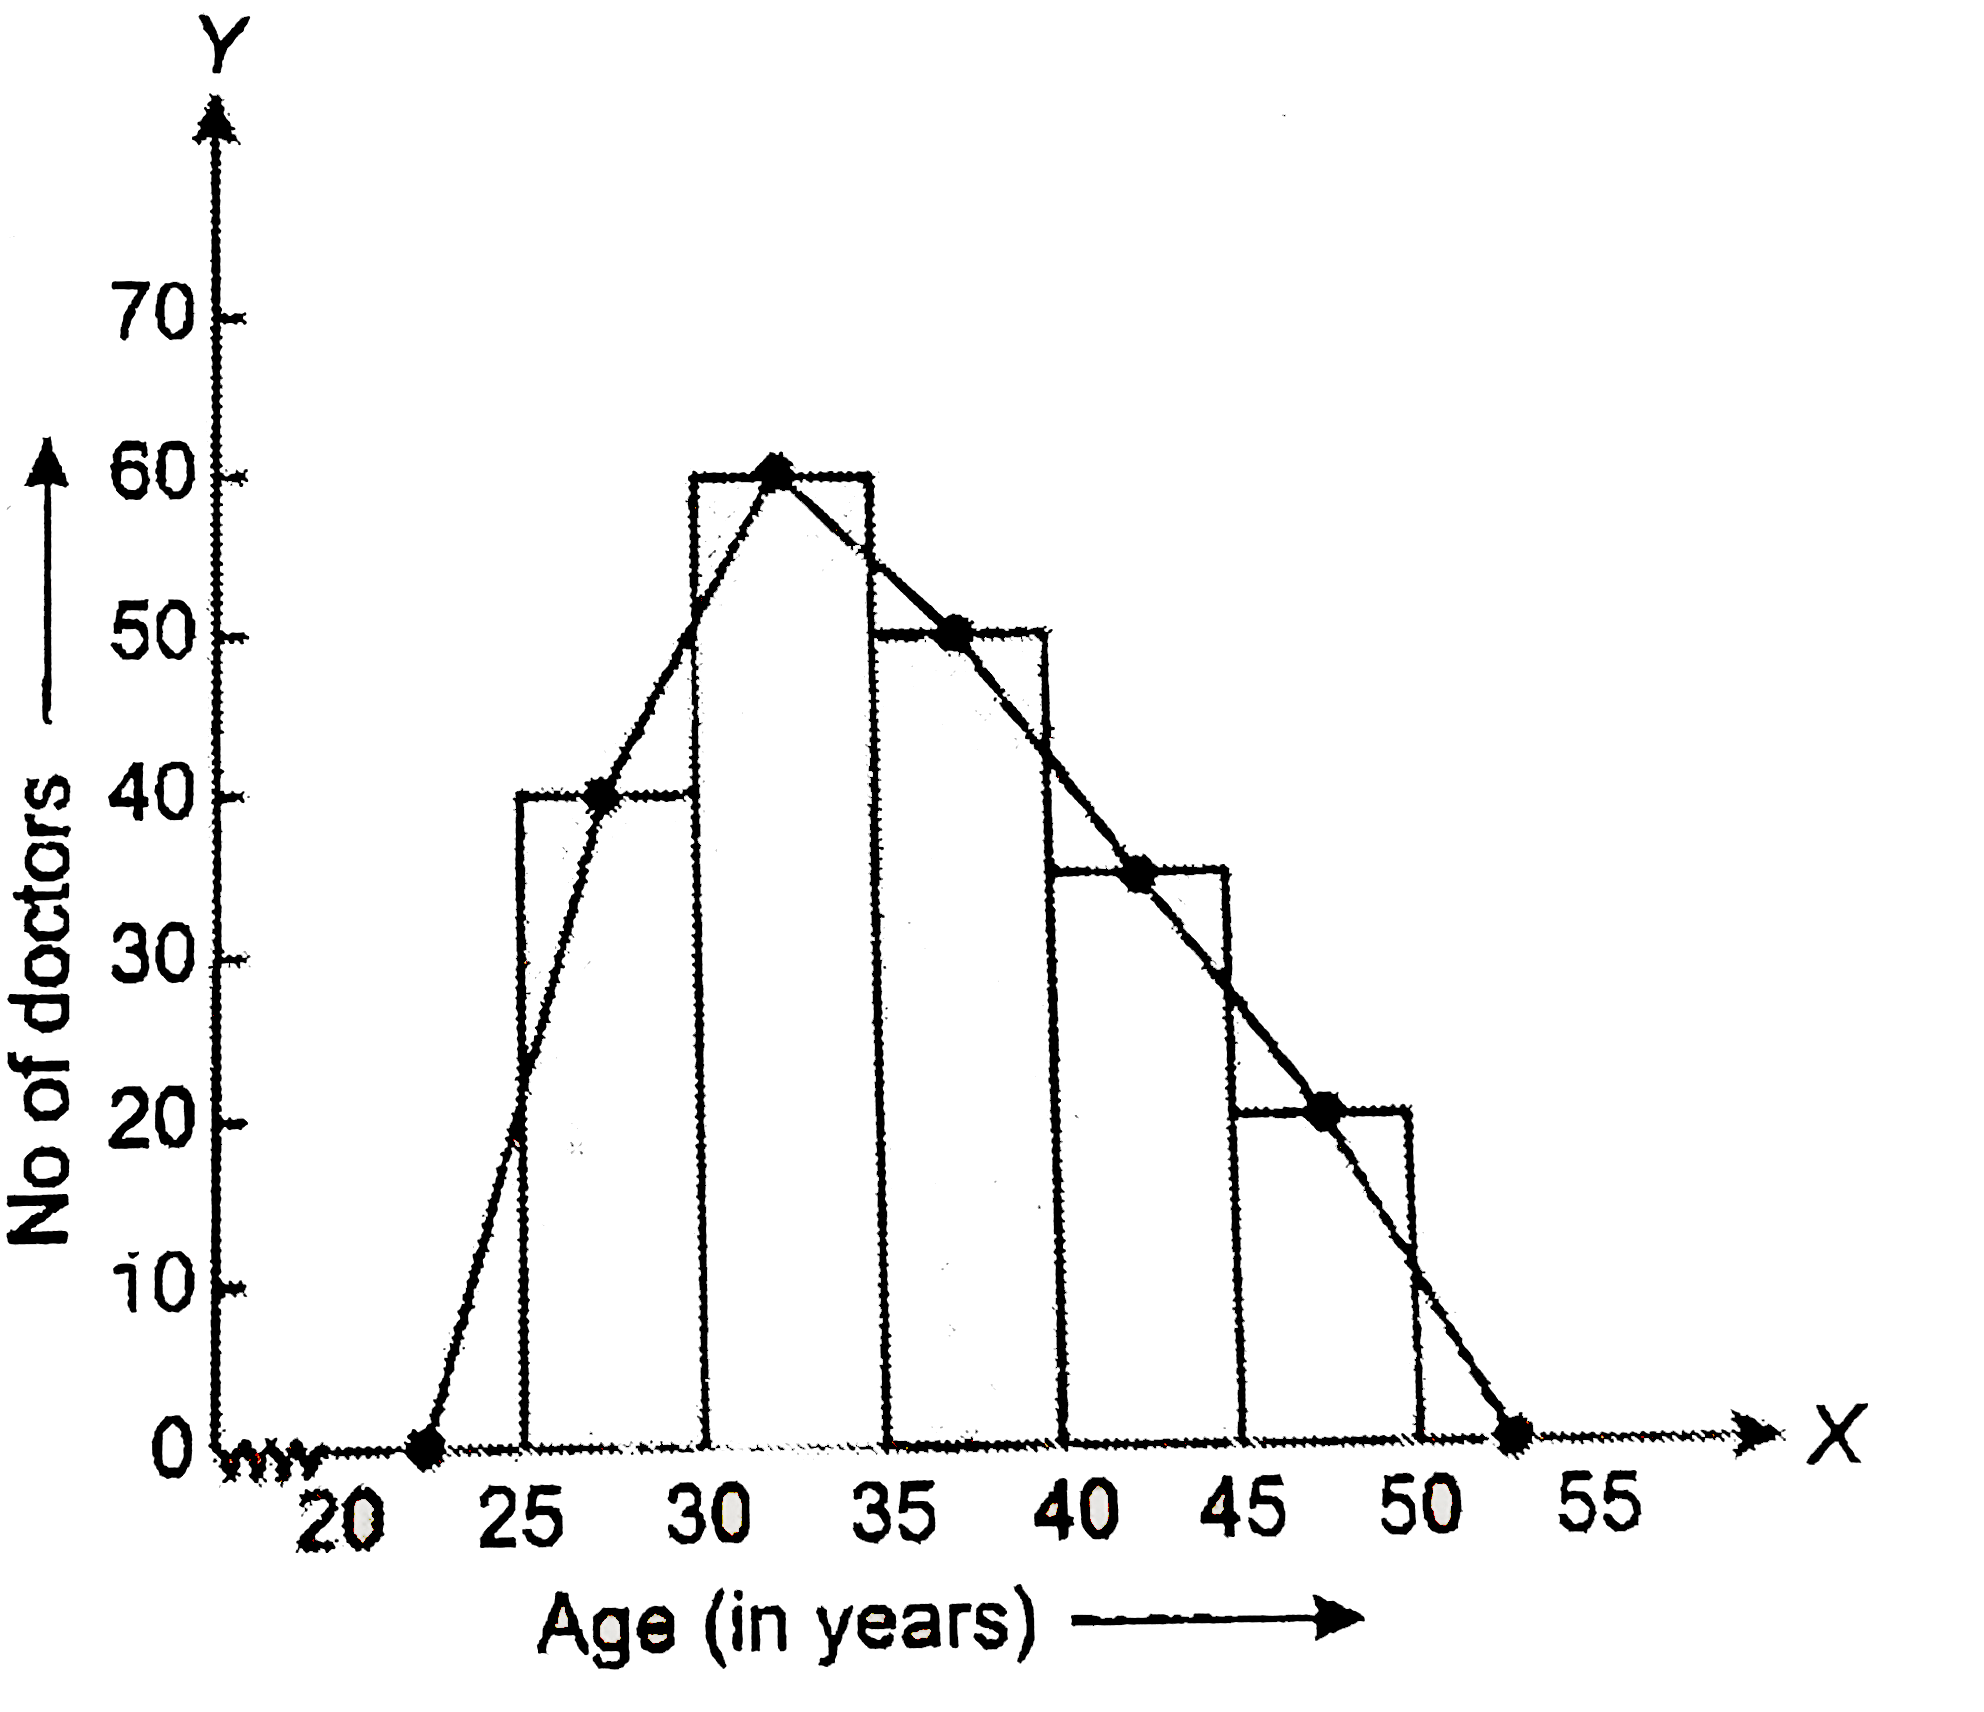
The required frequency polygon is shown in the following figure:
Steps:
1. Draw a histogram for the given data.
2. Mark the mid-point at the top of each rectangle of the histogram drawn.
3. Also, mark the mid-point of the immediately lower class-interval (in the given example, the immediately lower class-interval is (20-25) and mid-point of the immediately higher class-interval (in the given example the immediate upper class-interval is 50-55)
4. Join the consecutive mid-points marked by straight lines to obtain the required frequency polygon.
|
Topper's Solved these Questions
- STATISTICSBook:NAGEEN PRAKASHANChapter:STATISTICSExercise:Problems From NCERT/exemplar
Explore 22 Videos
- STATISTICSBook:NAGEEN PRAKASHANChapter:STATISTICSExercise:Exercise 14a
Explore 10 Videos
- QUADRILATERALSBook:NAGEEN PRAKASHANChapter:QUADRILATERALSExercise:Revision Exercise (long Answer Questions)
Explore 5 Videos
- SURFACE AREA AND VOLUMEBook:NAGEEN PRAKASHANChapter:SURFACE AREA AND VOLUMEExercise:Revision Exercise (long Answer Questions)
Explore 10 Videos
Similar Questions
Draw a frequency polygon from the following data, giving the age of doctors working in C.GH.S. in a city

View SolutionConstruct a frequency polygon for the following data:

View SolutionConstruct a frequency polygon for the following data :

View SolutionConstruct a frequency polygon for the following data.


View SolutionDraw the frequency polygon for the following distribution :

View SolutionDraw a frequency polygon to represent the following data.

View SolutionDraw a histogram and frequency polygon from the following data:

View SolutionConstruct the frequency polygon for the following data:

View SolutionDraw the frequency polygon to represent the following data.

View SolutionDraw a frequency polygon from the following frequency distribution

View Solution
