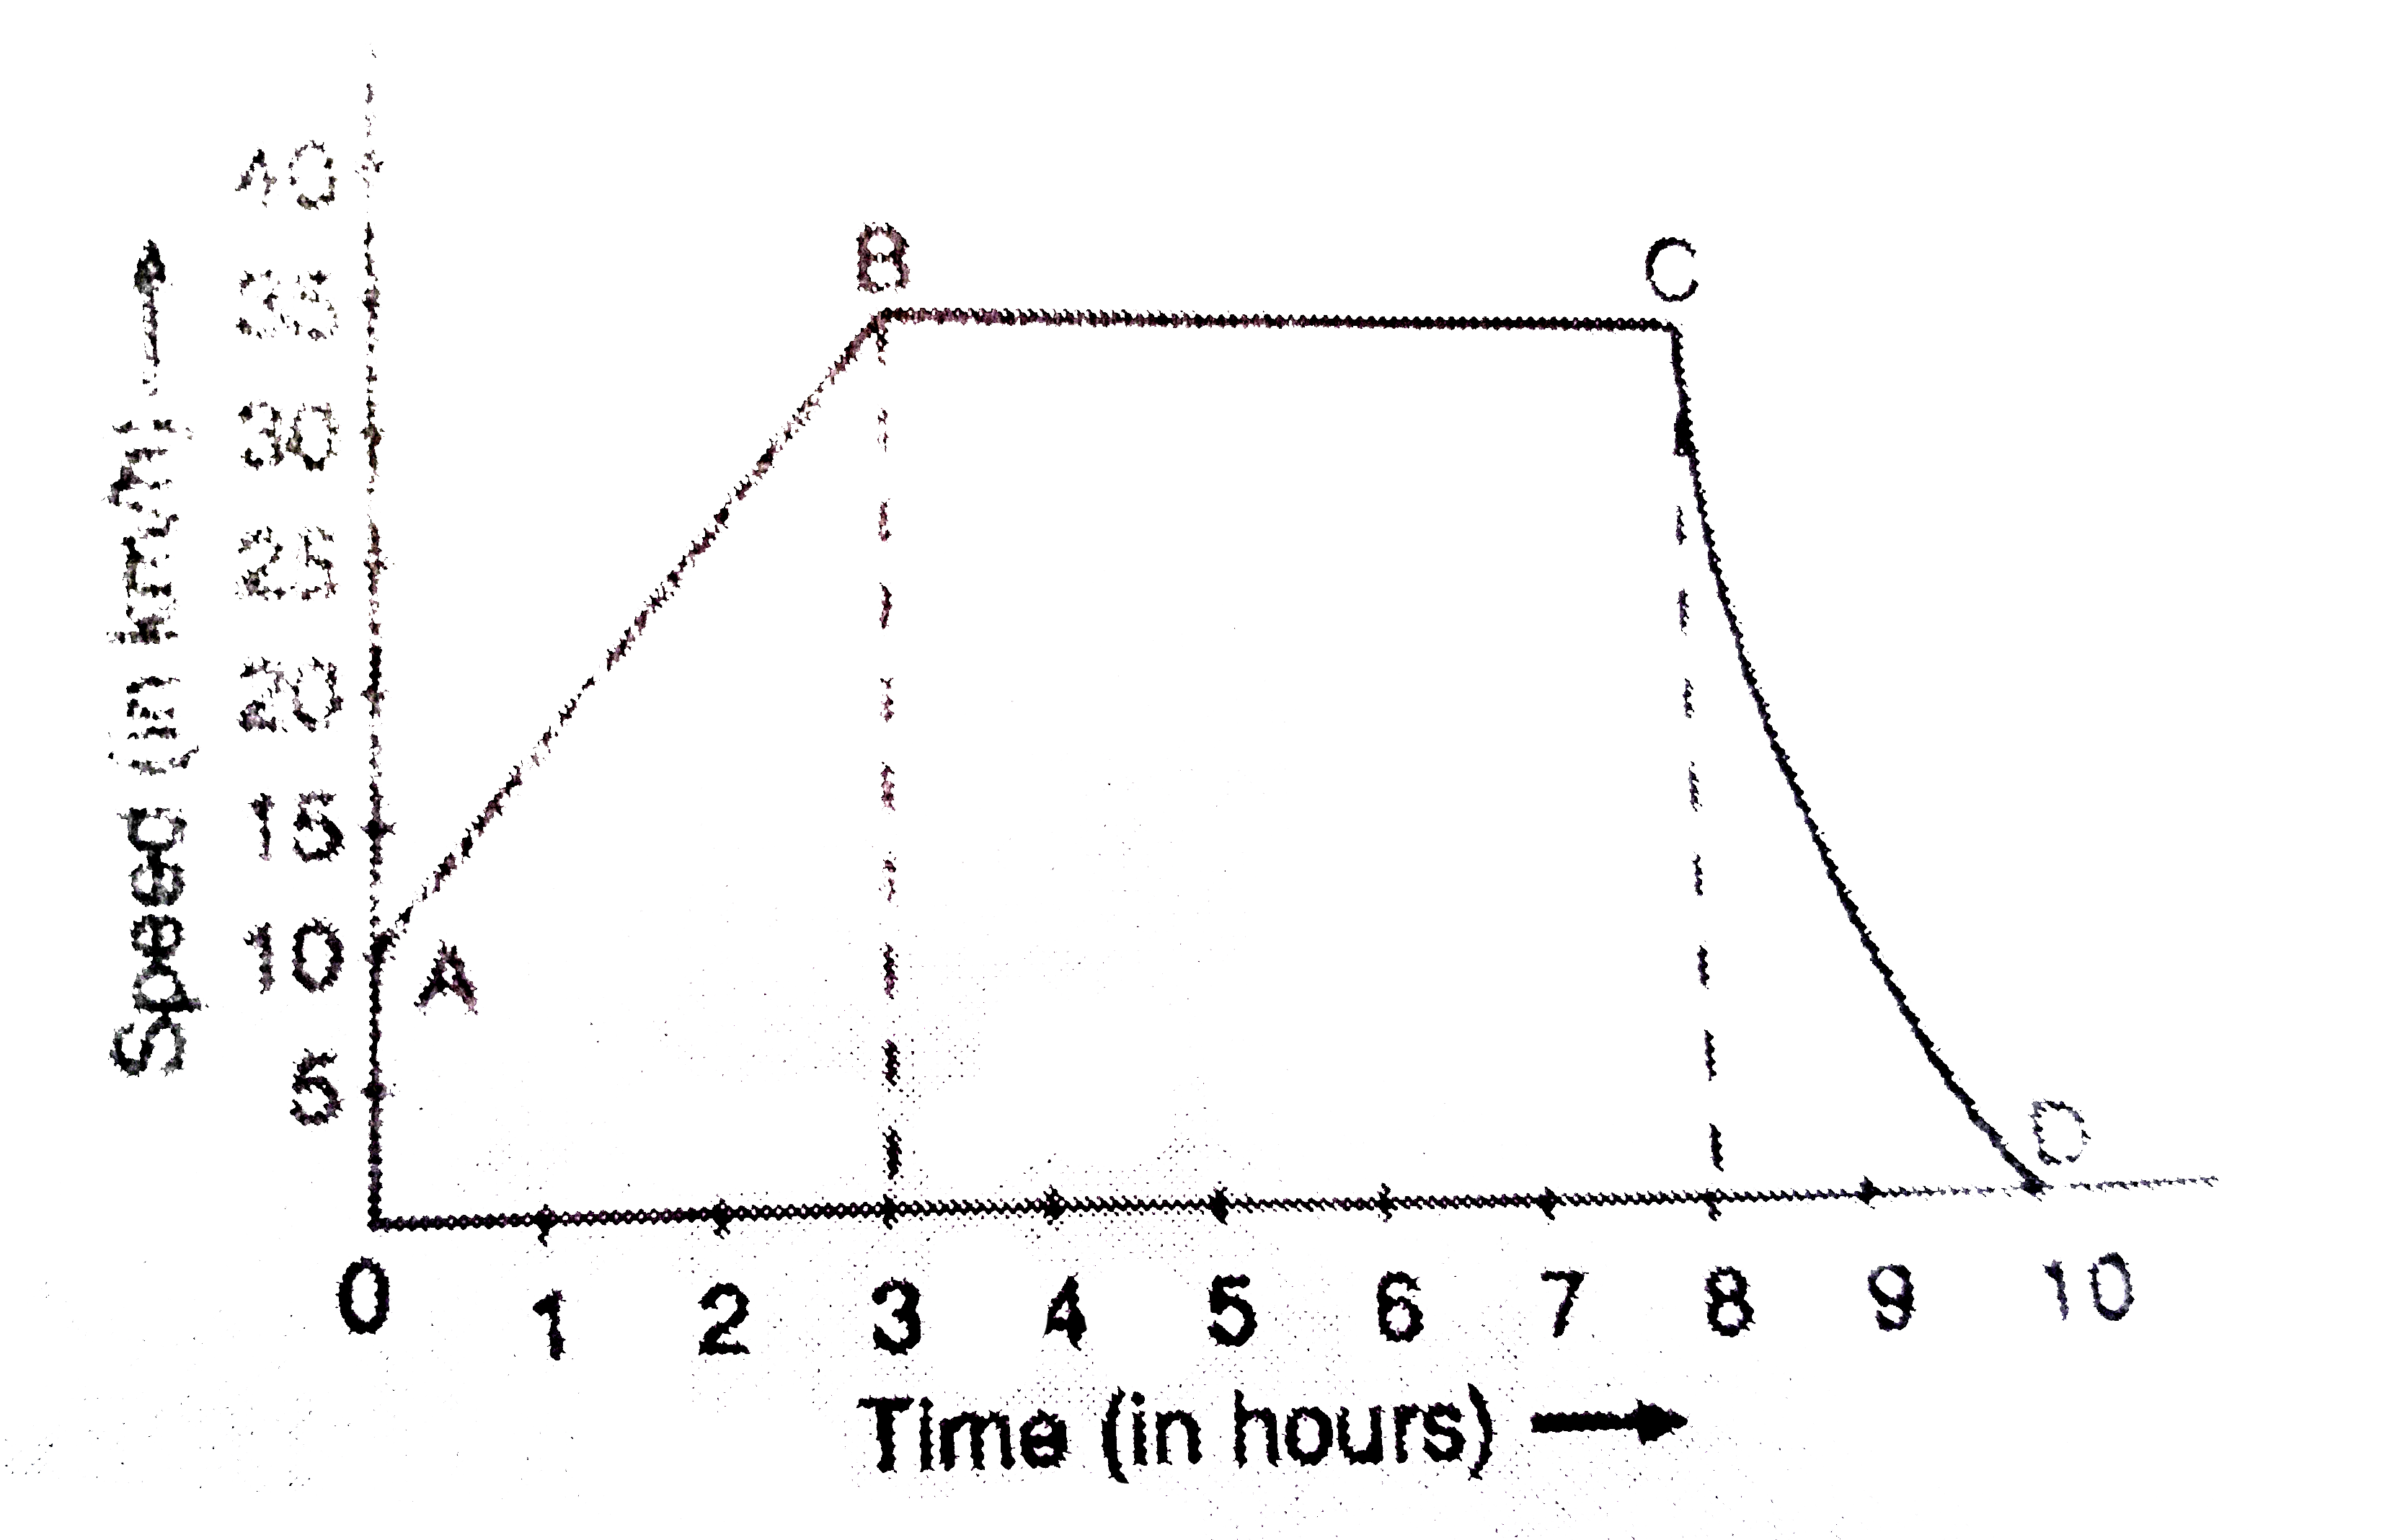
The graph given alongside shows how the speed of a car changes with time :
(i) What is the initial speed of the car ? ltBrgt (ii) What is the maximum speed attained by the car ? ltBrgt (iii) Which part of the graph shows zero acceleration ? ltBrgt (iv) Which part of the graph shows varying retardation ?
(v) Find the distance travelled in first 8 hours.
Video Solution
Text Solution
(i) 10 km/h (ii) 35 km/h (iii) BC (iv) CD (v) 242.5 km
|
Updated on:21/07/2023
Topper's Solved these Questions
- BOOK - LAKHMIR SINGH & MANJIT KAURCHAPTER - MOTION EXERCISE - SAMPLE PROBLEM1videos
MOTION
- BOOK - LAKHMIR SINGH & MANJIT KAURCHAPTER - MOTION EXERCISE - VERY SHORT ANSWER TYPE QUESTIONS3videos
MOTION
- BOOK - LAKHMIR SINGH & MANJIT KAURCHAPTER - MODEL TEST PAPER 5EXERCISE - Section B2videos
MODEL TEST PAPER 5
- BOOK - LAKHMIR SINGH & MANJIT KAURCHAPTER - SOUNDEXERCISE - Value Based Questions20videos
SOUND
Similar Questions
Knowledge Check
- Question 1 - Select One
Which of the graph shows a particle with retardation?
A B
B C
C D
D
- Question 2 - Select One
In previous question, if the total distance covered by the car is s, the maximum speed attained by it will be :
A(2s.a1a2a1+a2)12B(2s.a1a2a1−a2)12C(s2.a1a2a1+a2)12D(s2.a1a2a1−a2)12 - Question 3 - Select One
The following graph shows the speed ofabody which is :
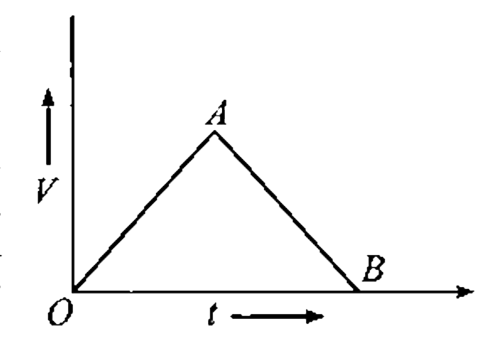 AProjected upwards with some velocity in vertical planeBHaving only constant accelerated motionCHaving only the constant retardationDA perfectly elastic ball falling from a height on a fnction less and hard floor
A car travels at a speed of 25 m/s for 8 hours. What is the distance (in km) travelled by the car?
View SolutionThe speeds of three cars are in the ratio 2:3 : 4. What is the ratio between the times taken by these cars to travel the same distance?
View SolutionA car travels at a speed of 75 m/s. for 2 hours. What is the distance (in km) travelled by the car?
View SolutionA car travels at a speed of 50 m/s. for 5 hours. What is the distance (in km) travelled by the car?
View SolutionThe graph given here shows a car following the linear path with uniform speed. Study the graph and answer the questions.
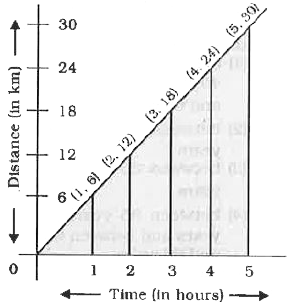
The speed of the car isView Solution


