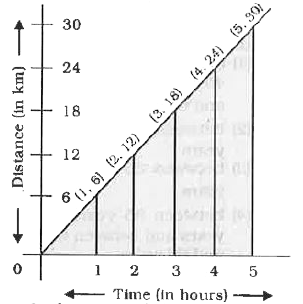
The graph given here shows a car following the linear path with uniform speed. Study the graph and answer the questions.
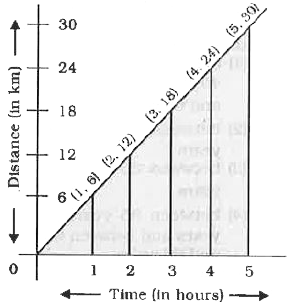
The speed of the car is
12 km/hr
6 km/hr
18 km/hr
24 km/hr
The correct Answer is:B
Step by step video, text & image solution for The graph given here shows a car following the linear path with uniform speed. Study the graph and answer the questions. The speed of the car is by Maths experts to help you in doubts & scoring excellent marks in Class 14 exams.
Topper's Solved these Questions
- BOOK - KIRAN PUBLICATIONCHAPTER - STATISTICS AND DATA INTERPRETATIONEXERCISE - TYPE-VII363videos
STATISTICS AND DATA INTERPRETATION
- BOOK - KIRAN PUBLICATIONCHAPTER - STATISTICS AND DATA INTERPRETATIONEXERCISE - TYPE-VIII8videos
STATISTICS AND DATA INTERPRETATION
- BOOK - KIRAN PUBLICATIONCHAPTER - STATISTICS AND DATA INTERPRETATIONEXERCISE - TYPE-V38videos
STATISTICS AND DATA INTERPRETATION
- BOOK - KIRAN PUBLICATIONCHAPTER - SIMPLIFICATIONEXERCISE - TEST YOURSELF25videos
SIMPLIFICATION
- BOOK - KIRAN PUBLICATIONCHAPTER - TIME AND DISTANCEEXERCISE - Type -XI74videos
TIME AND DISTANCE
Similar Questions
The graph shows Income and Expenditure of a company. Study the graph and answer the questions.
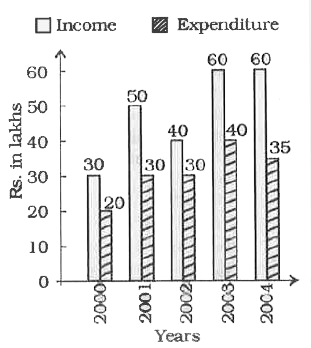
The profit was maximum in the yearView SolutionA bar graph showing the heights of six mountain peaks is given below. Study the bar graph and answer the questions.
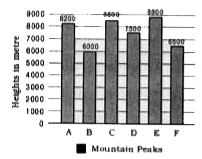
The average hight of all the peaks (in metre) isView Solution
Knowledge Check
- Question 1 - Select One
The graph given here shows a car following the linear path with uniform speed. Study the graph and answer the questions.
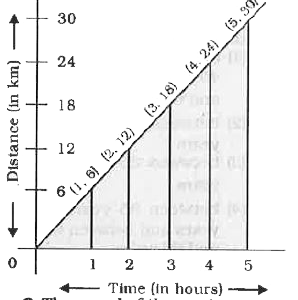
The speed of the car (in metres per minute) isA60B100C600D1000 - Question 2 - Select One
The graph given here shows a car following the linear path with uniform speed. Study the graph and answer the questions.
The car covers a distance of 15 kilometres inA3 hoursB2 hoursC1.5 hoursD2.5 hours - Question 3 - Select One
The graph given here shows a car following the linear path with uniform speed. Study the graph and answer the questions.
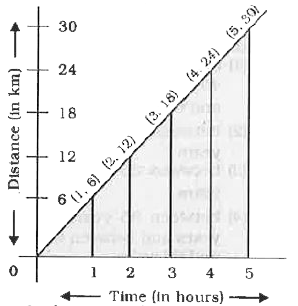
The distance travelled by the car in 4.5 hours isA27 kmB30 kmC36 kmD40 km
The graph shows Income and Expenditure of a company. Study the graph and answer the questions.
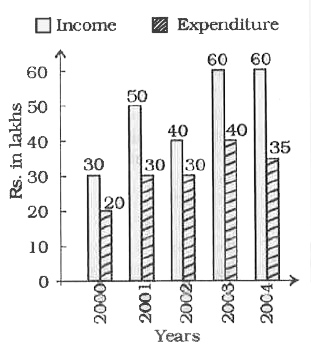
The expenditure from 2002 to 2003 increased byView SolutionThe graph shows Income and Expenditure of a company. Study the graph and answer the questions.
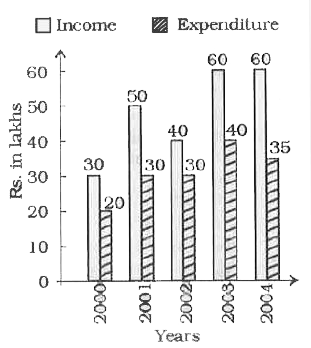
The difference in profit between 2001 and 2002 isView SolutionA bar graph showing the heights of six mountain peaks is given below. Study the bar graph and answer the questions.
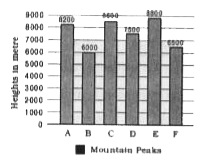
Which peak is the second highest ?View SolutionA motorist and a scooterist made a journey of 120 km at the same time and form the same place. The graph shows the progress of the journey made by each person. Study the graph and answer the questions.
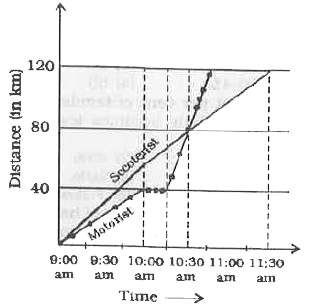
What was the speed of the scooterist during the journey ? (in kmph)View SolutionStudy the following bar graph and answer the question that follows.
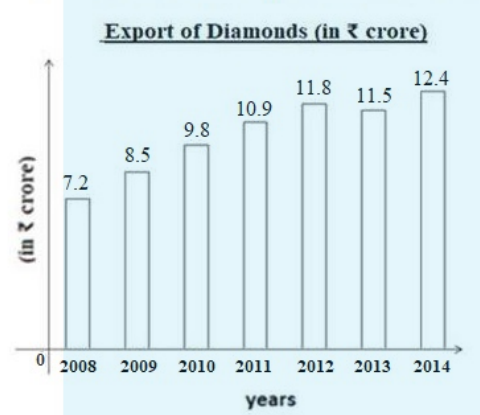
In which year was the maximin percentage increase in diamonds exports compared to the previous year?View Solution

