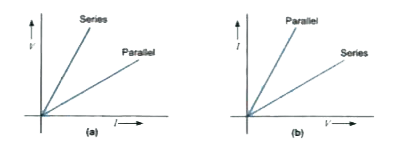
For students performed experiments on series and parallel combination of two given resistors R1and R2 which obey Ohm's law and plotted the following V-I graphs :

Which of the graphs is correctly labelled in terms of 'series' and 'parallel' ?
graph A
graph B
graph C
graph D
The correct Answer is:A
NA
Topper's Solved these Questions
- BOOK - LAKHMIR SINGH & MANJIT KAURCHAPTER - THE HUMAN EYE AND THE COLOURFUL WORLD EXERCISE - Long Answer Type Question3videos
THE HUMAN EYE AND THE COLOURFUL WORLD
- BOOK - LAKHMIR SINGH & MANJIT KAURCHAPTER - THE HUMAN EYE AND THE COLOURFUL WORLD EXERCISE - NCERT Book14videos
THE HUMAN EYE AND THE COLOURFUL WORLD
- BOOK - LAKHMIR SINGH & MANJIT KAURCHAPTER - THE HUMAN EYE AND THE COLOURFUL WORLD EXERCISE - Long Answer Type Questions2videos
THE HUMAN EYE AND THE COLOURFUL WORLD
- BOOK - LAKHMIR SINGH & MANJIT KAURCHAPTER - TEST PAPER 4EXERCISE - SECTION A10videos
TEST PAPER 4
Similar Questions
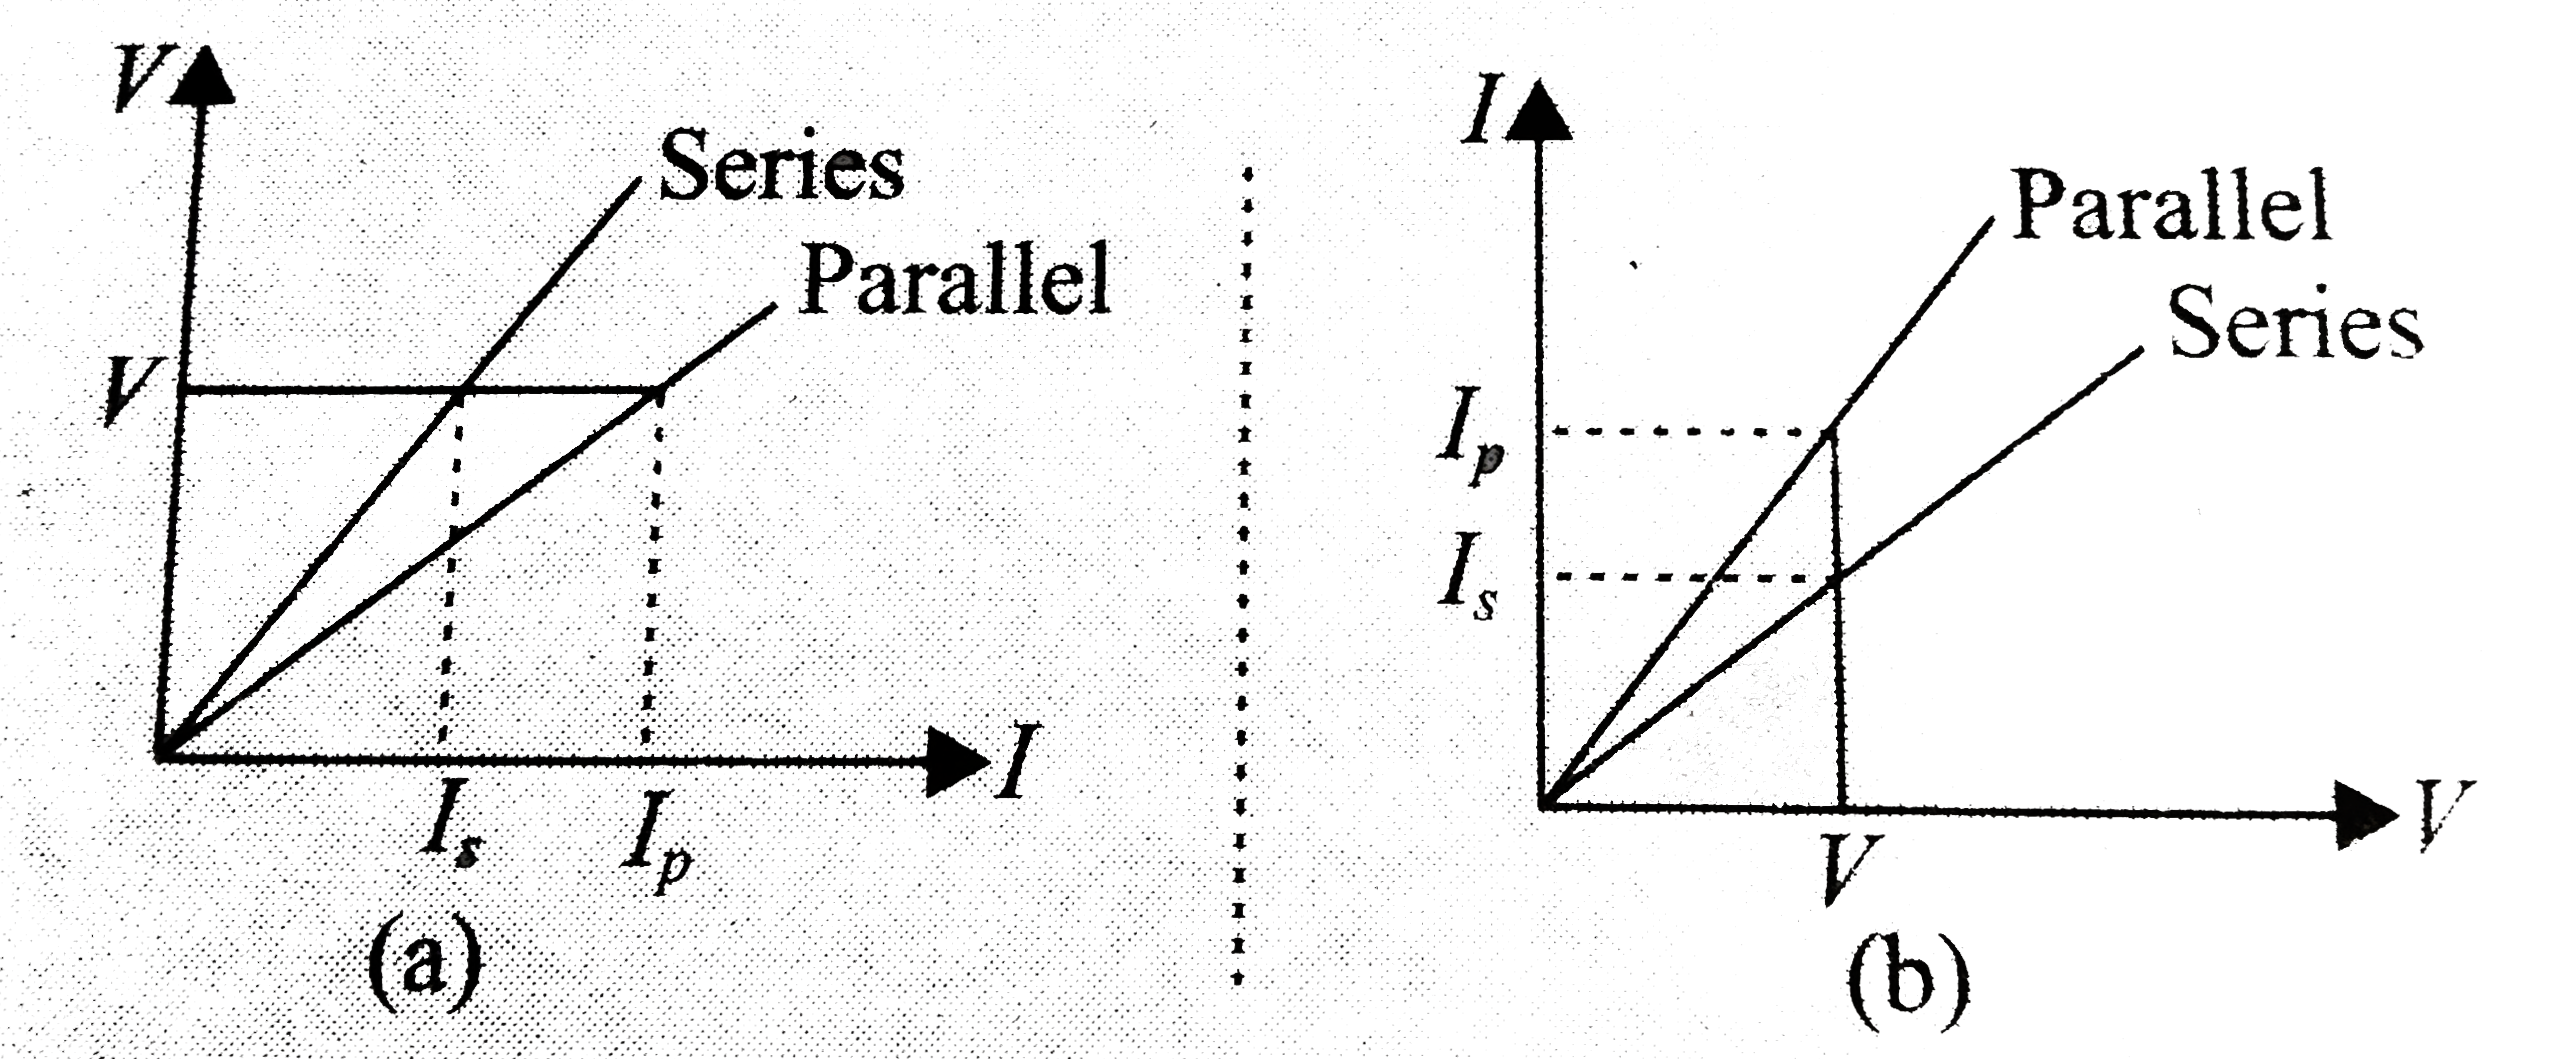
Two students perform the experiment on series and parallel combinations of two given resistors R1 and R2 and plot the following V-I graphs (a) and (b).
Which of the graphs is (are) correctly labelled in terms of the words 'series' and 'parallel'? Justify your answer.
 View Solution
Two students perform experiments on series and parallel combinations of two given resistors R1andR1 and plot the following V -1 graphs [Fig. 5.24.]. Which of the graphs is/are correctly labeled in terms of the words 'series' and 'parallel'? Justify your answer.
 View Solution
Knowledge Check
- Question 1 - Select One or More
In parallel combination, the effective resistance (of R1 and R2) is given by
AR=R1R2R1+R2B1R=1R1+1R2CR=R1+R2DR=1R1+1R2 - Question 2 - Select One
Two students perform experiments on two given resistors R1andR2 and plot the following V-I graphs. If R1>R2, which of the diagrams correctly represent the situation on the plotted curves?
A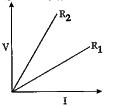 B
B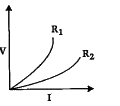 C
C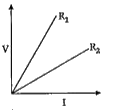 D
D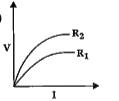
- Question 3 - Select One
Which of the following graphs represents Boyle's law correctly?
(i)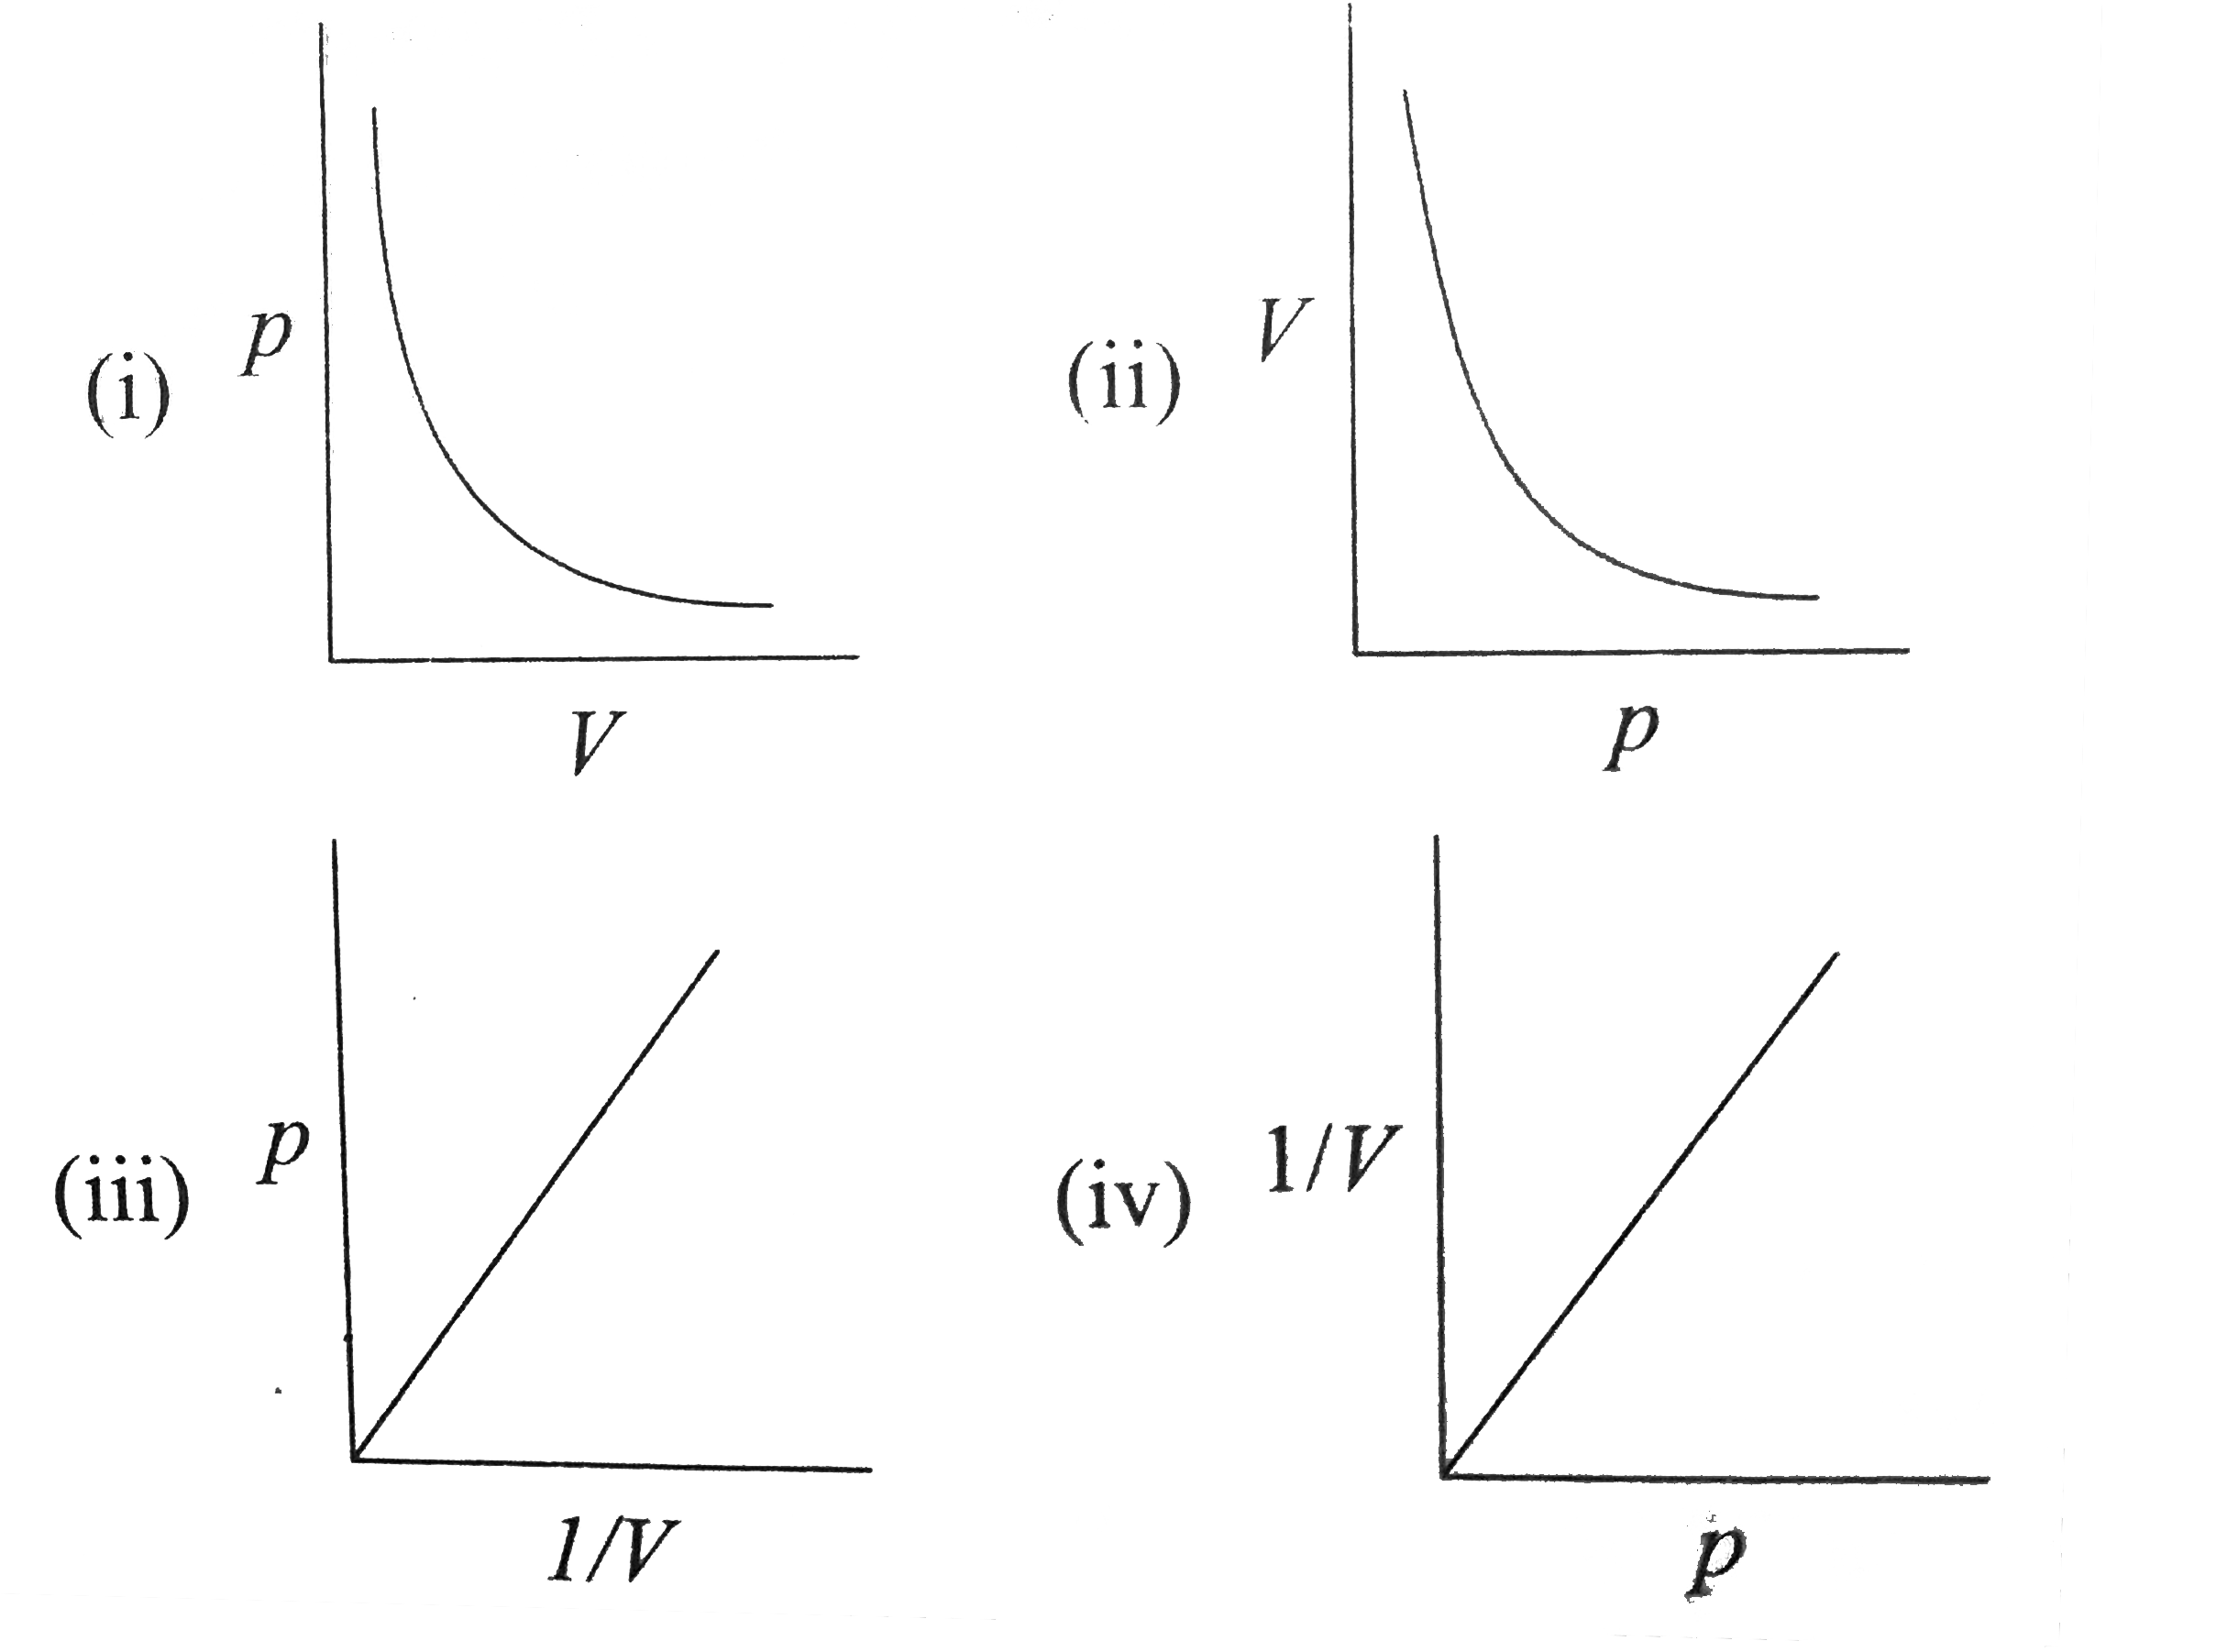 A(i),(ii),(iii),(iv)B(i),(iii)C(ii),(iv)D(ii),(iii)
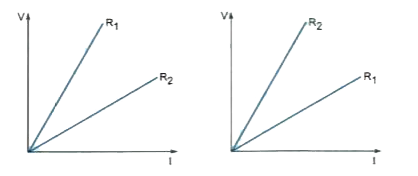
Two students perform experiments on two given resistors R1 and R2 and plot the following V-I graphs. If R1>R2 which of the two diagrams correctly represent the situation on the plotted curves? Justify your answer.
 View Solution
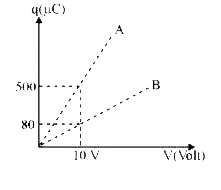
Figure shows charge (q) versus voltage (V) graph for series and parallel combination to two given capacitors. The capacitances are:
 View Solution
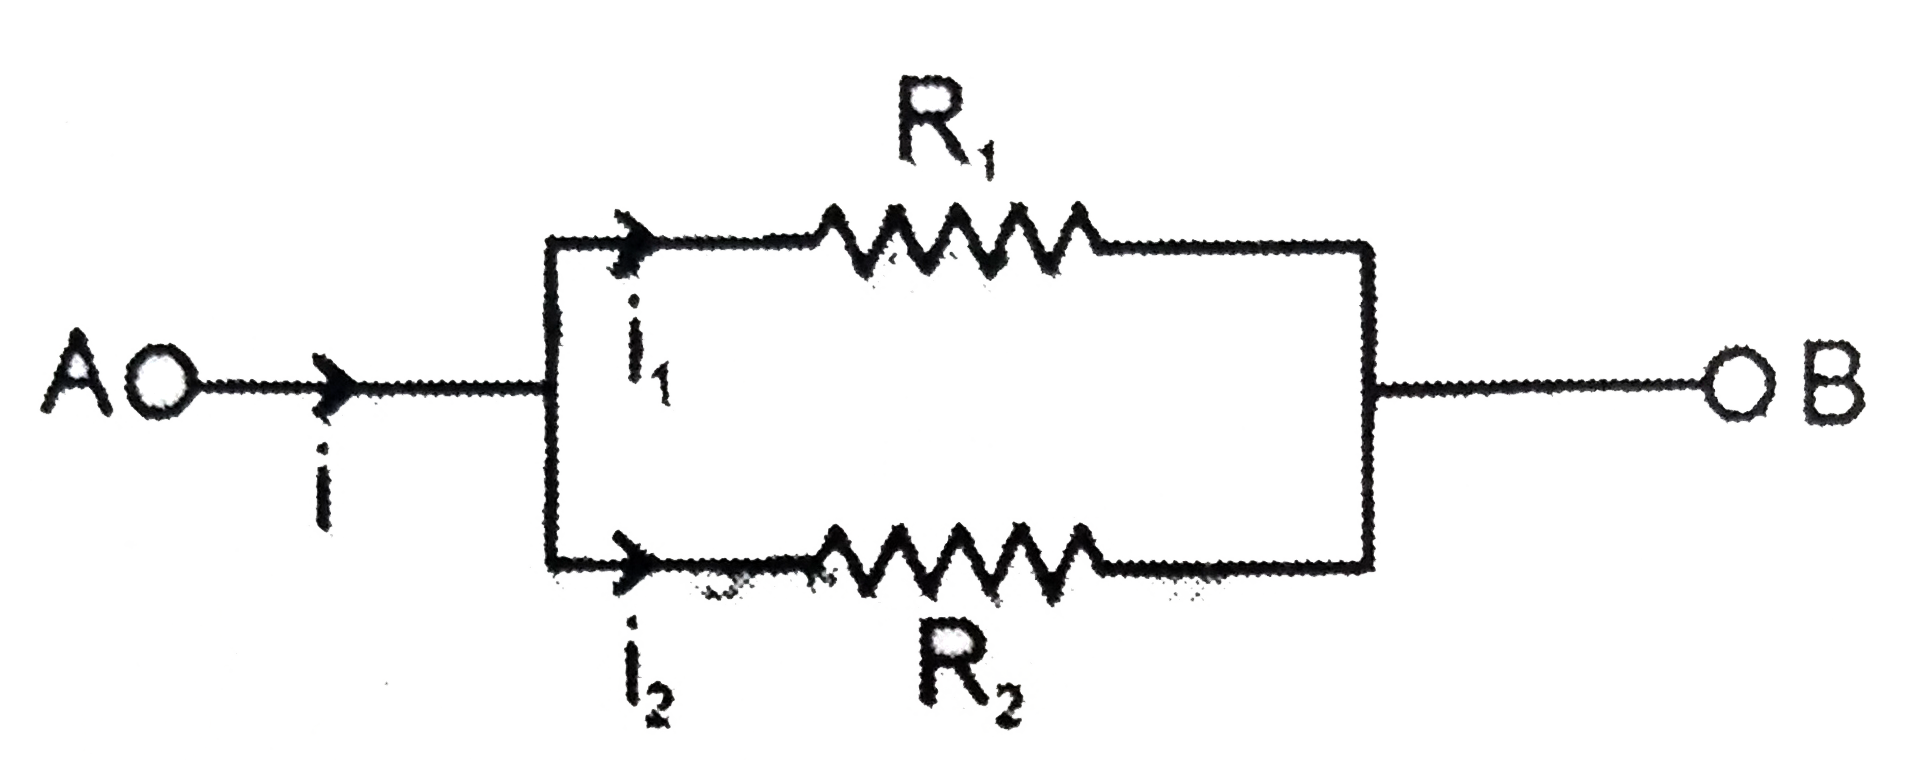
When two resistors are in parallel combination then determine i1 and i2 if the combination carries a current I ?
 View Solution
A (i) series (ii) parallel combination of two given resistors is connected one by one across a cell. In which case will the terminal potential difference across the cell have higher value?
View SolutionA student did the experiment to find the equivalent resistance of two given resistors, R1 and R2 first when they are connected in series and next when they are connected in parallel. The two values of the equivalent resistance obtained by him were Rs and Rp respectively. Compare Rs and Rp.
View Solution

