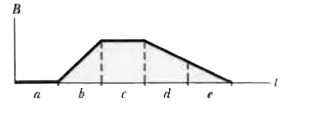
Figure shows a graph between the magnitude of magnetic field passing normally through a closed loop and time t. Rank the five region's of the graph according to the emf in magnitude indụced in the loop, greatest first.

AB>CD=DE>BC=OA
Similar Questions
The graph gives the magnitude B(t) of a uniform magnetic field that exists throughout a conductig loop, perpendicular to the plane of the loop. Rank the five regions of the graph according to the magnitude fo the emf induced in the loop, greater first

View SolutionThe graph gives the magnitude B(t) of a uniform magnetic field that exists throughout a conducting loop, with the direction of the field perpendicular to the plane of the loop. Rank the five regions of the graph according to the magnitude of the emf induced in the loop, greatest first.
View Solution
Knowledge Check
The graph gives the magnitude B (t) of a uniform magnetic field that exists throughout a conducting loop, perpendicular to the plane of the loop. Rank the five regions of the graph according to the magnitude of the emf induced in the loop, greatest first
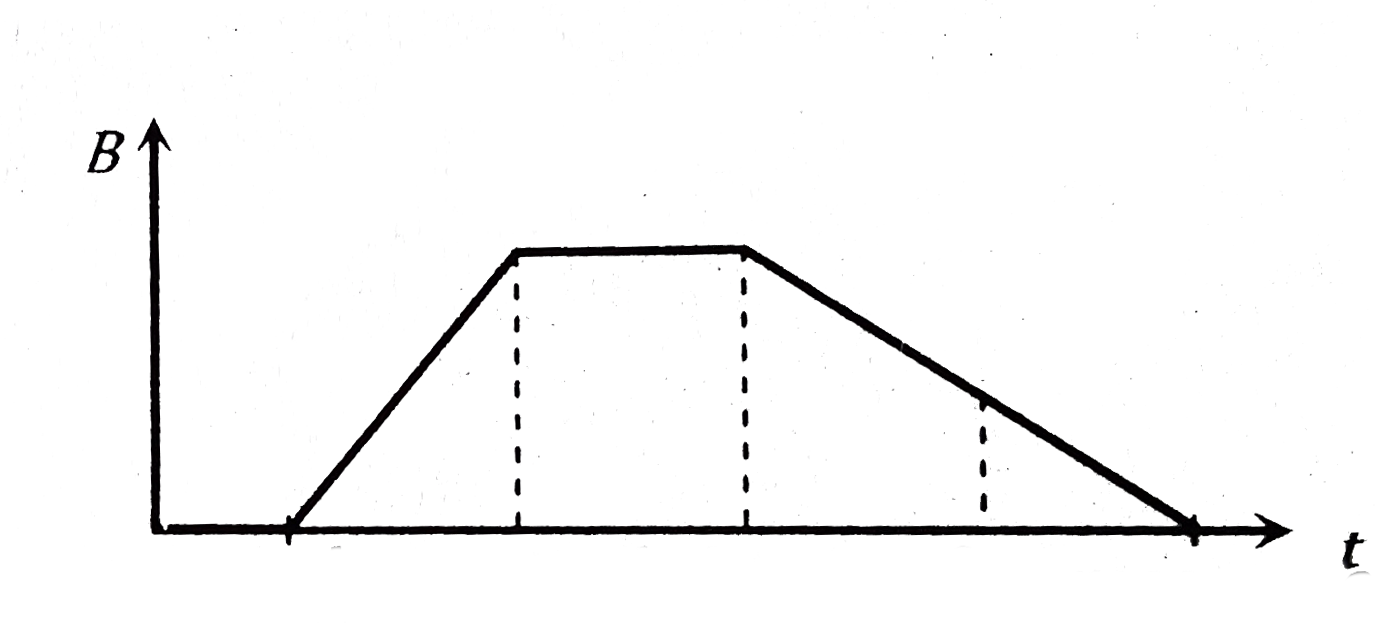 Ab>(d=e)<(a=c)Bb<(d=e)>(a=c)Cb<d<e<c<aDb>(a=c)>(d=e)
The graph gives the magnitude B(t) of a uniform magnetic field that exists throughout a conductig loop, perpendicular to the plane of the loop. Rank the five regions of the graph according to the magnitude fo the emf induced in the loop, greater first
 Ab>(d=e)<(a=c)Bb>(d=e)>(a=c)Cb<d<e<c<aDb>(a=c)>(d=e)
The figure shows four arrangement of three particles of equal masses. Rank the arrangement according to the magnitude of the net gravitational force on the particle m, greatest first.
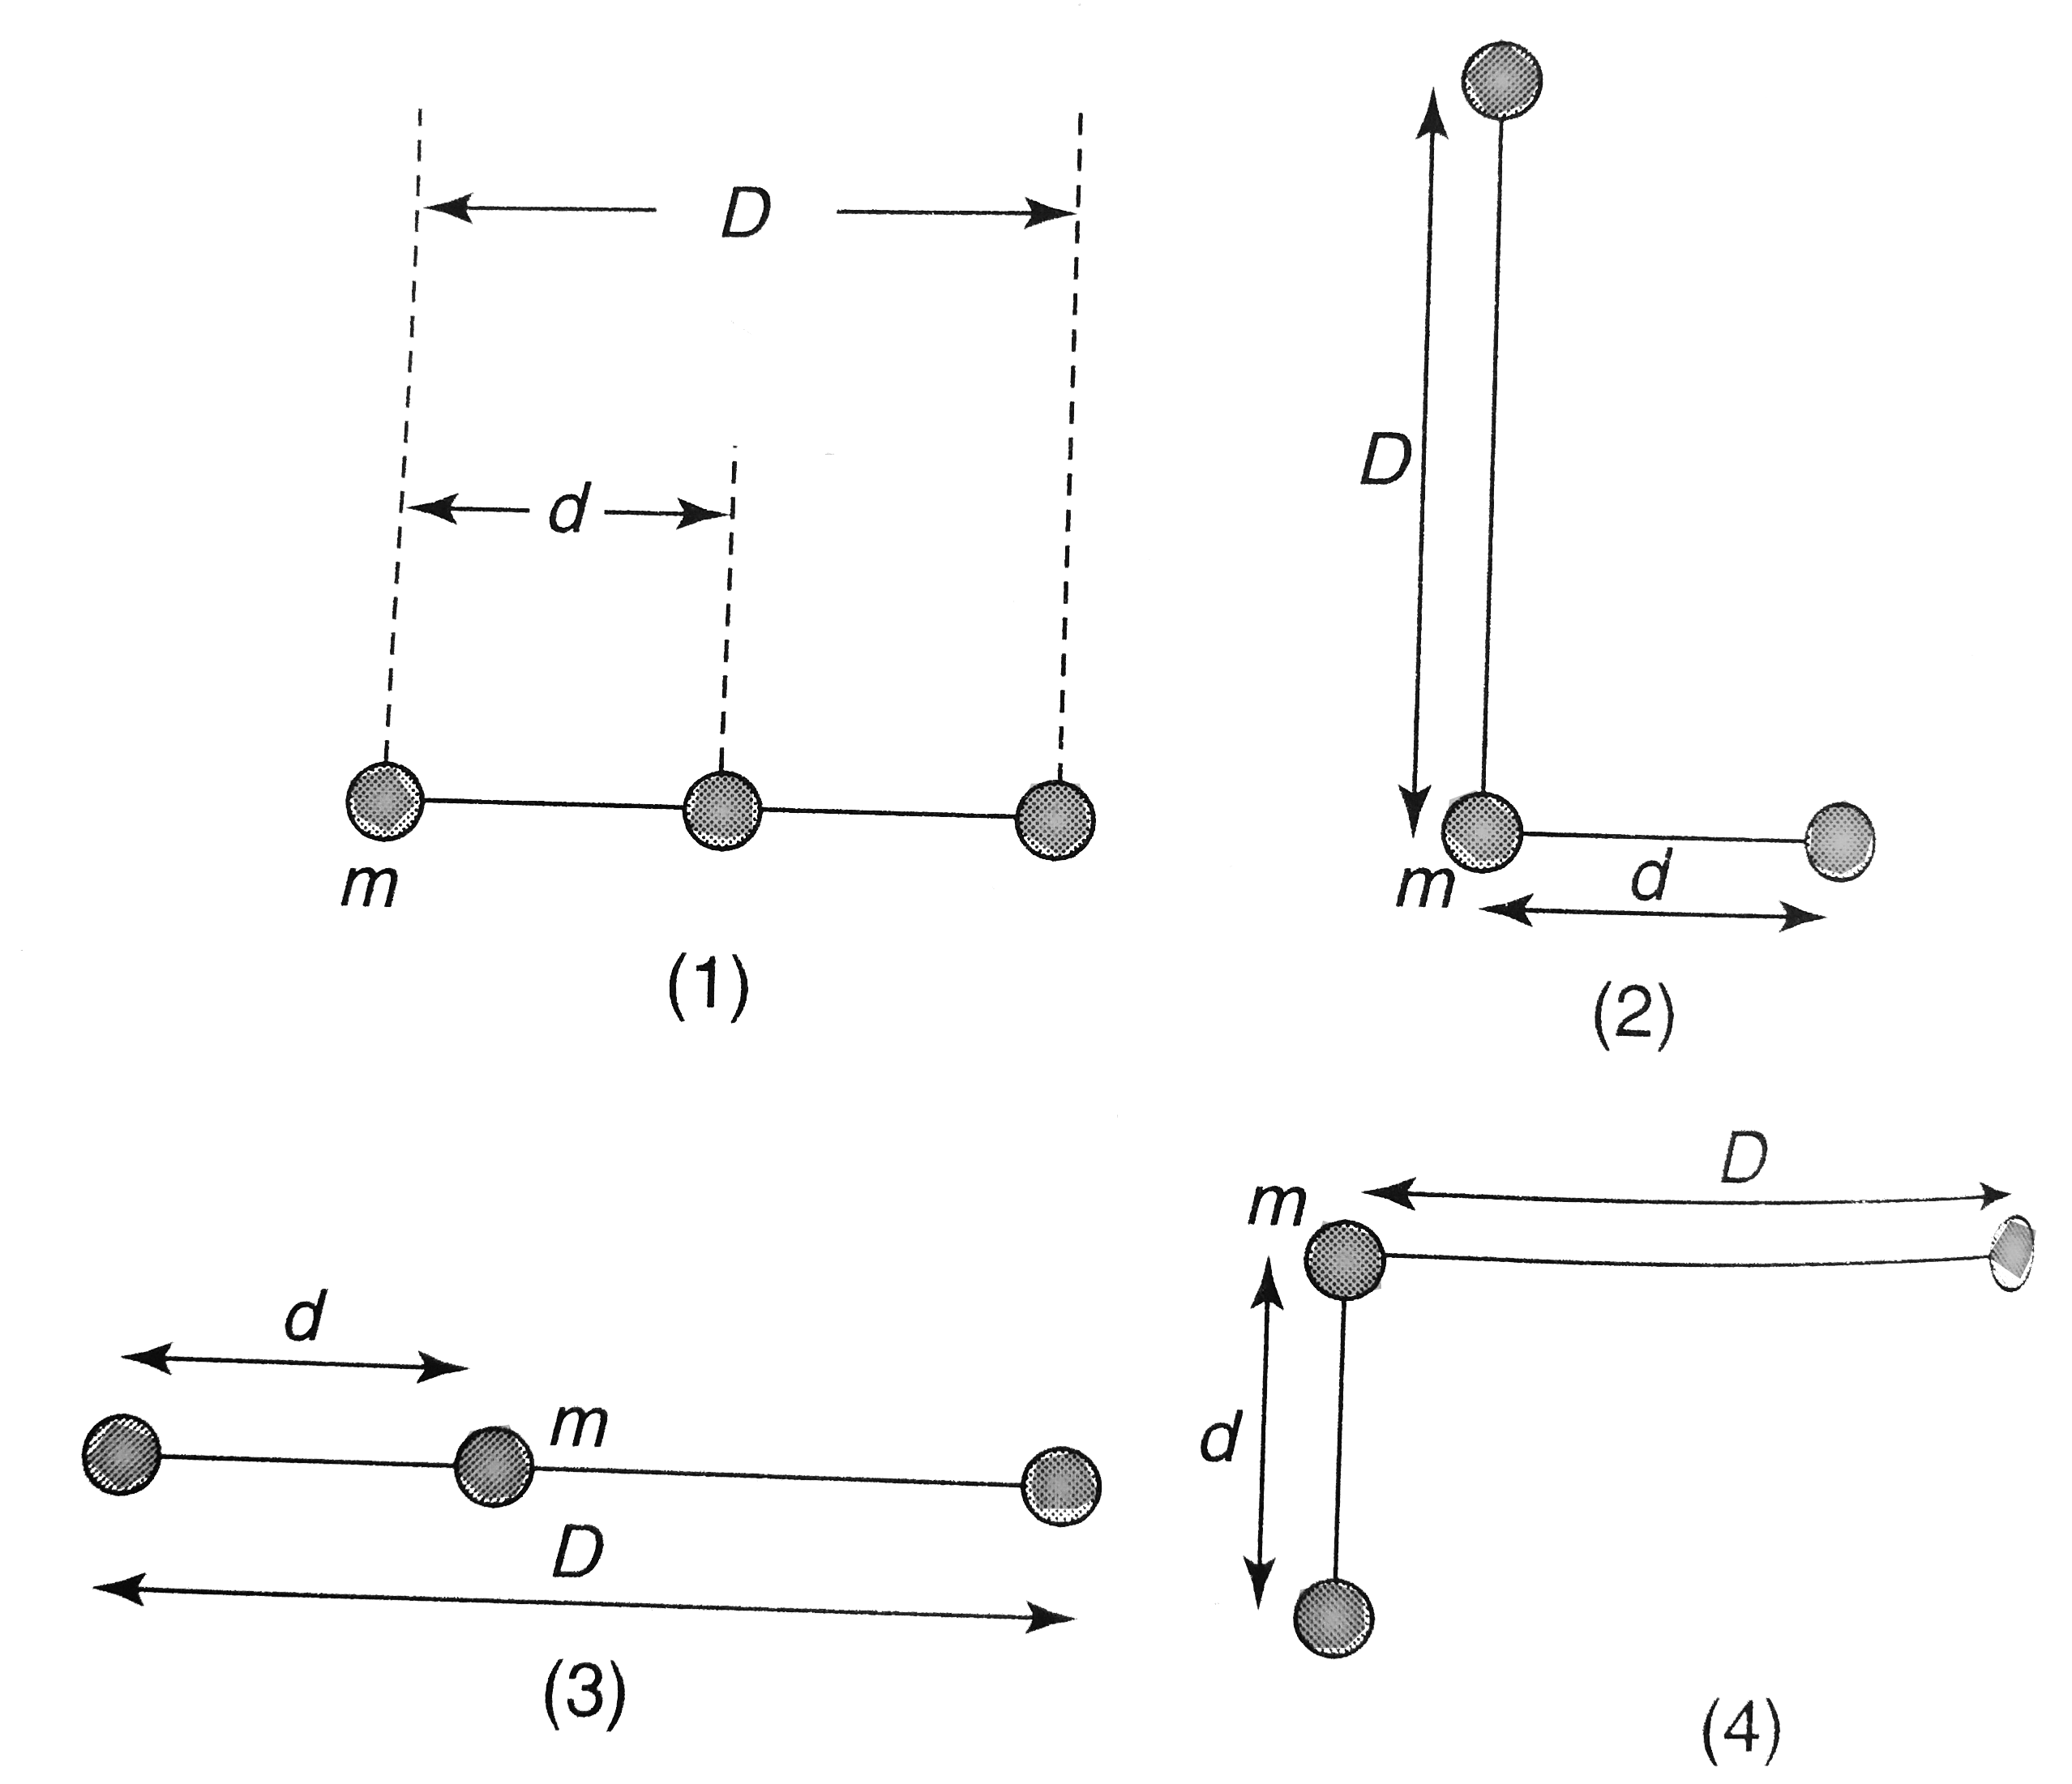 A1, tie of 2 and 4, then 3B1,4,3,2C2,3,4,1D4,3,1,2
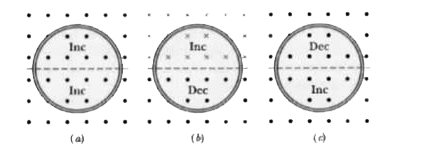
The figure shows three situations in which identical circular conducting loops are in uniform magnetic fields that are either increasing (Inc) or decreasing (Dec) in magnitude at identical rates. In each, the dashed line coincides with a diameter. Rank the situations according to the magnitude of the current induced in the loops, greatest first.
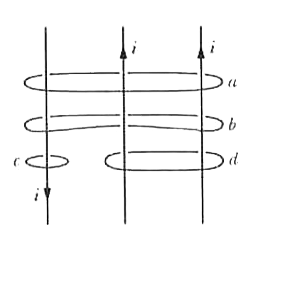
View SolutionThe figure here shows three equal currents i (two parallel and one antiparallel) and four Amperian loops. Rank the loops according to the magnitude of ∮ along each, greatest first.
View SolutionThe figure shows four wire loops, with edge length of either L or 2L. All four loops will move through a region of uniform magnetic field →B (directed out of the page) at the same constant velocity . Rank the four loops according to the maximum magnitude of the e.m.f. induced as they move through the field, greatest first

View SolutionThe graph shows the variation of magnetic field B that exists through a conducing loop, perpendicular to the plane of the loop. The emf's induced in the loop during equal intervals a, b, c, d and e are related as
View SolutionThe figure shows four wire loops, with edge length of either L or 2L. All four loops will move through a region of uniform magnetic field →B (directed out of the page) at the same constant velocity . Rank the four loops according to the maximum magnitude of the e.m.f. induced as they move through the field, greatest first

View Solution
