The graph shows the variation of magnetic field B that exists through a conducing loop, perpendicular to the plane of the loop. The emf's induced in the loop during equal intervals a, b, c, d and e are related as
Eb<Ed<Ee
Ea>Ec
Ec>Ea
Eb>Ed=Ee
The correct Answer is:D
To solve the problem regarding the induced EMFs in a conducting loop due to the variation of the magnetic field over time, we will follow these steps:
Step 1: Understand the relationship between magnetic field and induced EMF
According to Faraday's law of electromagnetic induction, the induced EMF (ε) in a loop is directly related to the rate of change of magnetic flux (Φ) through the loop. The formula is given by:
EMF=−dΦdt
where Φ=B⋅A⋅cos(θ). Since the magnetic field is perpendicular to the plane of the loop, cos(θ)=1.
Step 2: Express EMF in terms of magnetic field change
Since the area (A) of the loop is constant, we can simplify the expression for EMF:
EMF=A⋅dBdt
This means that the induced EMF is proportional to the rate of change of the magnetic field (dB/dt).
Step 3: Analyze the graph
From the graph provided in the question, we need to identify the intervals (A, B, C, D, E) and observe the changes in the magnetic field (B) over these intervals:
- Interval A-B: There is a significant increase in the magnetic field, indicating a high rate of change (dB/dt is large).
- Interval B-C: The magnetic field remains constant, so there is no change (dB/dt = 0).
- Interval C-D: There is a decrease in the magnetic field, indicating a negative rate of change (dB/dt is negative).
- Interval D-E: The magnetic field decreases further, indicating a continued negative rate of change.
Step 4: Compare the induced EMFs
Based on the analysis of the graph:
- The EMF during interval A-B (E_A) will be the highest because of the maximum change in magnetic field.
- The EMF during interval B-C (E_B) will be zero since there is no change in the magnetic field.
- The EMFs during intervals C-D (E_C) and D-E (E_D) will be negative but will have different magnitudes.
Thus, we can summarize the relationship as:
EA>ED>EE>EC>EB
Step 5: Identify the correct option
From the analysis, we can conclude that the induced EMFs are related as follows:
EB<EC<ED<EA
This leads us to the conclusion that option D (E_B is greater than E_A) is incorrect. Instead, we find that E_A is the greatest and E_B is the least.
Final Answer
The induced EMFs in the loop during intervals A, B, C, D, and E are related as:
EA>ED>EE>EC>EB
According to Faraday's law of electromagnetic induction, the induced EMF (ε) in a loop is directly related to the rate of change of magnetic flux (Φ) through the loop. The formula is given by:
EMF=−dΦdt
where Φ=B⋅A⋅cos(θ). Since the magnetic field is perpendicular to the plane of the loop, cos(θ)=1.
Since the area (A) of the loop is constant, we can simplify the expression for EMF:
EMF=A⋅dBdt
This means that the induced EMF is proportional to the rate of change of the magnetic field (dB/dt).
From the graph provided in the question, we need to identify the intervals (A, B, C, D, E) and observe the changes in the magnetic field (B) over these intervals:
- Interval A-B: There is a significant increase in the magnetic field, indicating a high rate of change (dB/dt is large).
- Interval B-C: The magnetic field remains constant, so there is no change (dB/dt = 0).
- Interval C-D: There is a decrease in the magnetic field, indicating a negative rate of change (dB/dt is negative).
- Interval D-E: The magnetic field decreases further, indicating a continued negative rate of change.
Based on the analysis of the graph:
- The EMF during interval A-B (E_A) will be the highest because of the maximum change in magnetic field.
- The EMF during interval B-C (E_B) will be zero since there is no change in the magnetic field.
- The EMFs during intervals C-D (E_C) and D-E (E_D) will be negative but will have different magnitudes.
EA>ED>EE>EC>EB
From the analysis, we can conclude that the induced EMFs are related as follows:
EB<EC<ED<EA
This leads us to the conclusion that option D (E_B is greater than E_A) is incorrect. Instead, we find that E_A is the greatest and E_B is the least.
The induced EMFs in the loop during intervals A, B, C, D, and E are related as:
EA>ED>EE>EC>EB
Topper's Solved these Questions
- ELECTROMAGNETIC INDUCTIONBOOK - AAKASH INSTITUTE ENGLISHCHAPTER - ELECTROMAGNETIC INDUCTIONEXERCISE - Assignment (SECTION - C)
10 Videos
- ELECTROMAGNETIC INDUCTIONBOOK - AAKASH INSTITUTE ENGLISHCHAPTER - ELECTROMAGNETIC INDUCTIONEXERCISE - Assignment (SECTION - D)
6 Videos
- ELECTROMAGNETIC INDUCTIONBOOK - AAKASH INSTITUTE ENGLISHCHAPTER - ELECTROMAGNETIC INDUCTIONEXERCISE - Assignment (SECTION - A)
55 Videos
- ELECTRIC CHARGES AND FIELDS BOOK - AAKASH INSTITUTE ENGLISHCHAPTER - ELECTRIC CHARGES AND FIELDS EXERCISE - comprehension
3 Videos
- ELECTROMAGNETIC WAVESBOOK - AAKASH INSTITUTE ENGLISHCHAPTER - ELECTROMAGNETIC WAVESEXERCISE - ASSIGNMENT SECTION - D Assertion-Reason Type Questions
25 Videos
Similar Questions
The graph gives the magnitude B(t) of a uniform magnetic field that exists throughout a conductig loop, perpendicular to the plane of the loop. Rank the five regions of the graph according to the magnitude fo the emf induced in the loop, greater first

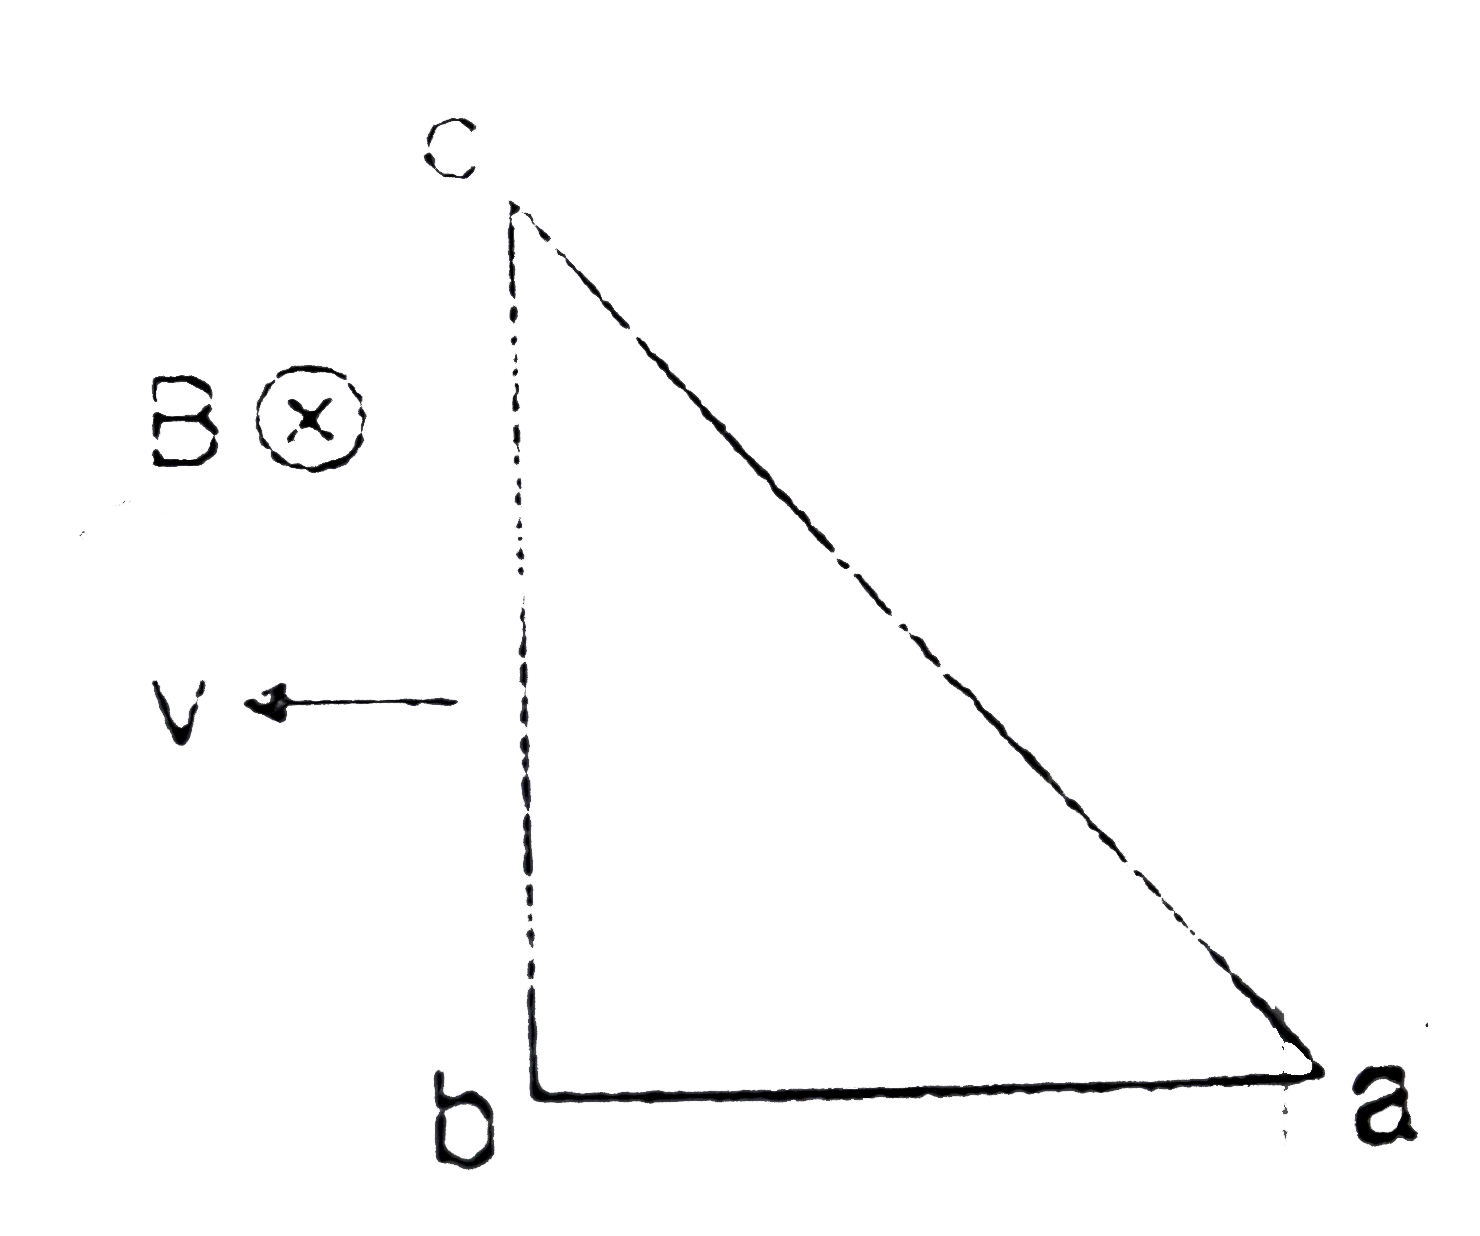
View SolutionA right angled triangle abc made of a metallic wire, moves at a uniform speed v in its plane as shown in the figure.A uniform magnetic field B exists in the perpendicular direction of plane of triangle.Find the emf induced (a)in the loop abc. (b)in the segment bc,(c)in the segment ac and (d) in the segment ab.

View SolutionA conducting square loop having edges of length2.0 cm is rotated through 180∘ about a diagonal in 0.20s. A magnetic field B exists in the region which si perpendicular to the loop in its initial position. If the average induced emf during the rotation is 20 mV, find the magnitude of the magnetic field.
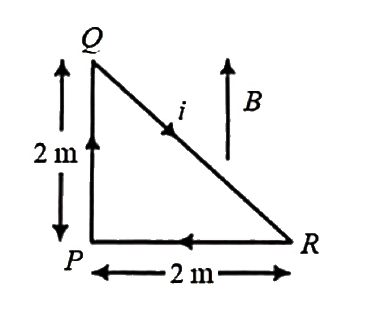
View SolutionA loop PQR carries a current i=2A as shown in the figure. A uniform magnetic field B = 2T exists in space parallel to the plane of the loop . The magnetic torque on the loop is

View SolutionA circular loop of radius R is kept in a uniform magnetic field pointing perpendicular into the plane of paper. When a current l flows in the loop, the tension produced in the loop is

View SolutionA circular loop of area 1cm2 , carrying a current of 10 A , is placed in a magnetic field of 0.1 T perpendicular to the plane of the loop. The torque on the loop due to the magnetic field is
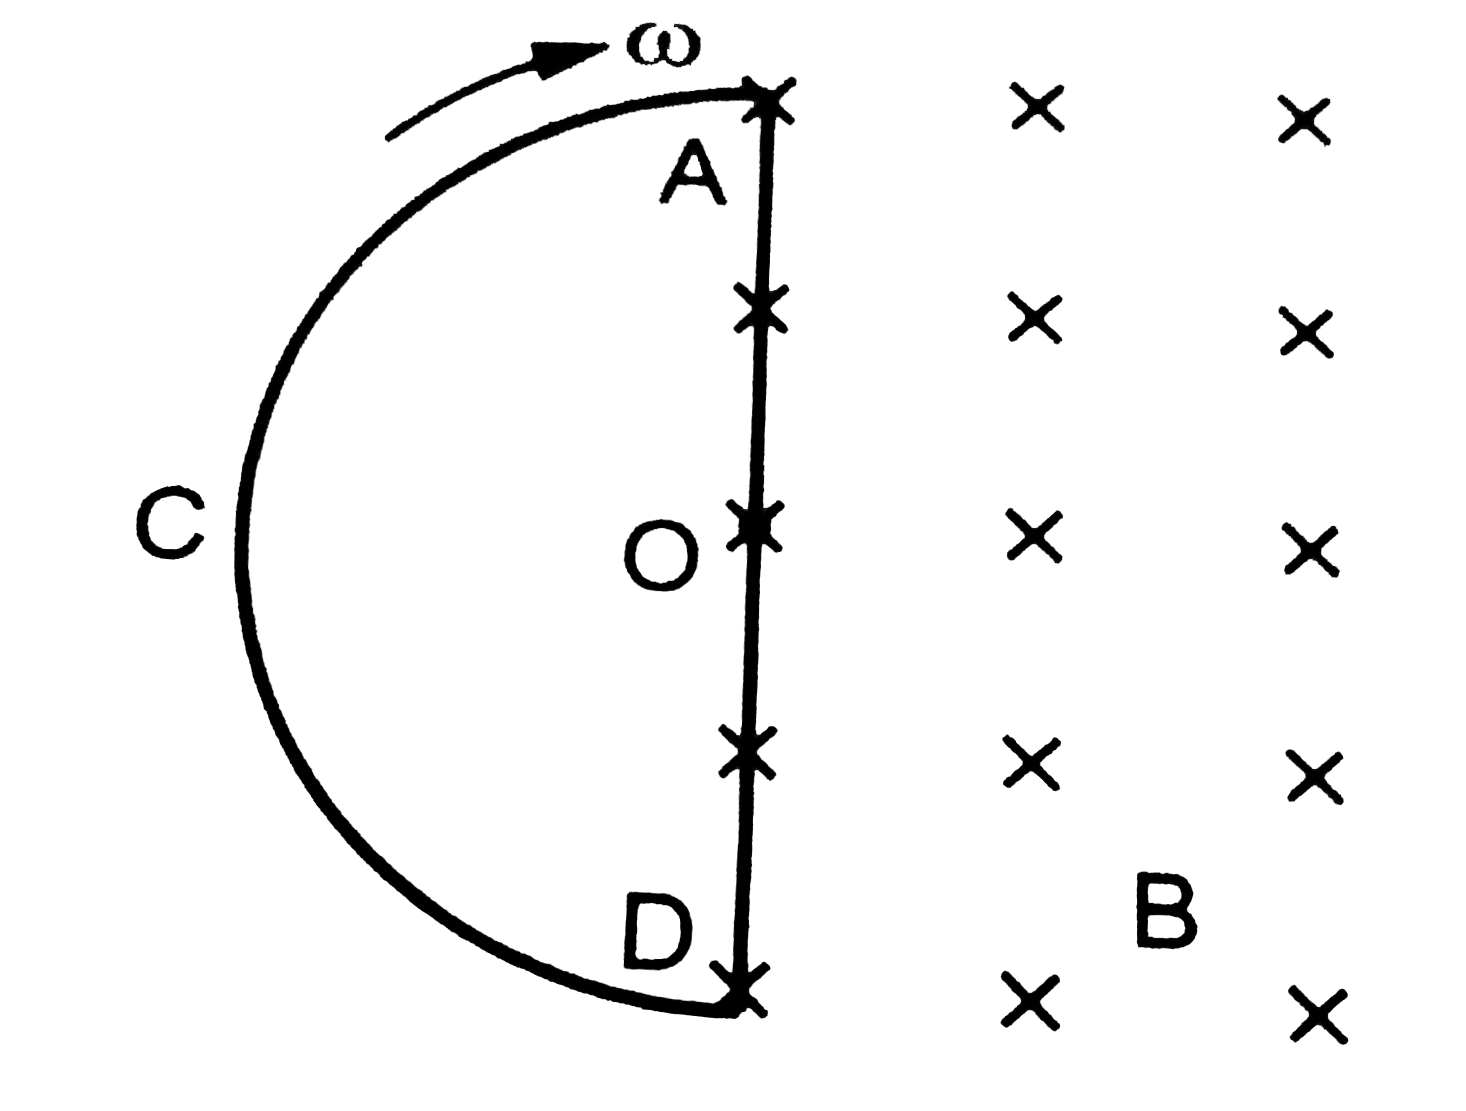
View SolutionThe magnetic field B shown in is directed into the plane of the paper. ACDA is a semicircular conducting loop of radius r with the centre at O. The loop is now made ot rotate clockwise with a constant angular velocity ω about on axis passing through O and perpendicular to the plane of the paper. The resistance of the loop is R. Obtain an expression for the magnitude of the induced current in the loop. Plot a graph between the induced current i and ωt, for two periods of rotation.

View SolutionA semicircular loop of radius R is rotated with an angular velocity ω perpendicular to the plane of a magnetic field B as shown in the figure. Emf Induced in the loop is

View SolutionA conducting square loop is placed in a magnetic field B with its plane perpendicular to the field. Now the sides of the loop start shrinking at a constant rate α. the induced emf in the loop at an instant when its side is a is
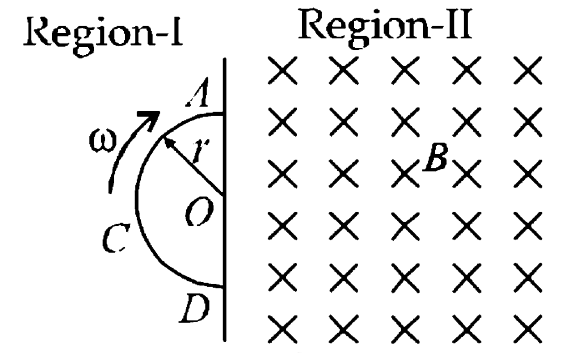
View SolutionSpace is divided by the line AD into two regions. Region I is field free and the Region II has a unifrom magnetic field B direction into the plane of the paper. ACD is a simicircular conducting loop of radius r with center at O, hte plane of the loop being in the plane of the paper. The loop is now made to rotate with a constant angular velocity ω about an axis passing through O and the perpendicular to the plane of the paper. The effective resistance of the loop is R.

(i) obtain an expression for hte magnitude of the induced cureent in the loop.
(ii) Show the direction of the current when the loop is entering into the Rigion II.
Plot a graph between the induced e.m.f and the time of roation for two periods or rotation.
View Solution
