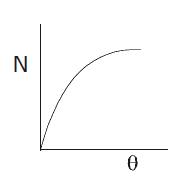
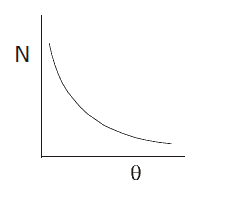
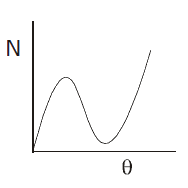
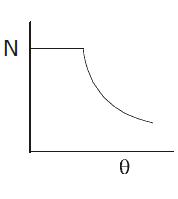
Which of the following may be representing graph between number of scattered particles detected (N) and scattering angle(θ) in Rutherford's experiment?


The correct Answer is:B
To solve the question regarding the graph that represents the relationship between the number of scattered particles detected (N) and the scattering angle (θ) in Rutherford's experiment, we can follow these steps:
Step 1: Understand the Relationship
Rutherford's experiment demonstrated that when alpha particles are scattered by a thin gold foil, the number of particles scattered at a particular angle θ is inversely proportional to the fourth power of the sine of half the scattering angle. Mathematically, this can be expressed as:
N∝1sin4(θ2)
Step 2: Analyze the Behavior of the Function
From the relationship, we can infer the following:
- As θ approaches 0, sin(θ2) approaches 0, which means N approaches infinity (since we are dividing by a very small number).
- As θ increases, sin(θ2) increases, leading to a decrease in N.
- Therefore, N will be very high at small angles and will decrease as the angle increases.
Step 3: Determine the Shape of the Graph
Given the behavior of the function:
- At θ = 0, N is theoretically infinite.
- As θ increases, N decreases sharply.
- The graph will start from a very high value when θ is 0 and will decrease as θ increases.
Step 4: Compare with Given Graphs
Now, we need to look at the provided graphs and identify which one matches the behavior we described:
- The correct graph should start high when θ is 0 and decrease as θ increases.
- It should not cross the x-axis (i.e., N should not become negative).
Step 5: Identify the Correct Option
After analyzing the given graphs based on the above reasoning, we can conclude that the graph that shows a high value of N at θ = 0 and decreases as θ increases is the correct representation of the relationship in Rutherford's experiment.
Conclusion
The correct option is the one that shows a decreasing trend starting from a high value when θ is 0.
---
Rutherford's experiment demonstrated that when alpha particles are scattered by a thin gold foil, the number of particles scattered at a particular angle θ is inversely proportional to the fourth power of the sine of half the scattering angle. Mathematically, this can be expressed as:
From the relationship, we can infer the following:
- As θ approaches 0, sin(θ2) approaches 0, which means N approaches infinity (since we are dividing by a very small number).
- As θ increases, sin(θ2) increases, leading to a decrease in N.
- Therefore, N will be very high at small angles and will decrease as the angle increases.
Given the behavior of the function:
- At θ = 0, N is theoretically infinite.
- As θ increases, N decreases sharply.
- The graph will start from a very high value when θ is 0 and will decrease as θ increases.
Now, we need to look at the provided graphs and identify which one matches the behavior we described:
- The correct graph should start high when θ is 0 and decrease as θ increases.
- It should not cross the x-axis (i.e., N should not become negative).
After analyzing the given graphs based on the above reasoning, we can conclude that the graph that shows a high value of N at θ = 0 and decreases as θ increases is the correct representation of the relationship in Rutherford's experiment.
The correct option is the one that shows a decreasing trend starting from a high value when θ is 0.
Similar Questions
Knowledge Check
- Question 1 - Select One
Which of the following may be representing graph between number of scattered particles detected (N) and sacttering angle (θ) in Rutherford's experiment?
A B
B C
C D
D
- Question 2 - Select One
The number of α-particless scattered per unit area N (θ) at scattering angle θ varies inversely as
Acos4(θ2)Bsin4(θ2)Ctan4(θ2)Dcot4(θ2) - Question 3 - Select One
Which of the following observations was not correct during Rutherford's scattering experiment?
AMost of the α-particles passed through the gold foil undeflected.BA small fraction of the α-particles was deflected by small angles.CA large number of the α-particles were bounced back.DA very few α-particles ( ~1 in 20,000) were bounced back.
In scattering experiment , the force that scatters particles is
View SolutionWhich of the following conclusions regarding the structure of atom is based on Rutherford's α-particle scattering experiment?
View SolutionRutherford scattering formula fails for very small scattering angles because
View SolutionRutherford scattering formula fails for very small scattering angles because
View SolutionWhich of the following conclusions couldnot be derived from Rutehrford's α-particle scattering experiment?
View Solution

