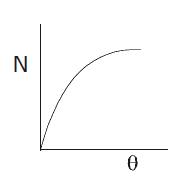
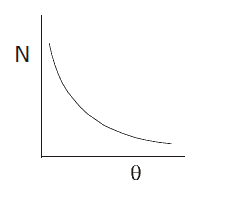
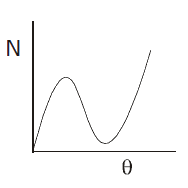
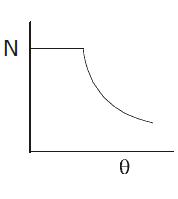
Draw graph of number of scattered particles to scattering angle in Ratherford's experiment.
To draw the graph of the number of scattered particles versus the scattering angle in Rutherford's experiment, we can follow these steps:
1. Understand the Experiment: In Rutherford's experiment, alpha particles are directed at a thin gold foil. Most particles pass through undeflected, while a small number are scattered at various angles due to interactions with the atomic nuclei.
2. Identify the Relationship: The number of scattered particles is related to the scattering angle (θ) by the formula:
N∝sin4(θ2)
This indicates that as the angle increases, the number of scattered particles decreases.
3. Set Up the Axes: On a graph, we will plot:
- The x-axis as the scattering angle (θ) ranging from 0° to 180°.
- The y-axis as the number of scattered particles (N).
4. Plot Key Points:
- At θ = 0°, N is at its maximum (most particles pass through undeflected).
- As θ increases, the value of N decreases.
- At θ = 180°, N approaches zero (very few particles are scattered back).
5. Draw the Curve:
- Start from the maximum point at θ = 0°.
- The curve should gradually decrease as θ increases.
- The decrease should be steep initially and then flatten out as θ approaches 180°.
6. Label the Graph: Clearly label the axes, the maximum point, and indicate the trend of the graph.
Final Graph:
The graph should show a steep decline from the maximum number of scattered particles at 0° to very few at 180°, illustrating the relationship described by the formula.
---
N∝sin4(θ2)
This indicates that as the angle increases, the number of scattered particles decreases.
- The x-axis as the scattering angle (θ) ranging from 0° to 180°.
- The y-axis as the number of scattered particles (N).
- At θ = 0°, N is at its maximum (most particles pass through undeflected).
- As θ increases, the value of N decreases.
- At θ = 180°, N approaches zero (very few particles are scattered back).
- Start from the maximum point at θ = 0°.
- The curve should gradually decrease as θ increases.
- The decrease should be steep initially and then flatten out as θ approaches 180°.
The graph should show a steep decline from the maximum number of scattered particles at 0° to very few at 180°, illustrating the relationship described by the formula.
Topper's Solved these Questions
- DUAL NATURE OF MATTER AND RADIATION & ATOMS AND NUCLEIBOOK - CBSE COMPLEMENTARY MATERIALCHAPTER - DUAL NATURE OF MATTER AND RADIATION & ATOMS AND NUCLEIEXERCISE - VERY SHORT ANSWER QUESTIONS (3 mark)
22 Videos
- DUAL NATURE OF MATTER AND RADIATION & ATOMS AND NUCLEIBOOK - CBSE COMPLEMENTARY MATERIALCHAPTER - DUAL NATURE OF MATTER AND RADIATION & ATOMS AND NUCLEIEXERCISE - LONG ANSWER QUESTIONS (5 MARKS)
3 Videos
- DUAL NATURE OF MATTER AND RADIATION & ATOMS AND NUCLEIBOOK - CBSE COMPLEMENTARY MATERIALCHAPTER - DUAL NATURE OF MATTER AND RADIATION & ATOMS AND NUCLEIEXERCISE - VERY SHORT ANSWER QUESTIONS (1 mark)
10 Videos
- CBSE EXAMINATION PAPER, DELHI REGION - 2015 (CODE NO. 55/1/1/D)BOOK - CBSE COMPLEMENTARY MATERIALCHAPTER - CBSE EXAMINATION PAPER, DELHI REGION - 2015 (CODE NO. 55/1/1/D)EXERCISE - SECTION E
6 Videos
- ELECTROMAGNETIC WAVES AND OPTICSBOOK - CBSE COMPLEMENTARY MATERIALCHAPTER - ELECTROMAGNETIC WAVES AND OPTICSEXERCISE - 1 mark question
11 Videos
Similar Questions
In Rutherford α-sattering experiment , the ratio of number of particles scattered at an angle of 180∘ to the number of particles scattered at an angle of 90∘ is α:4. What is the value of α ?
View SolutionThe graph of the total number of α-particles scattered at different angles in a given interval of time for α- particles scattering in the geiger- marsden experiment is given by
View Solution
Knowledge Check
Which of the following may be representing graph between number of scattered particles detected (N) and scattering angle(θ) in Rutherford's experiment?
A B
B C
C D
D
Which of the following may be representing graph between number of scattered particles detected (N) and sacttering angle (θ) in Rutherford's experiment?
A B
B C
C D
D
The path of the scattered α – particles is
ACircularBParabolicCEllipticalDHyperbolic
α particles are scattered due to
View SolutionSource of α-particles used in scattering experiment was
View SolutionAn α -particle moving with a constant energy is scattered by the nuclues. The scattering angle will be maximum when the α- particles.
View SolutionAn α -particle moving with a constant energy is scattered by the nuclues. The scattering angle will be maximum when the α- particles.
View SolutionFrom the α-particle scattering experiment, Rutherford conculded that
View Solution
