The graph plotted between concentration versus time
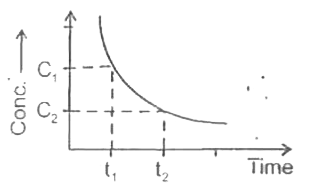
It gives rate of disappearance of reactant
Rate =(d[C2−C1)])t2−t1
Both (1) & (2)
It predicts the order of reaction
The correct Answer is:C
Step by step video, text & image solution for The graph plotted between concentration versus time by Chemistry experts to help you in doubts & scoring excellent marks in Class 12 exams.
Updated on:21/07/2023Topper's Solved these Questions
- CHEMICAL KINETICSBOOK - AAKASH INSTITUTECHAPTER - CHEMICAL KINETICSEXERCISE - ASSIGNMENT (SECTION B : Objective Type Questions)
20 Videos
- CHEMICAL KINETICSBOOK - AAKASH INSTITUTECHAPTER - CHEMICAL KINETICSEXERCISE - ASSIGNMENT (SECTION C : Previous Year Questions)
62 Videos
- CHEMICAL KINETICSBOOK - AAKASH INSTITUTECHAPTER - CHEMICAL KINETICSEXERCISE - EXERCISE
30 Videos
- CHEMICAL BONDING AND MOLECULAR STRUCTURE BOOK - AAKASH INSTITUTECHAPTER - CHEMICAL BONDING AND MOLECULAR STRUCTURE EXERCISE - Assignment Section J (Aakash Challengers Questions)
10 Videos
- CHEMISTRY IN EVERYDAY LIFE BOOK - AAKASH INSTITUTECHAPTER - CHEMISTRY IN EVERYDAY LIFE EXERCISE - Assignment ( SECTION - A)
45 Videos
Similar Questions
For a reaction , a graph was plotted between reactant concentration c and time as shown in the figure below.
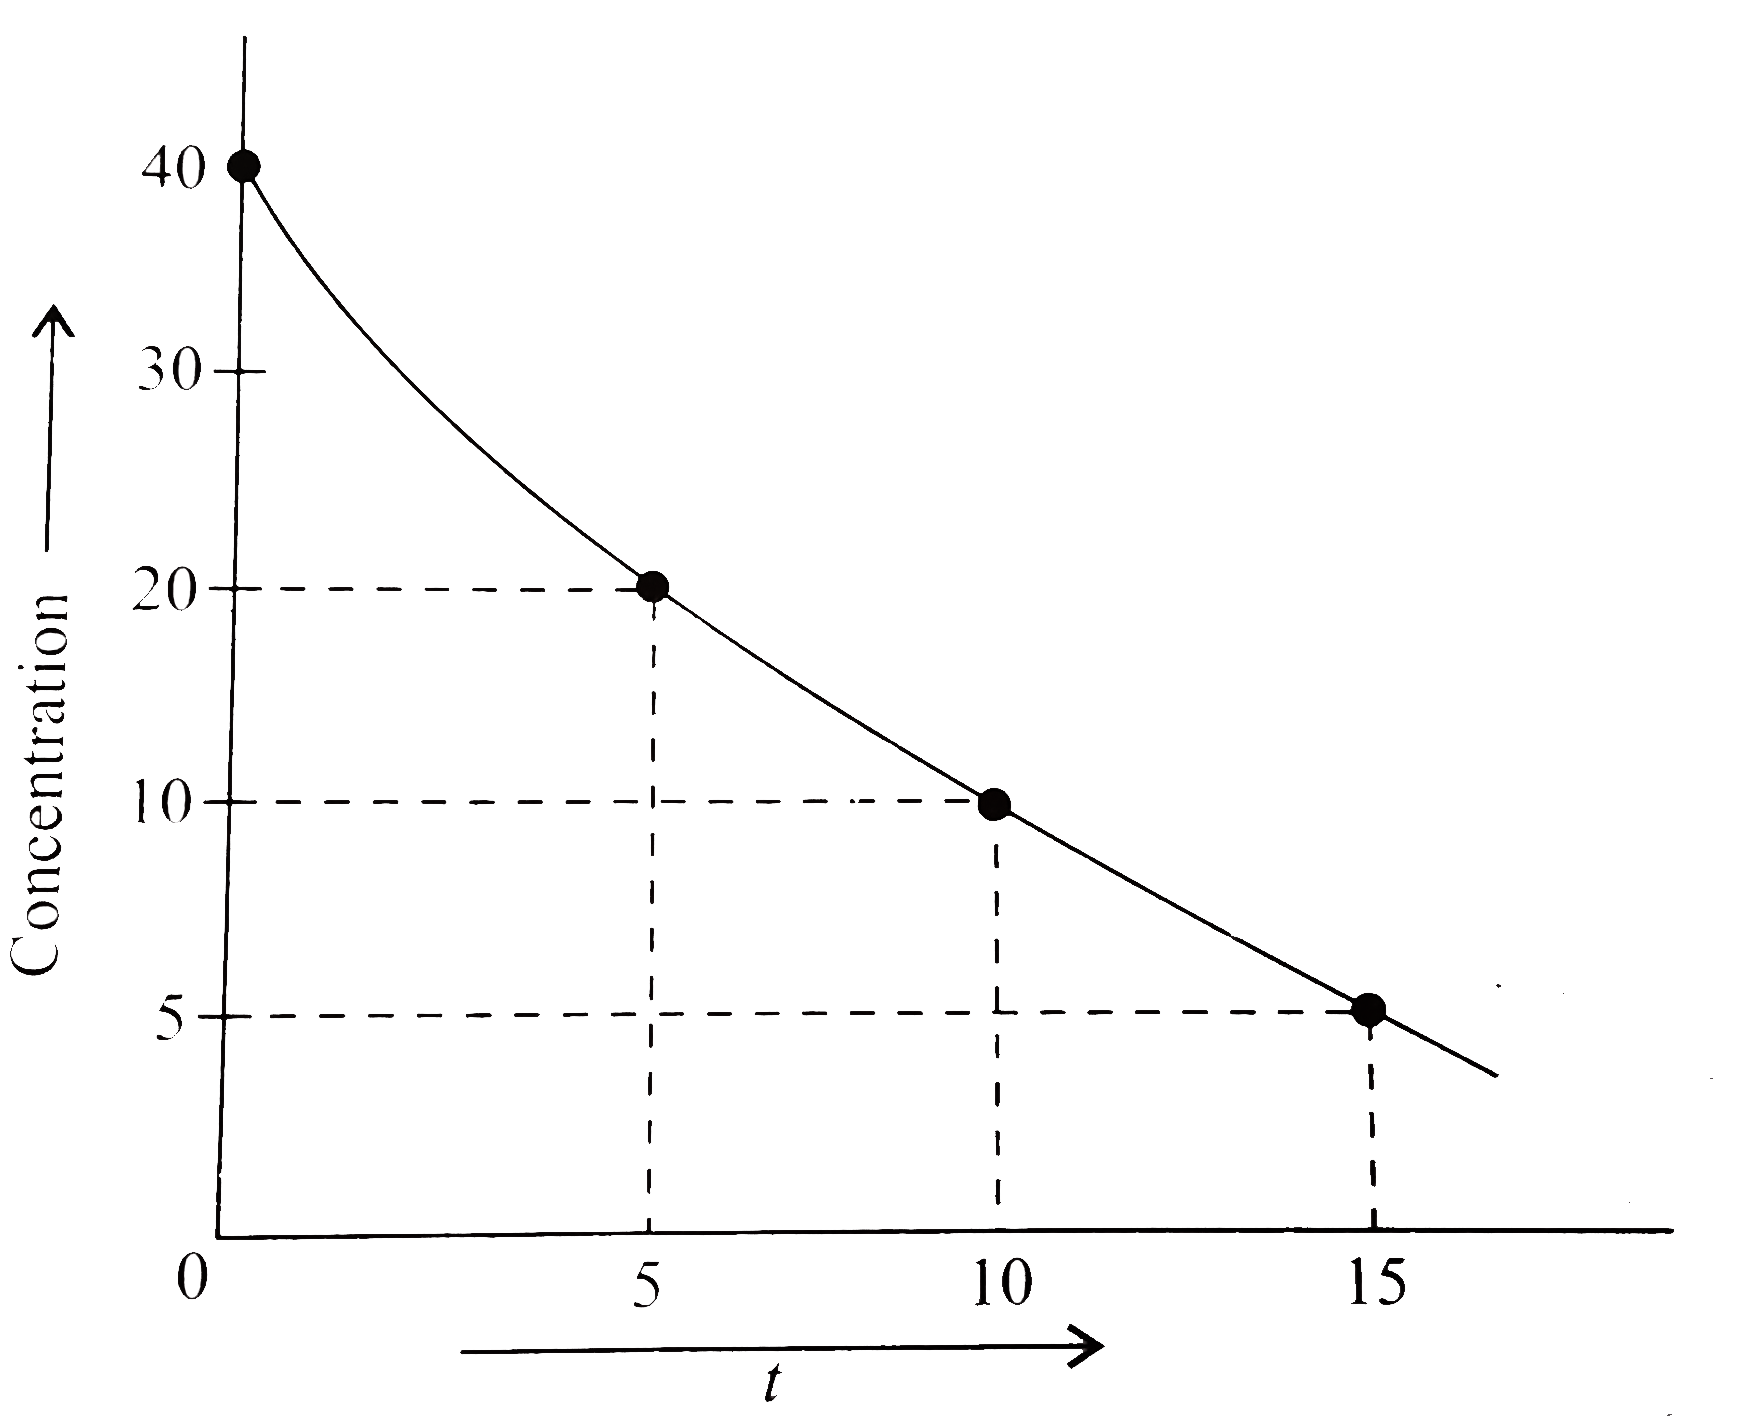
Identify the order of the reaction with respect to the reactant. Can the concentration of the reactant be theoretically zero after infinite time?
View SolutionThe graph plotted between acceleration and displacement of a particle in SHM is
View Solution
Knowledge Check
The plote between concentration versus time for a zero order reaction is represented by :
A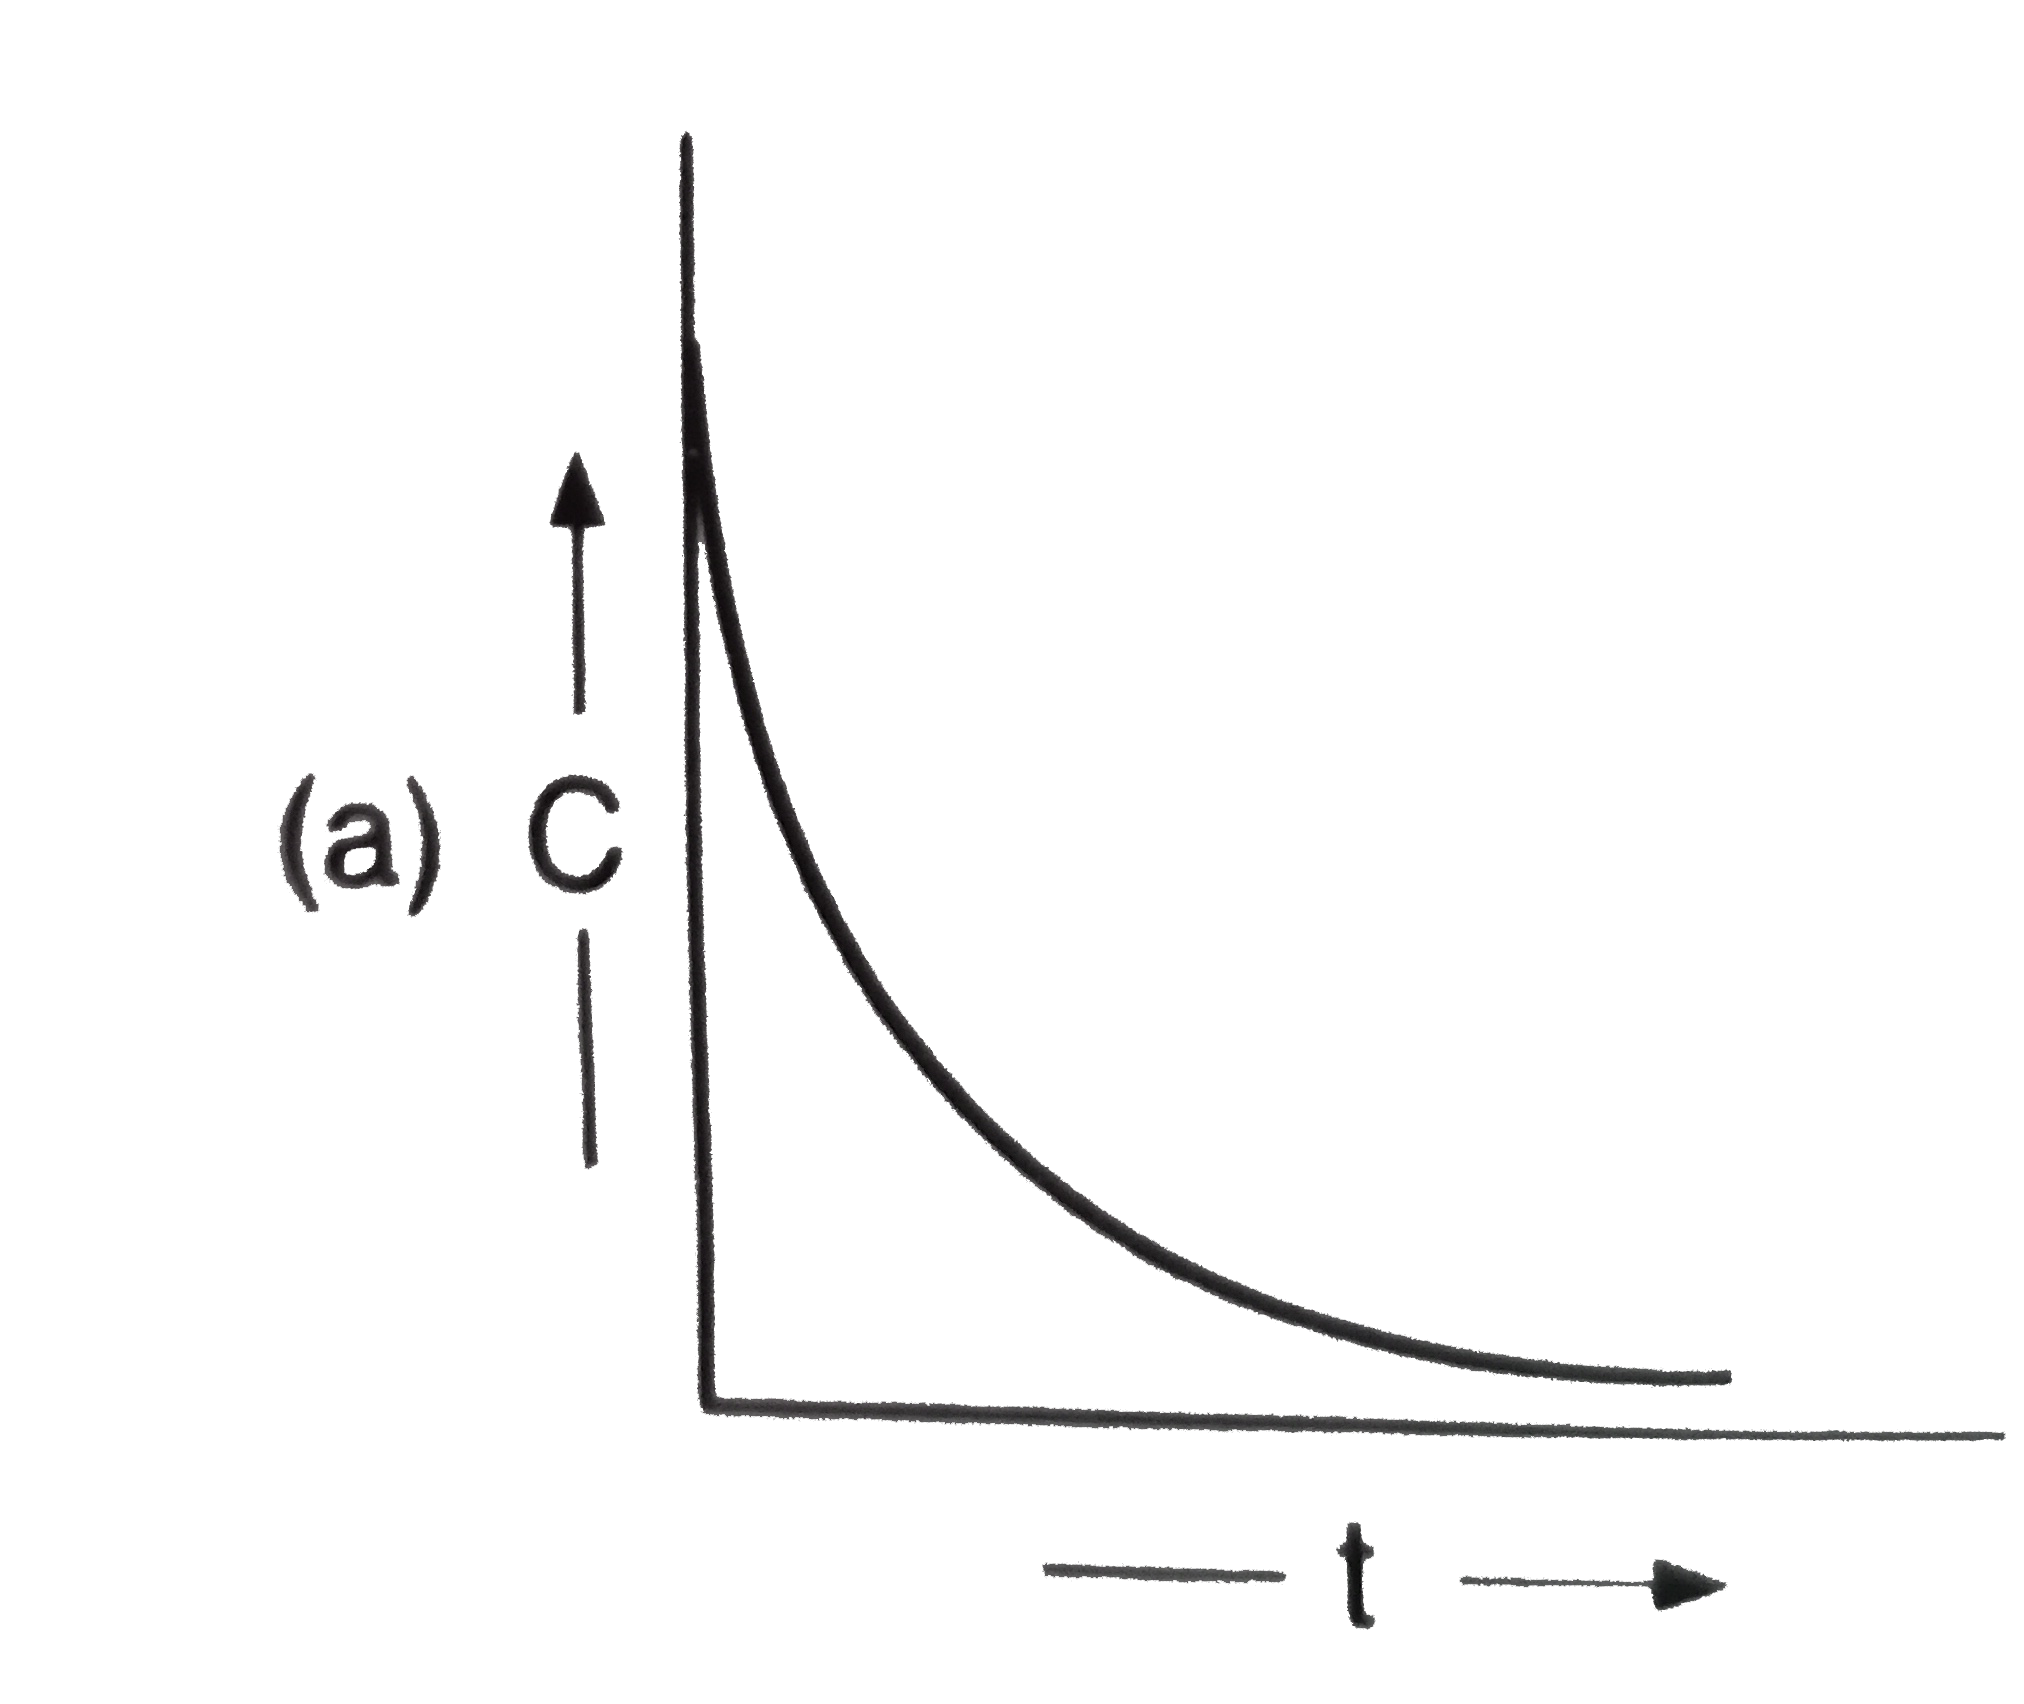 B
B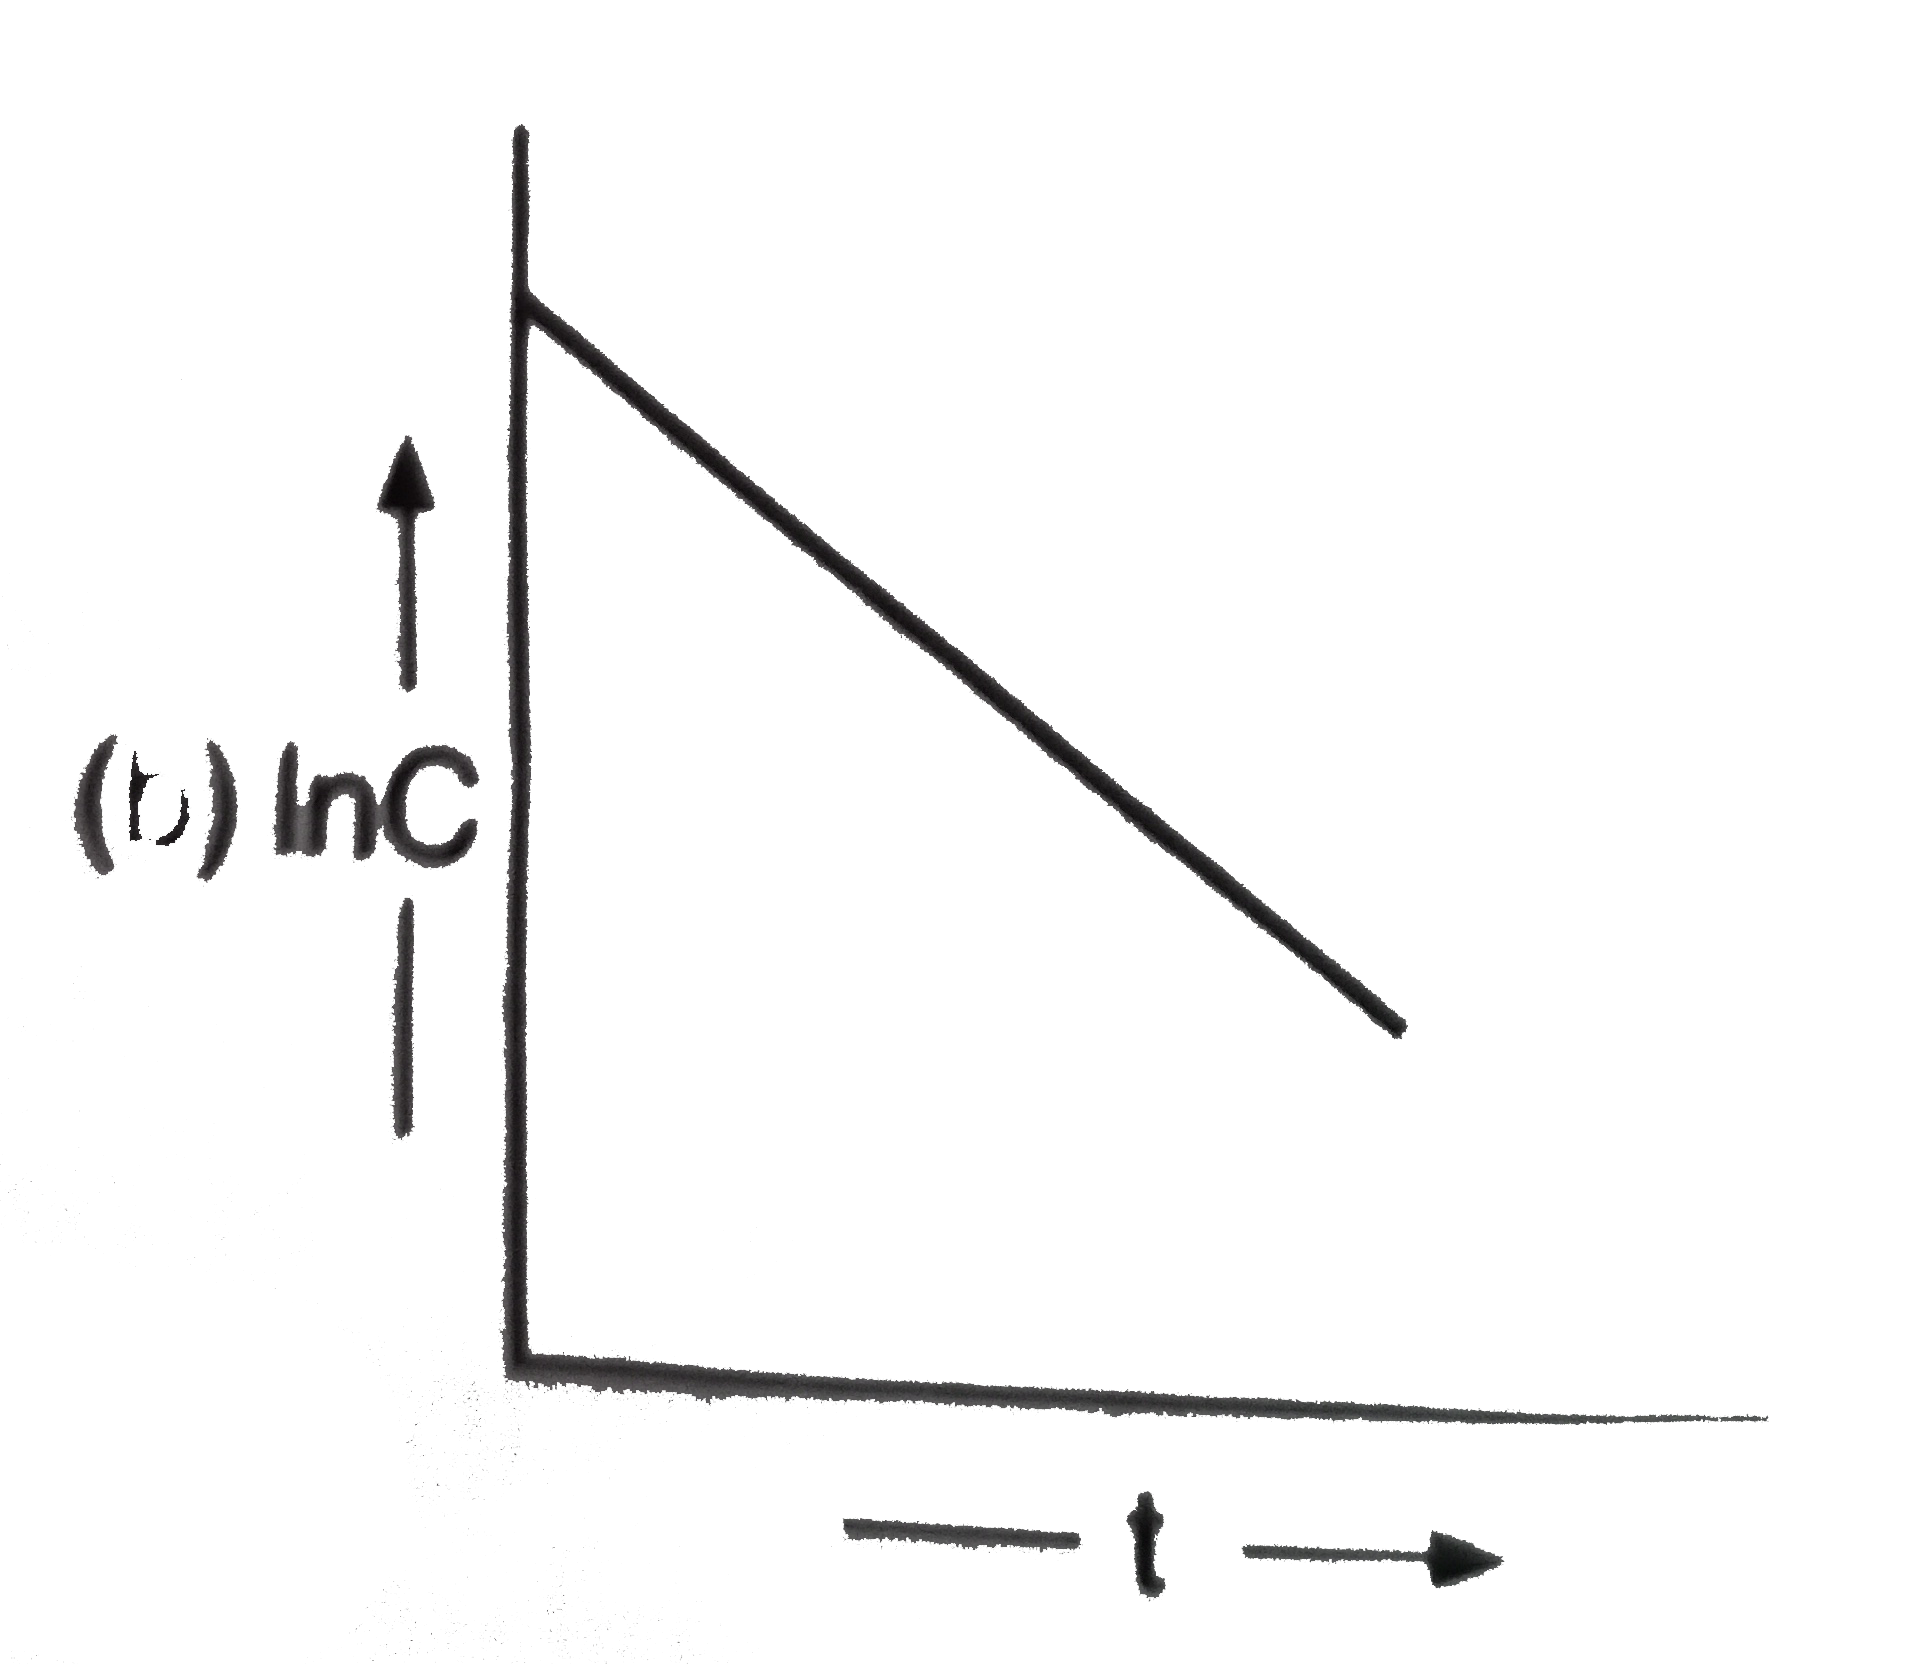 C
C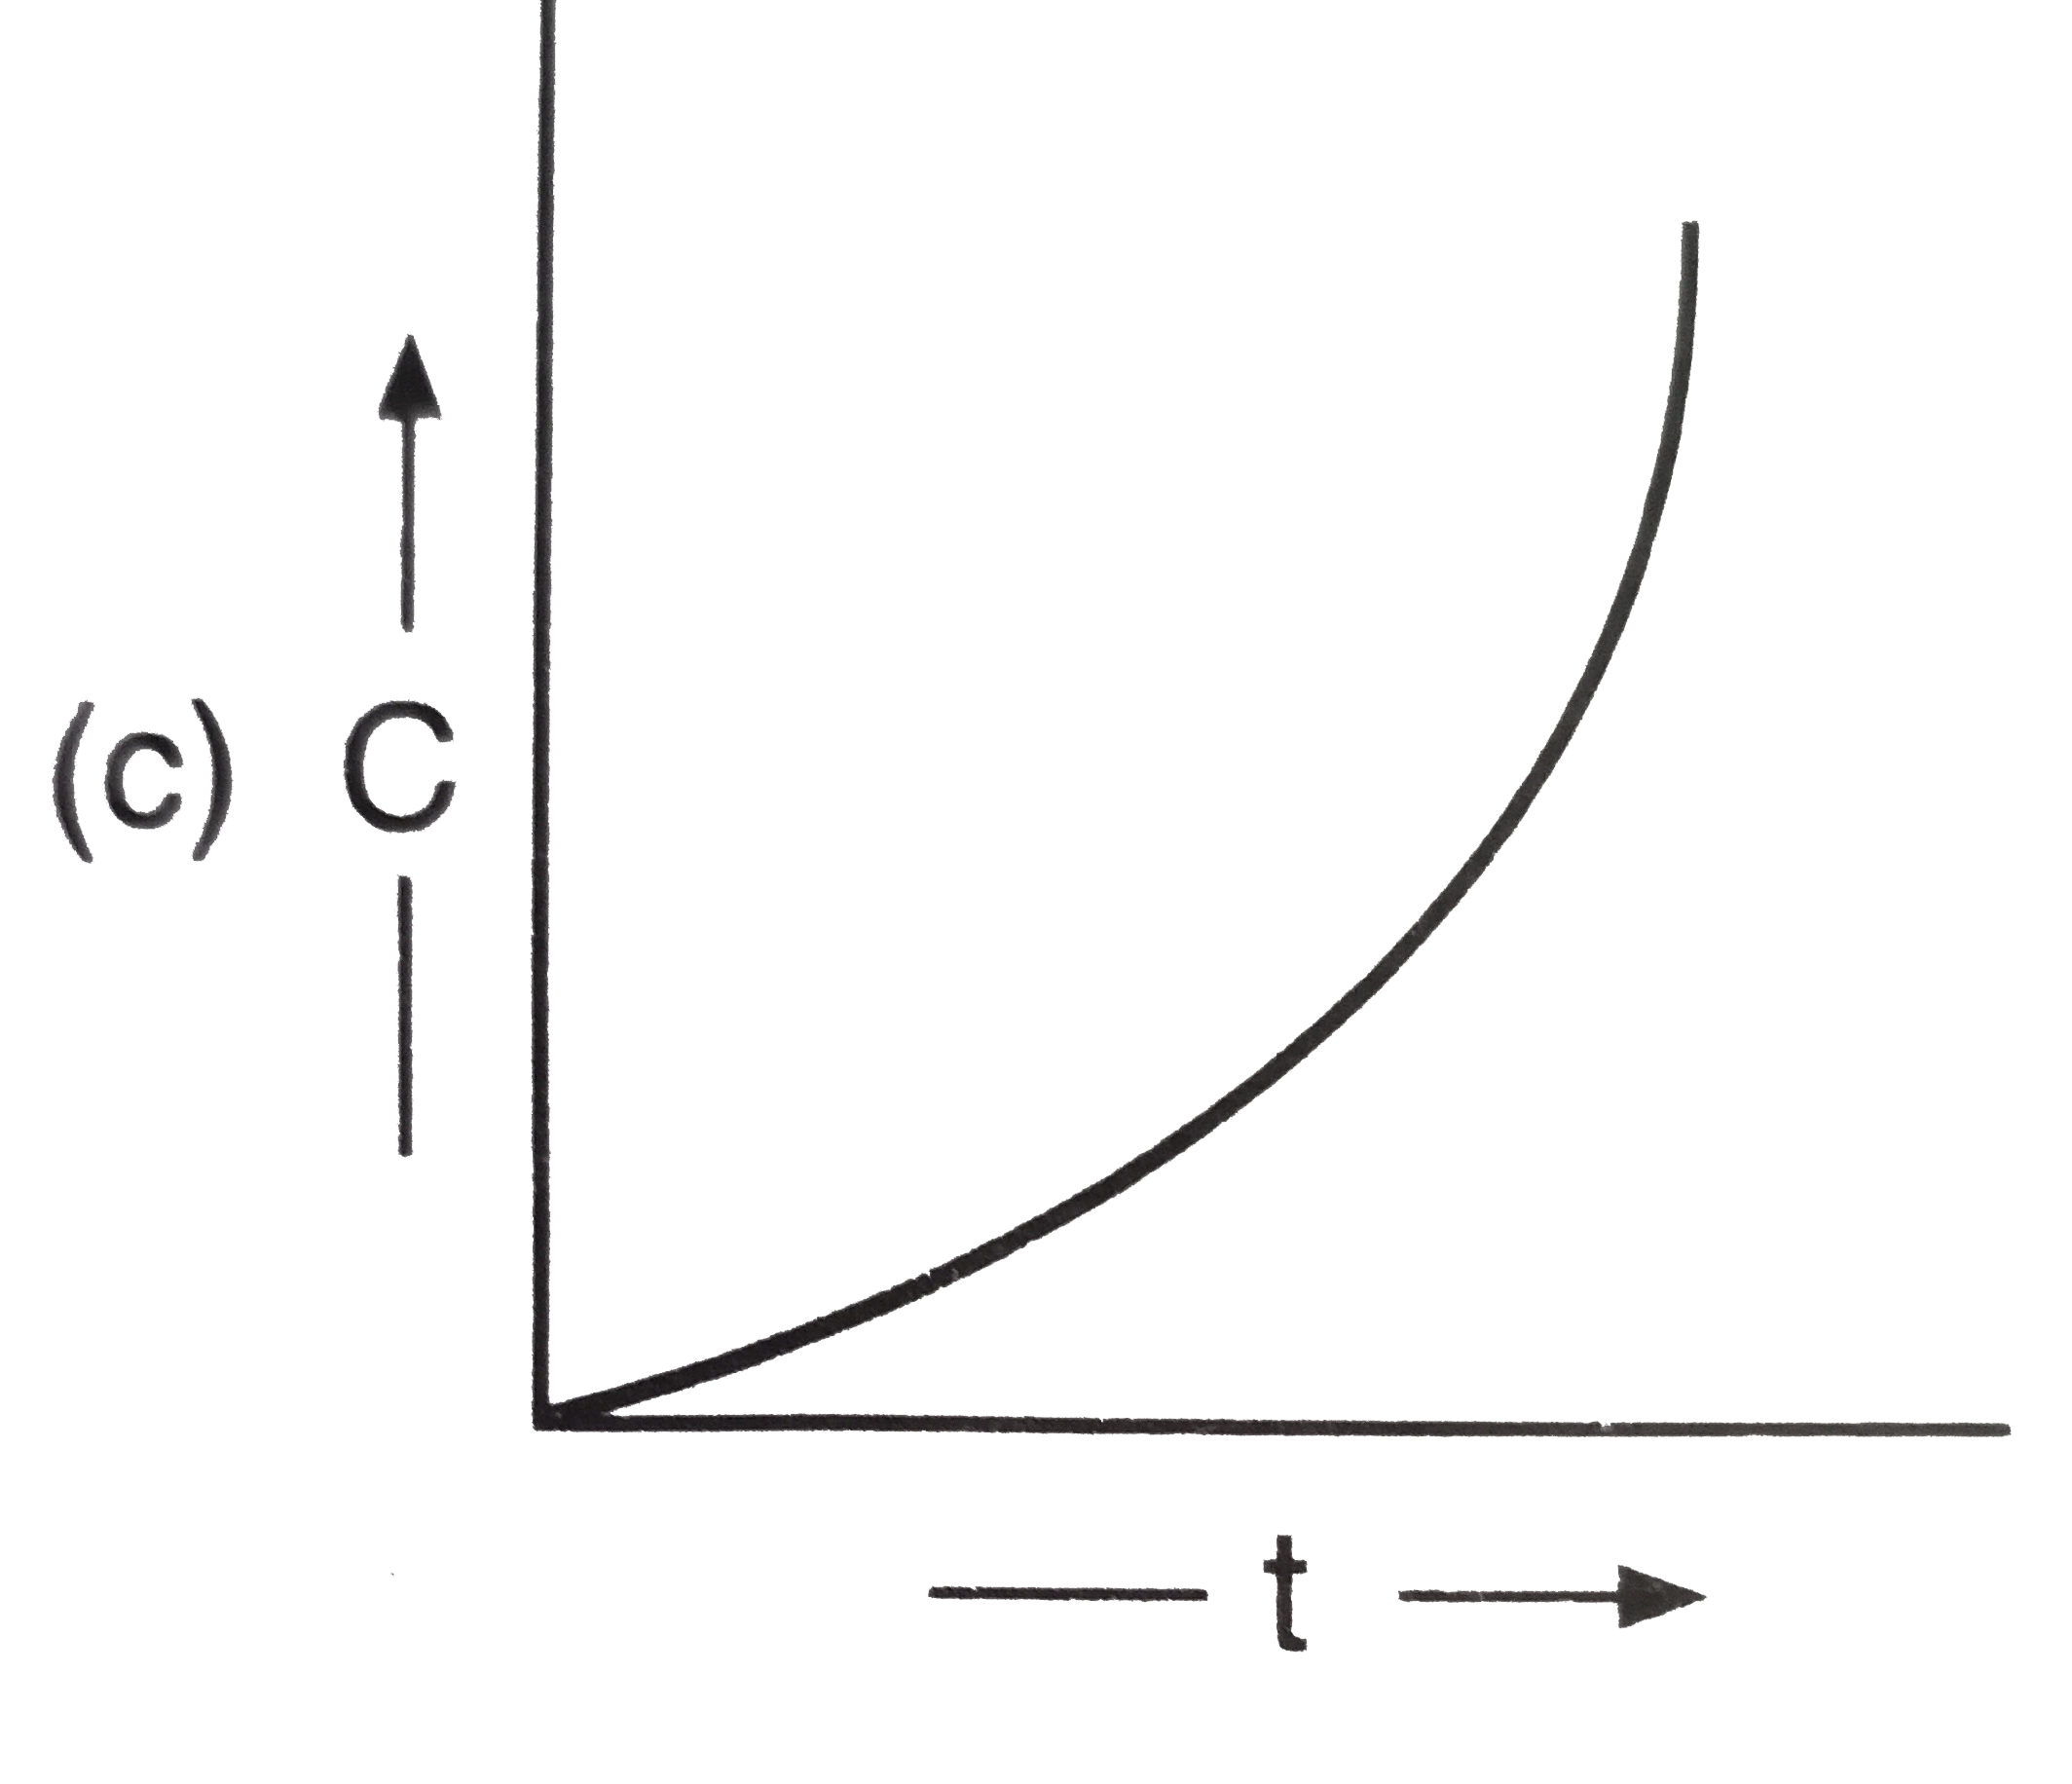 D
D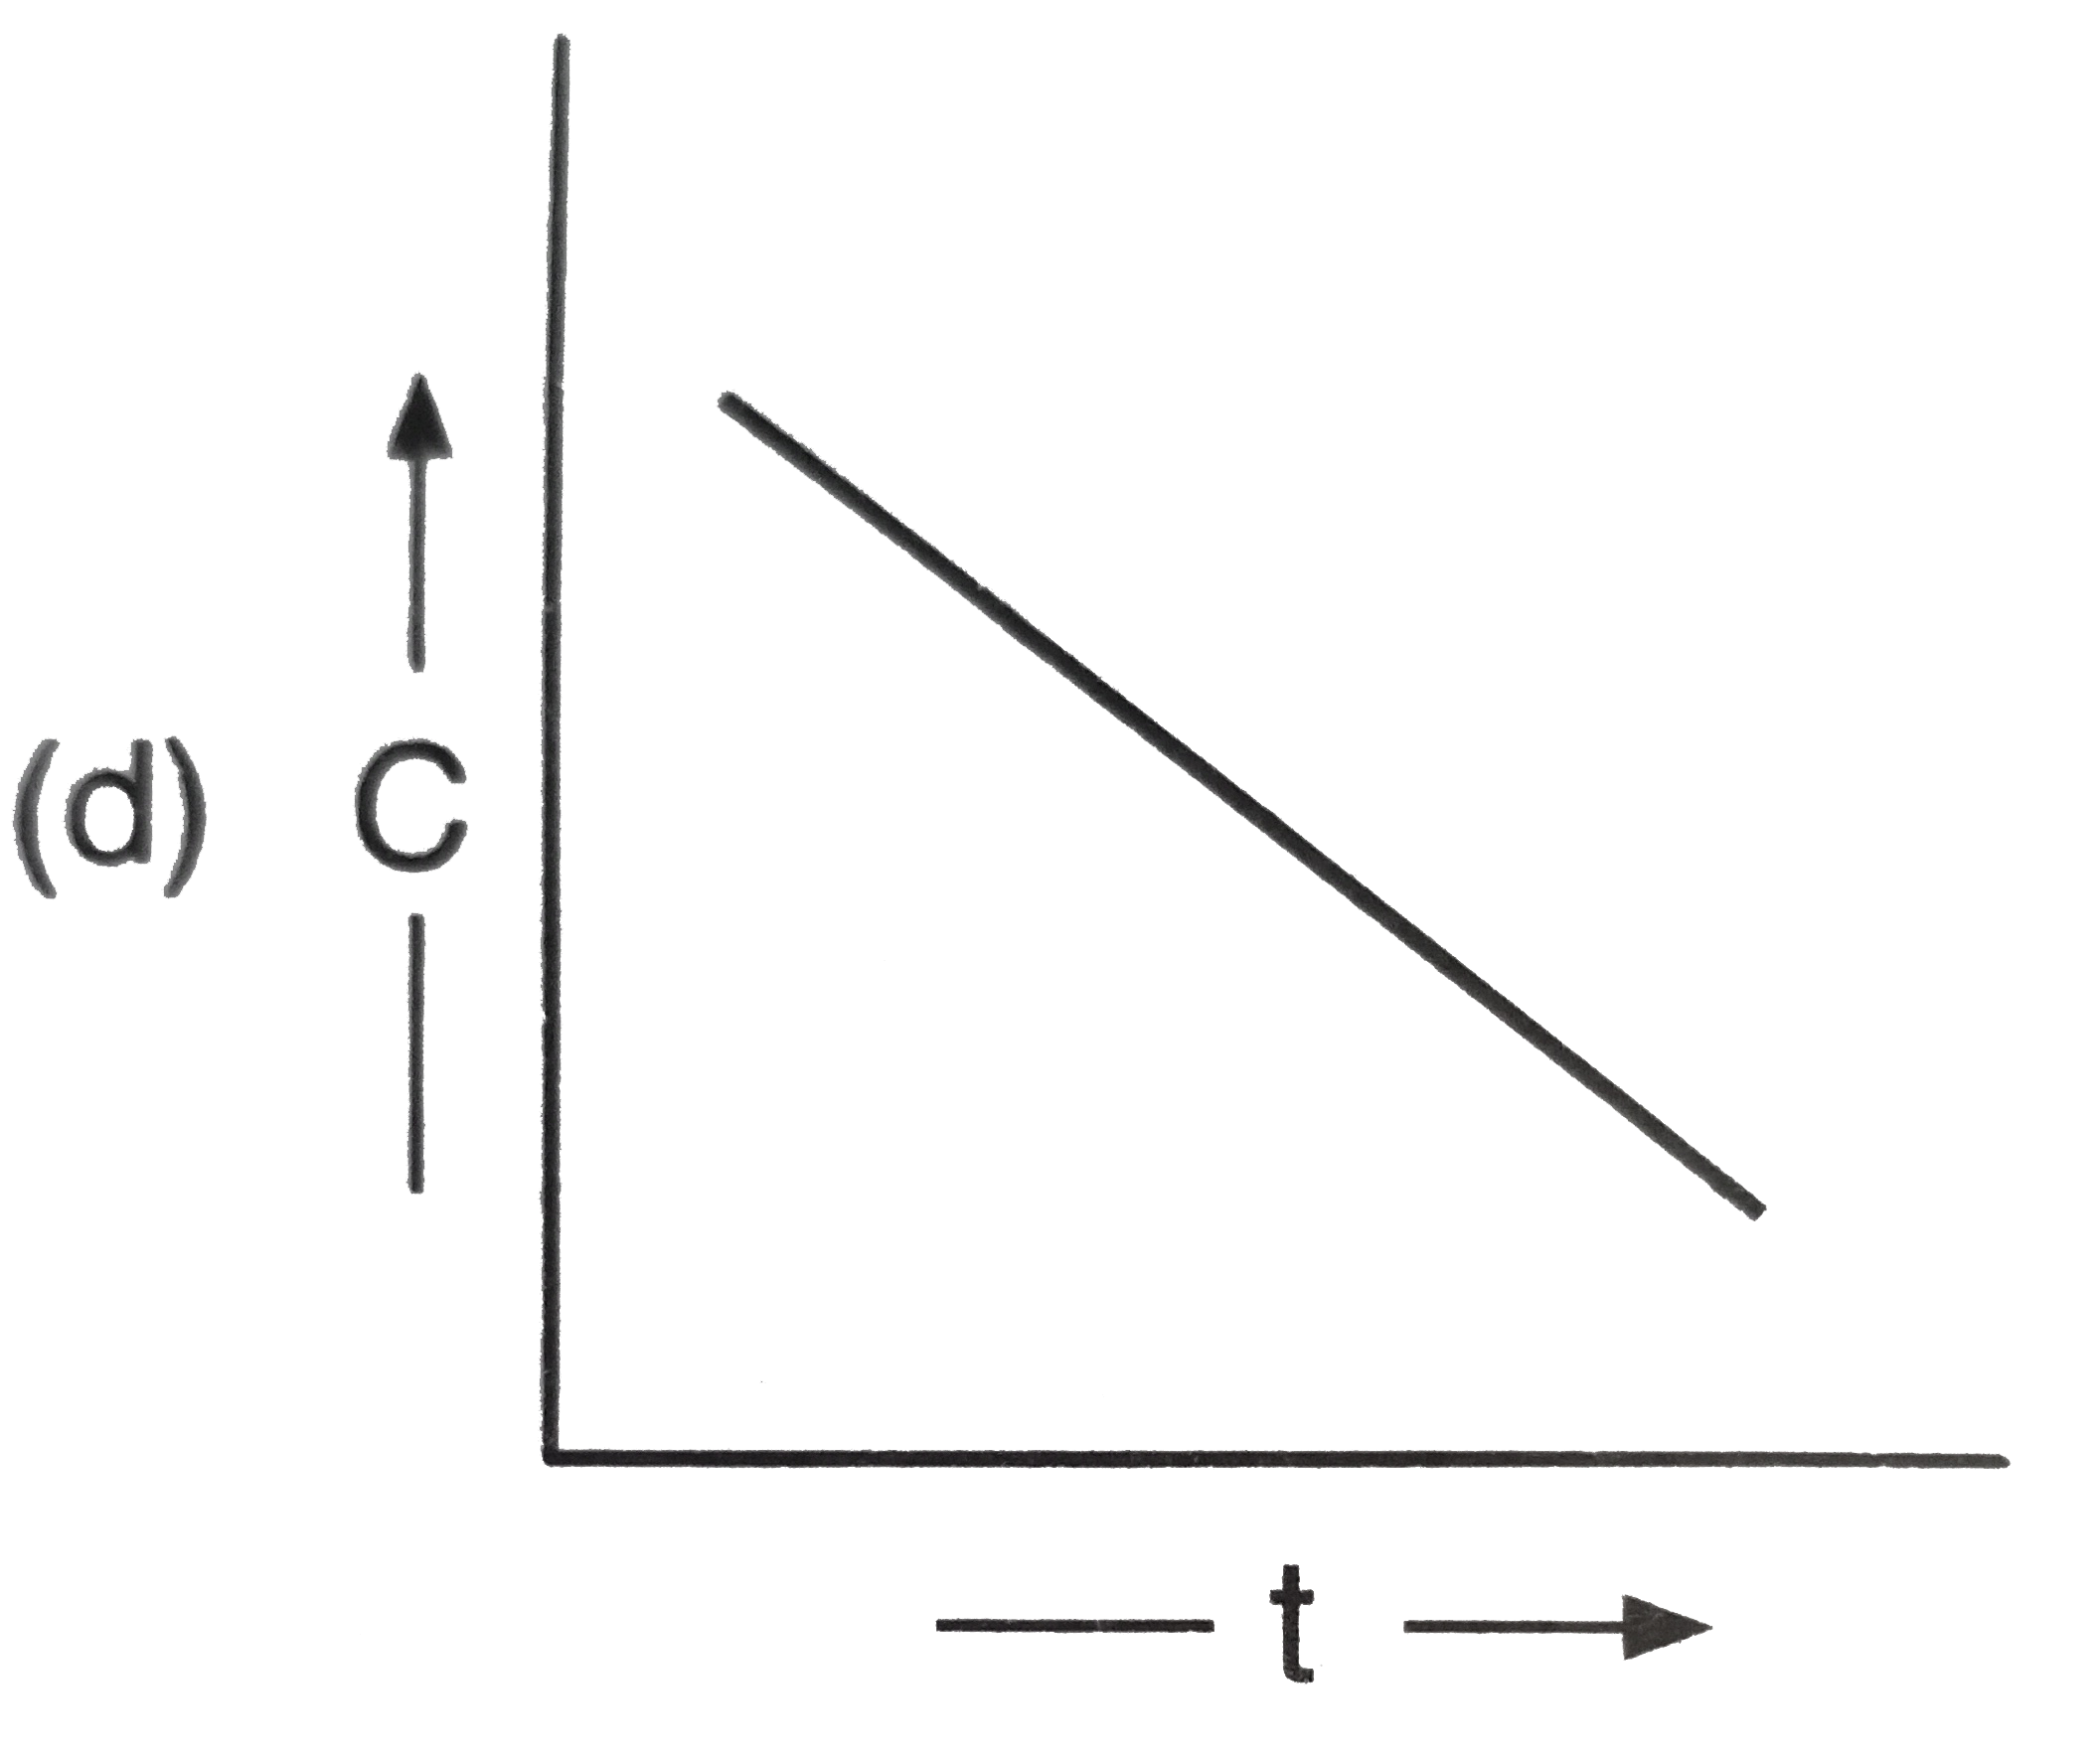
The plote between concentration versus time for a zero order reaction is represented by :
A B
B C
C D
D
The plote between concentration versus time for a zero order reaction is represented by :
A B
B C
C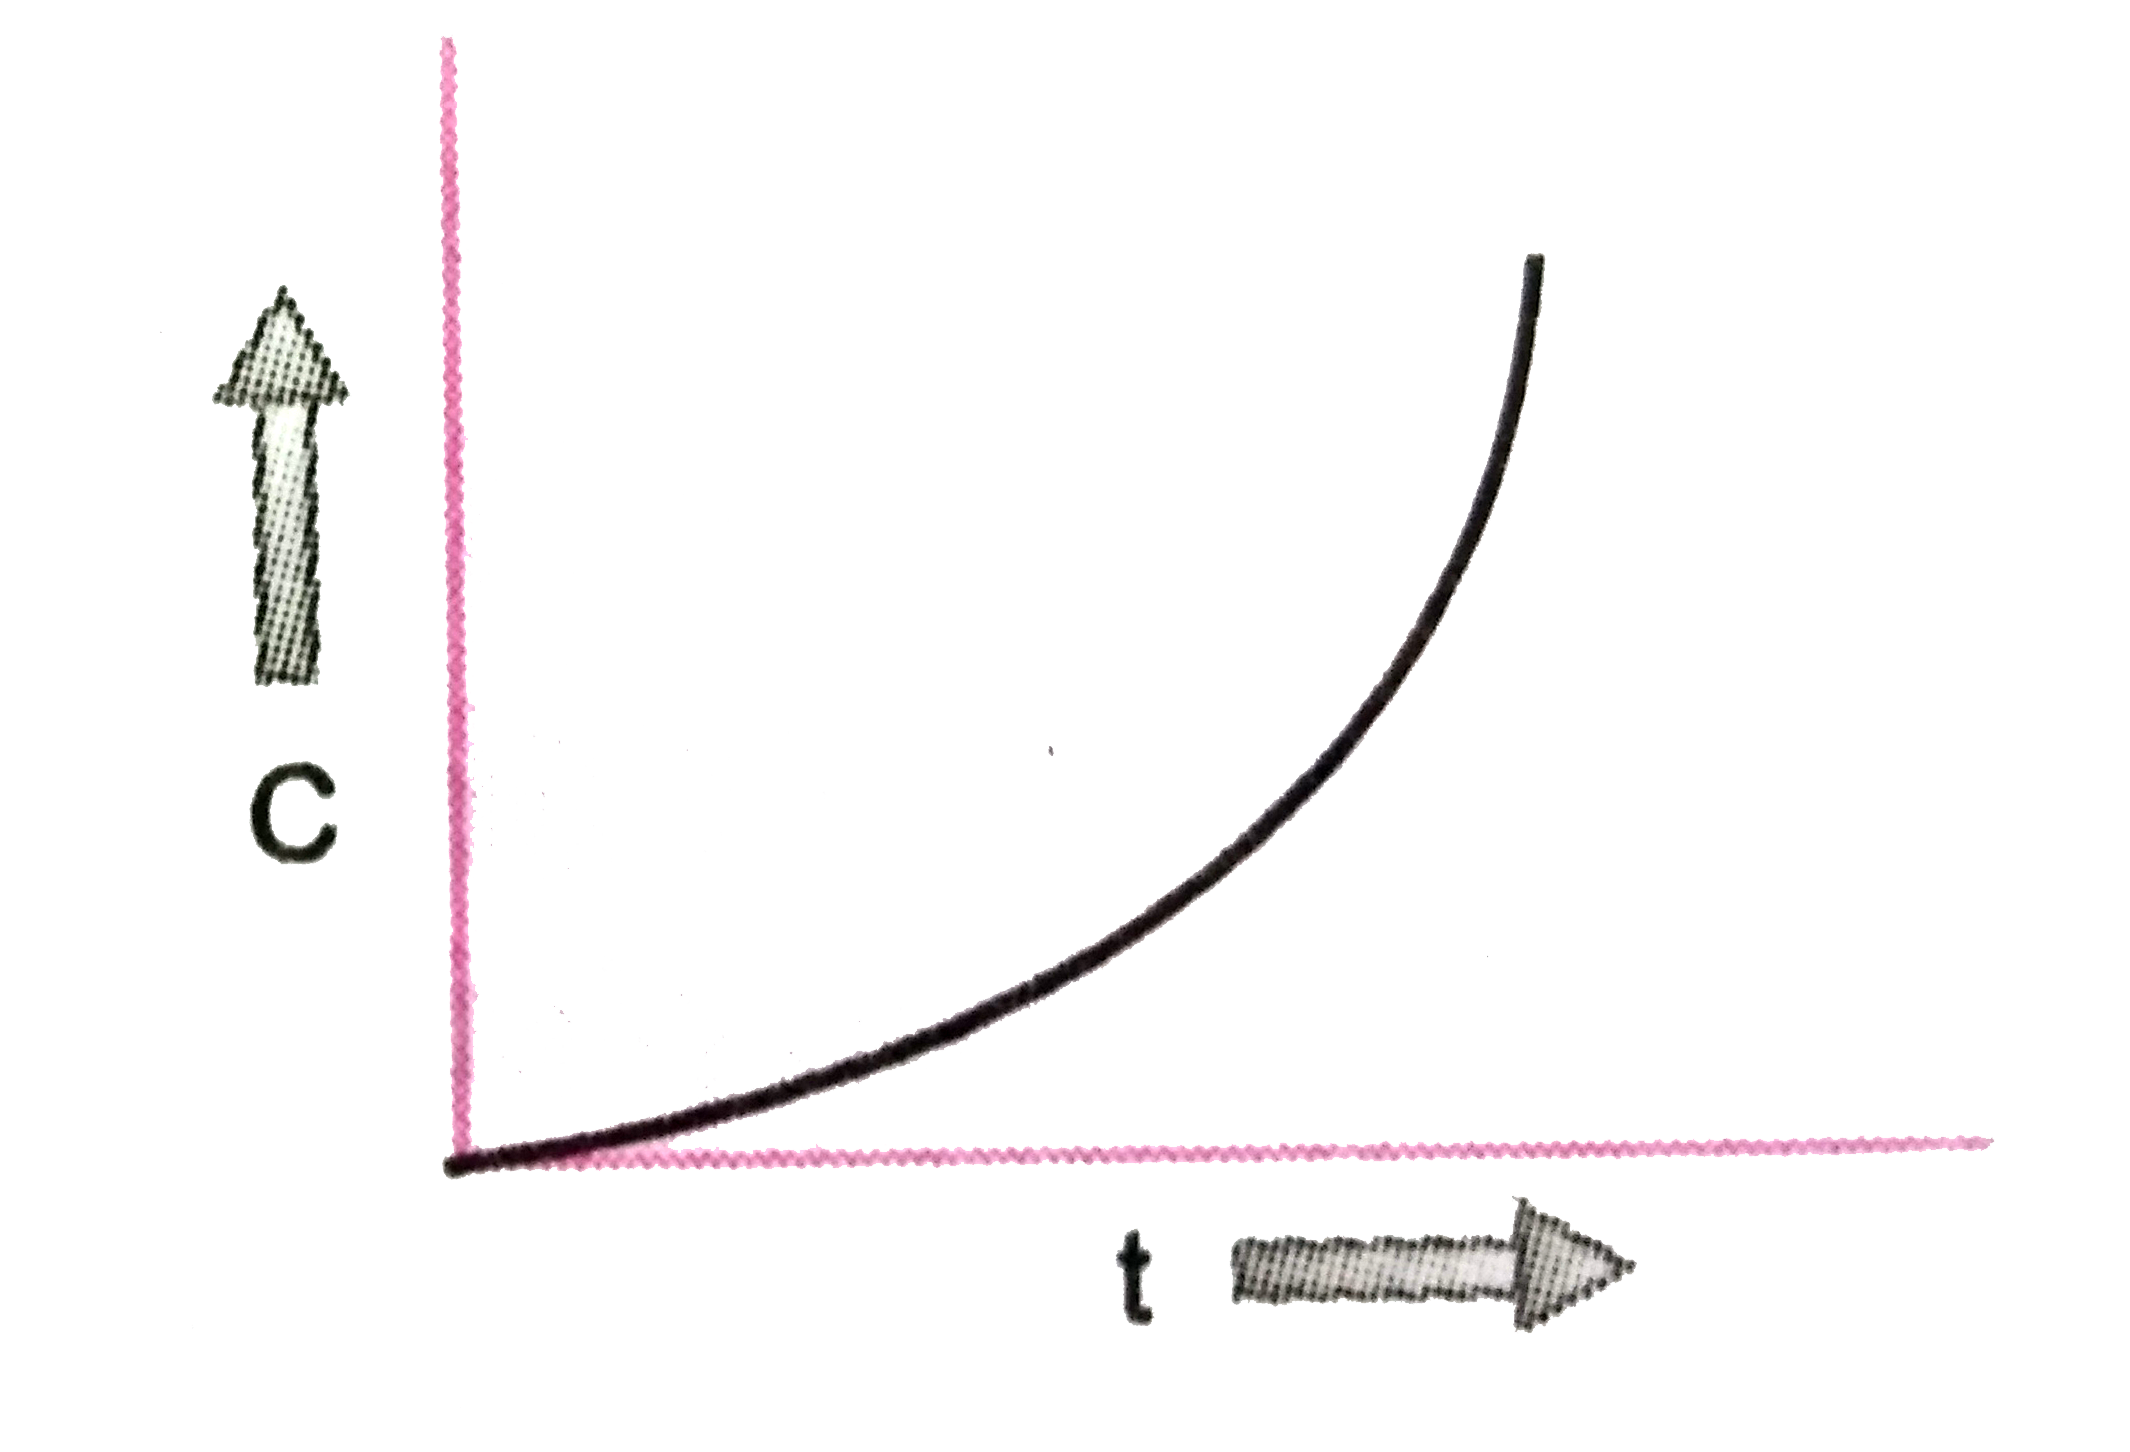 D
D
For a reaction X→Y, the graph of the product concentration (x) versus time (t) came out to be a straight line passing through the origin. Hence and time would be the graph of d[X]dt and the time would be
View SolutionFor a zero order reaction, the plot of concentration versus time is linear with
View SolutionFor a first order reaction: A3→3A, Following graph is observed when concentration vs. time graph is plotted. Identify the option which is correct.
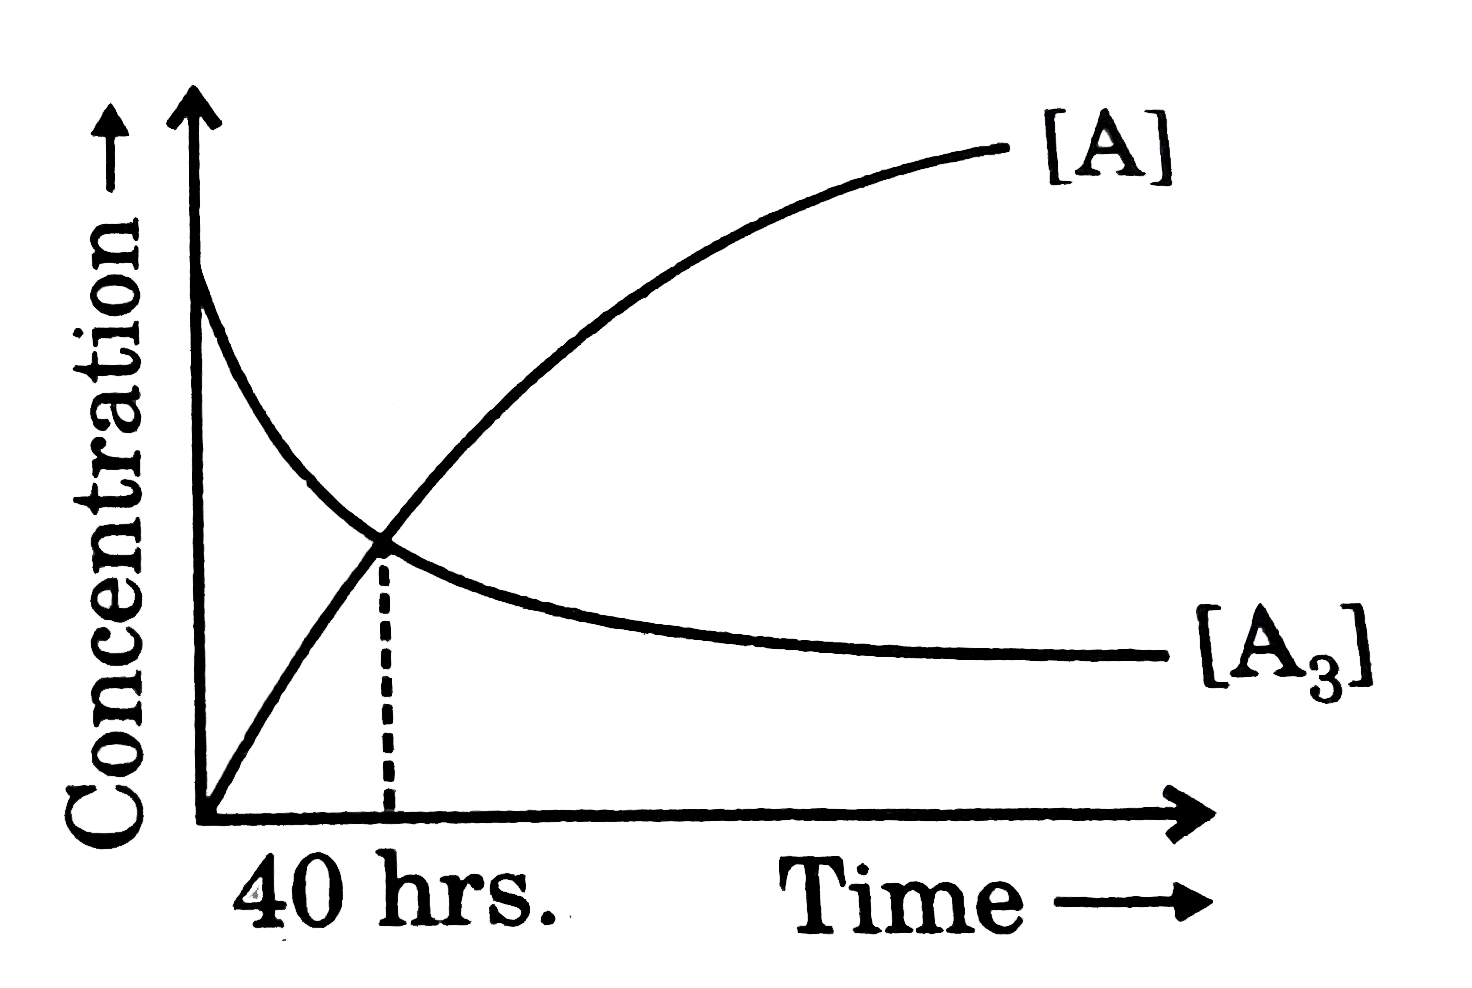
View SolutionThe graph between concentration (X) of the Product and time of the reaction A→B is of the type 1. Hence, graph between −d[A]dt and time will be of the type:
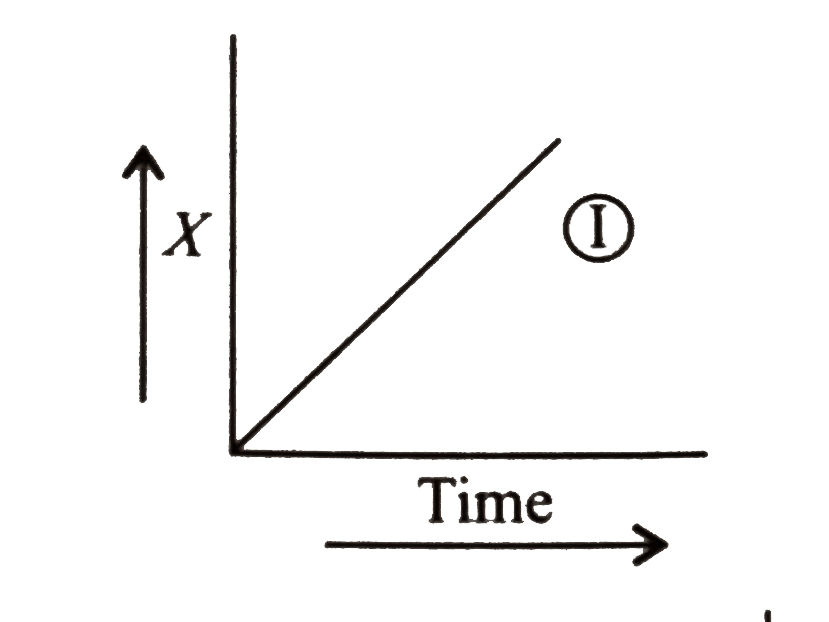
View SolutionFor a reaction, X → Y, the graph of the product concentration (x) versus (t) came out to be a straight line passing through the origin. Hence the graph of −d[X]dt and time would be
View Solution